2026 Nov Wk1 Weekly market observation

On trading week 2026-11-02 to 2026-11-06, for 2026 Nov Wk2.
I'll be sharing this on a weekly basis, either every Sunday/Monday.
1. Market temperature
(1) Nasdaq-100

- RED: risk 3/6 (high); entry 2/6 (low).
- Close near 26,990: 8.9% below its 50-day average and 3.6% below its 200-day average. Both recent and longer-term price trends remain weak.
- 20-session put/call premium 1.292, above the 0.80 alert and June-August high of 1.001.
- Put-heavy activity exceeds the earlier adjustment's peak, supporting a more defensive reading.
- It's been like a week since the premium ratio has emerged, therefore it's hard to justify whether the ratio has peaked.
- RSI 31.4; regular bullish divergence absent.
- The fall looks stretched, but improving momentum has not confirmed a turn.
(2) SOXX

- RED: risk 3/6 (high); entry 2/6 (low).
- Market is highly risk-aware, however there isn't clear signal for actual entrance.
- Close price of $136.5:
- -21.4% below its 50-day MA;
- -14.4% below 200-day MA.
- 20-session put/call premium 2.236, above the 1.50 alert line.
- Market is pricing more premium on puts; the level has exceed the local high of 2.06 during the June-Aug adjustment.
- RSI 30.45; regular bullish divergence absent; complete entry setup not met.
2. Liquidity check
(1) Stress

- RED: 5/6 stress conditions are active.
- Credit pressure persists despite some recovery in bank reserves.
(2) IG bonds

- Investment-grade spreads: 93 basis points (bp), 16 bp above their recent low, but 1 bp lower than the preceding Friday.
- Small weekly improvement has not erased the earlier rise in borrowing premiums.
(3) HY spreads

- High-yield spreads: 348 bp, 88 bp above their recent low and 4 bp higher over the week.
- Riskier corporate bonds show greater pressure than investment-grade bonds.
(4) Overnight rates

- SOFR 3.92% versus IORB 3.90%; SOFR was higher in all five latest sessions.
- The small but persistent 2 bp gap meets your overnight funding-pressure warning.
- Ten-year term premium: about 0.91 percentage points, dated 30 October.
- While it has peaked since the moment on early October when the US10Y has reached its high of 5.3%, is still at a rising channel. (term premium is on a mid-term rising channel due to macroeconomic uncertainties fueled by the ongoing US-Iran war, plus uncertainties on the US Treasury's T-bill heavy funding plan.)
(5) Reserve balances

- Bank reserves: $2.930tn, up $36.3bn over the week, but still below the $3.0tn reference.
- The reserve buffer has slightly recovered from its local low; from a mid-trend, reserve balances are getting lower since July.
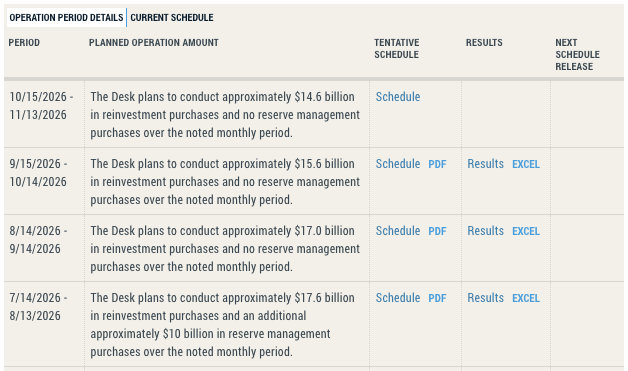
- Starting August 2026, the Fed has temporarily paused its RMPs program.
3. CTA trend proxy
(1) Equities

- All three equity-futures feeds are Short; the S&P 500 changed from Neutral to Short. Weakness now spans all three monitored equity benchmarks.
- Nasdaq-100 futures fell 5.08% last week, versus 2.78% for S&P 500 futures and 2.16% for Russell futures.
- Technology-related weakness is more pronounced than in the other equity benchmarks.
- All three remain above their past 12-months index values, while their returns relative to past 1, 3, 6-months values are negative.
(2) Treasuries

- Three maturities (2, 5, 10-years) remain Short; the 30-year changed from Short to Neutral.
- The longest maturity is improving, while most longer-term bond-price checks remain weak.
- Since early October when most long-term yields have peaked, the market shifted its position from 'Short bonds, Long AI' to its inverse: 'Short AI, Long Bonds and Non-AI'
- All four futures rose last week: 2-year +0.11%, 5-year +0.29%, 10-year +0.44% and 30-year +0.75%;
- The 30-year is 1.97% above its 21-day moving average, but still 2.46% below its 200-day moving average.
- The recovery is early and has not produced a Long signal.
- Considered as a reversion rather than a change in trend. Term premium on bonds still remain high; the market prefers bills than bonds in the current regime.
(3) Commodities

- 1/8 Long, 2/8 Neutral and 5/8 Short signals.
- Weak commodity trends dominate, with natural gas the sole Long exception.
- Gold and silver rose +4.51% and +5.41% last week, but both remain Short.
- The weekly rebound has not reversed their weaker multi-month trends.
- WTI and Brent fell 12.76% and 13.32%; both changed from Long to Neutral.
- Sharp weekly losses weakened oil trends.
- Natural gas changed from Short to Long and rose +3.45% over the week.
- The new Long signal sits only 0.92% above its 200-observation average.
- Copper and soybeans changed from Neutral to Short. Weakness has broadened.
4. Sector and industry rotation
(1) Sectors

- 6/11 sectors are Long, while 3/11 are Short and 2/11 are Neutral.
- Market weakness is uneven, with several sectors retaining upward trends.
- Health care (XLV) and consumer staples (XLP) lead SPY by 15.50% and 11.93% on the 3-mo comparison.
- Health care and staples leadership supports a more defensive market reading.
- Energy (XLE) is still Long and ahead of SPY by 8.03% over that window, despite falling 12.00% last week.
- Industrials (XLI), technology (XLK) and communications (XLC) are in Short signal. Due to most composing companies associated within the AI infrastructure buildout sector.
- Real estate (XLRE) changed from Neutral to Long and gained +1.92% last week. Property shares are improving while technology weakens.
(2) Industries

- 5/12 Long, 5/12 Short and 2/12 Neutral signals.
- Industry strength is selective rather than broad.
- Medical devices (IHI) and insurance (KIE) lead SPY by 9.10% and 5.86%; they gained +5.50% and +0.91% last week.
- Semiconductors (SOXX) losses are substantially larger than the broader Nasdaq-100 decline, fell 13.13% the past five trading days.
- Oil exploration/production (XOP) fell 14.72% the past five trading days and changed to Neutral; oil services (OIH) fell 13.47% and changed to Short.
- Home construction (ITB) changed from Short to Long; Software (IGV) changed to Short and Biotechnology (XBI) to Neutral.