June 2026 FOMC Minutes Evaluation⎯Inflation, JOLTS Labor Market Signals, and Reserve Balances
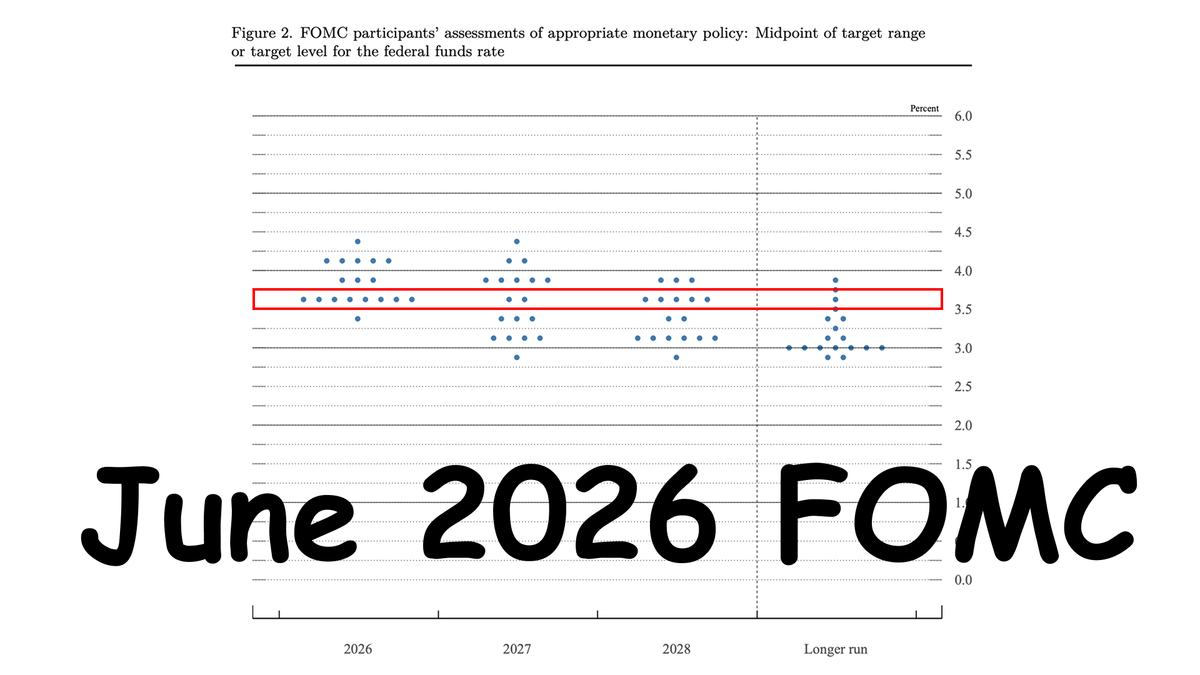
Meeting: June 16–17, 2026 Minutes released July 8, 2026
Statement:
- Hold at 3.50–3.75 percent, 12–0 unanimous.
- IORB 3.65 percent.
- Primary credit rate 3.75 percent.
Supplementary data: June 2026 Employment Situation (BLS, released July 2, 2026), FRED, JOLTS.
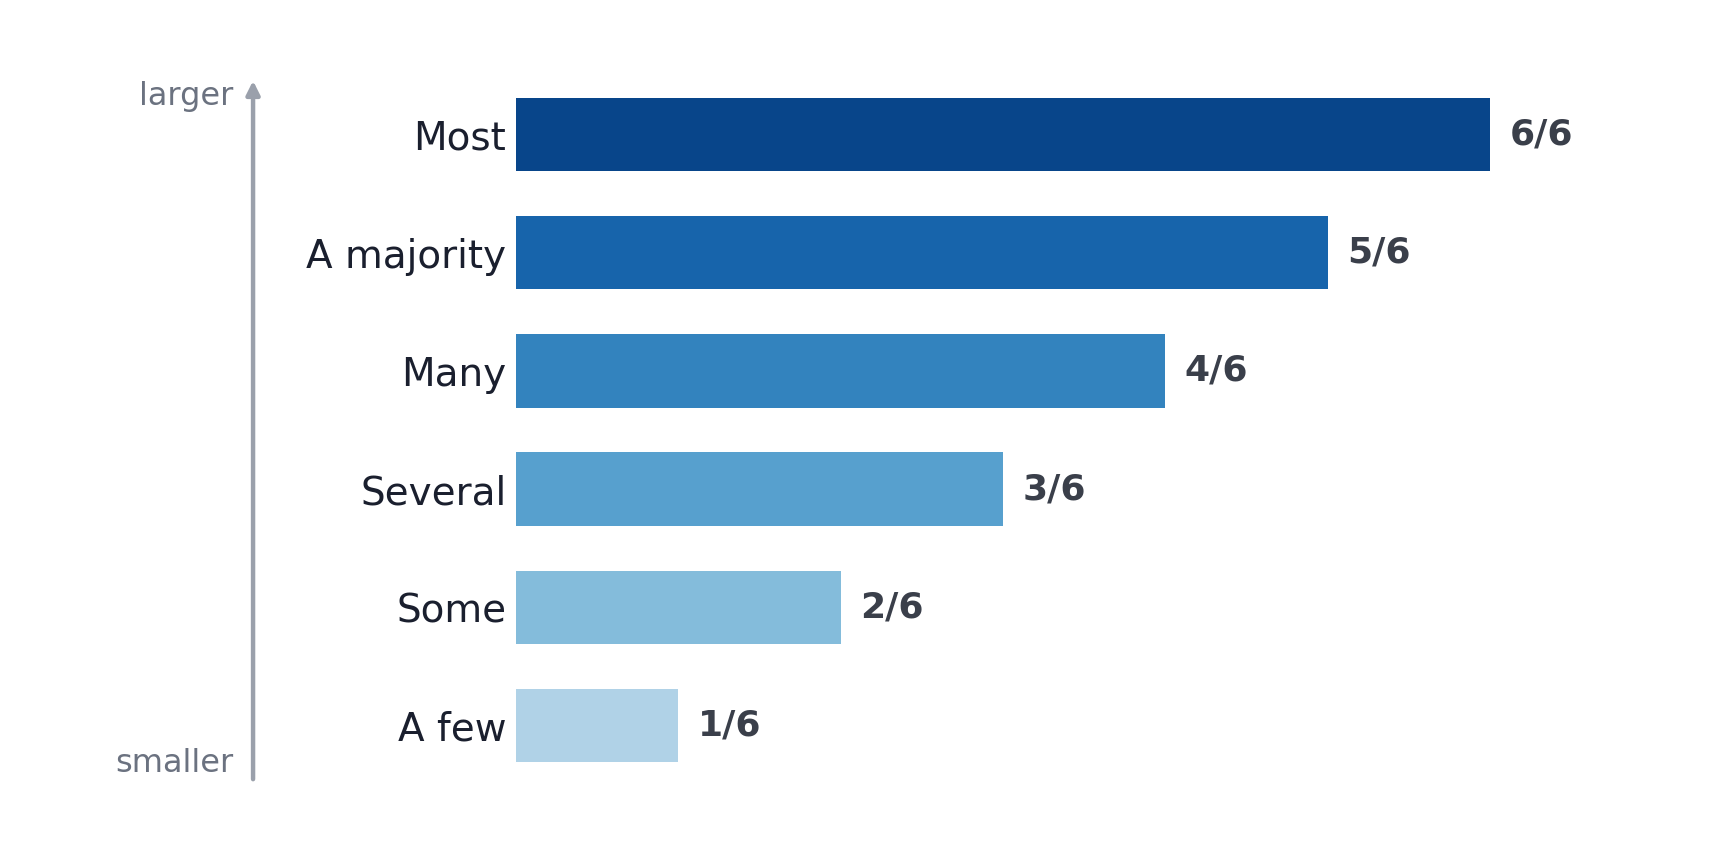
The minutes quantify participant views with a fixed vocabulary. Descending in size: Most → A majority → Many → Several → Some → A few.
This analysis reads the June minutes against the data that arrived after the meeting closed.
It works through four questions in order:
- Why inflation stayed sticky as its most visible cause (oil prices) receded,
- How AI enters the Committee's price outlook on both sides at once,
- What the June employment report did to the labor-market judgment the hawkish perspective rests on,
- and Why bank reserves are still called ample.
1. Inflation Is Sticky Even as Its Obvious Cause Fades
1.1 The timing problem
Optimism around a near-term resolution of the Middle East conflict, and the announcement of a U.S.–Iran memorandum of understanding, pushed the oil futures curve and near-term inflation compensation materially lower relative to April. The statement attributed part of the elevated inflation to "supply shocks that have driven price increases in certain sectors, including energy."
The identifiable shock was, at the moment of the meeting, in retreat. And yet the staff hardened rather than softened its inflation language. Risks to the inflation projection were "more skewed to the upside," and the staff continued to view the possibility that inflation would be more persistent than projected as a salient risk. The two grounds cited:
- Inflation has run significantly above 2 percent over the past five years.
- Some emergent price pressures appeared unrelated to tariffs or energy prices.
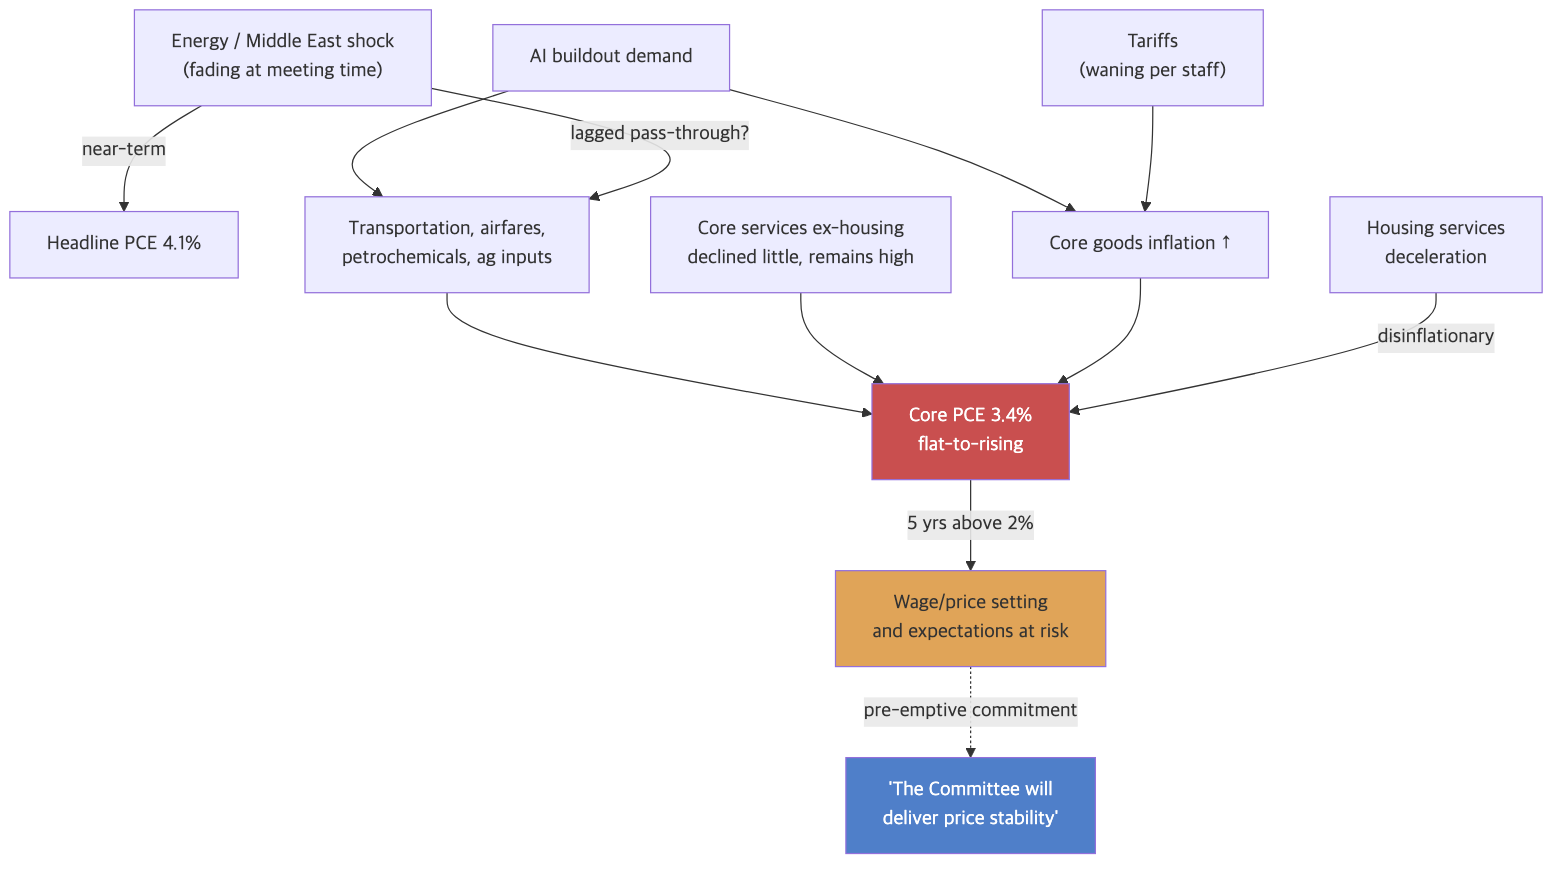
The second point is the important one. Take out the two causes everyone can name and date — tariffs and energy — and what is left over is not shrinking. The staff raised its inflation forecast for this year and next relative to April, and projected total inflation to slow in H2 2026 as retail gasoline declines, while core inflation was forecast to change little over the rest of the year.
1.2 What the price data was showing

Core PCE has climbed 3.05% (Feb) → 3.25% (Mar) → 3.32% (Apr) → 3.41% (May).
The staff's decomposition:
- Core goods inflation had risen relative to a year earlier, largely reflecting tariffs and AI-related price pressures.
- Core services had been relatively stable — a gradual decline in housing services roughly offset by a modest step-up in core non-housing services.
- That offset is why core inflation will not fall. Housing costs — the biggest single piece of core inflation, and normally the part that drags it down — are cooling, and yet the total is not moving.
Concisely summarizing:
- core goods ↑
- core services ⟷
- core housing services ↓
- core non-housing services ↑
- core PCE ↑
1.3 What participants said about how broad the inflation was
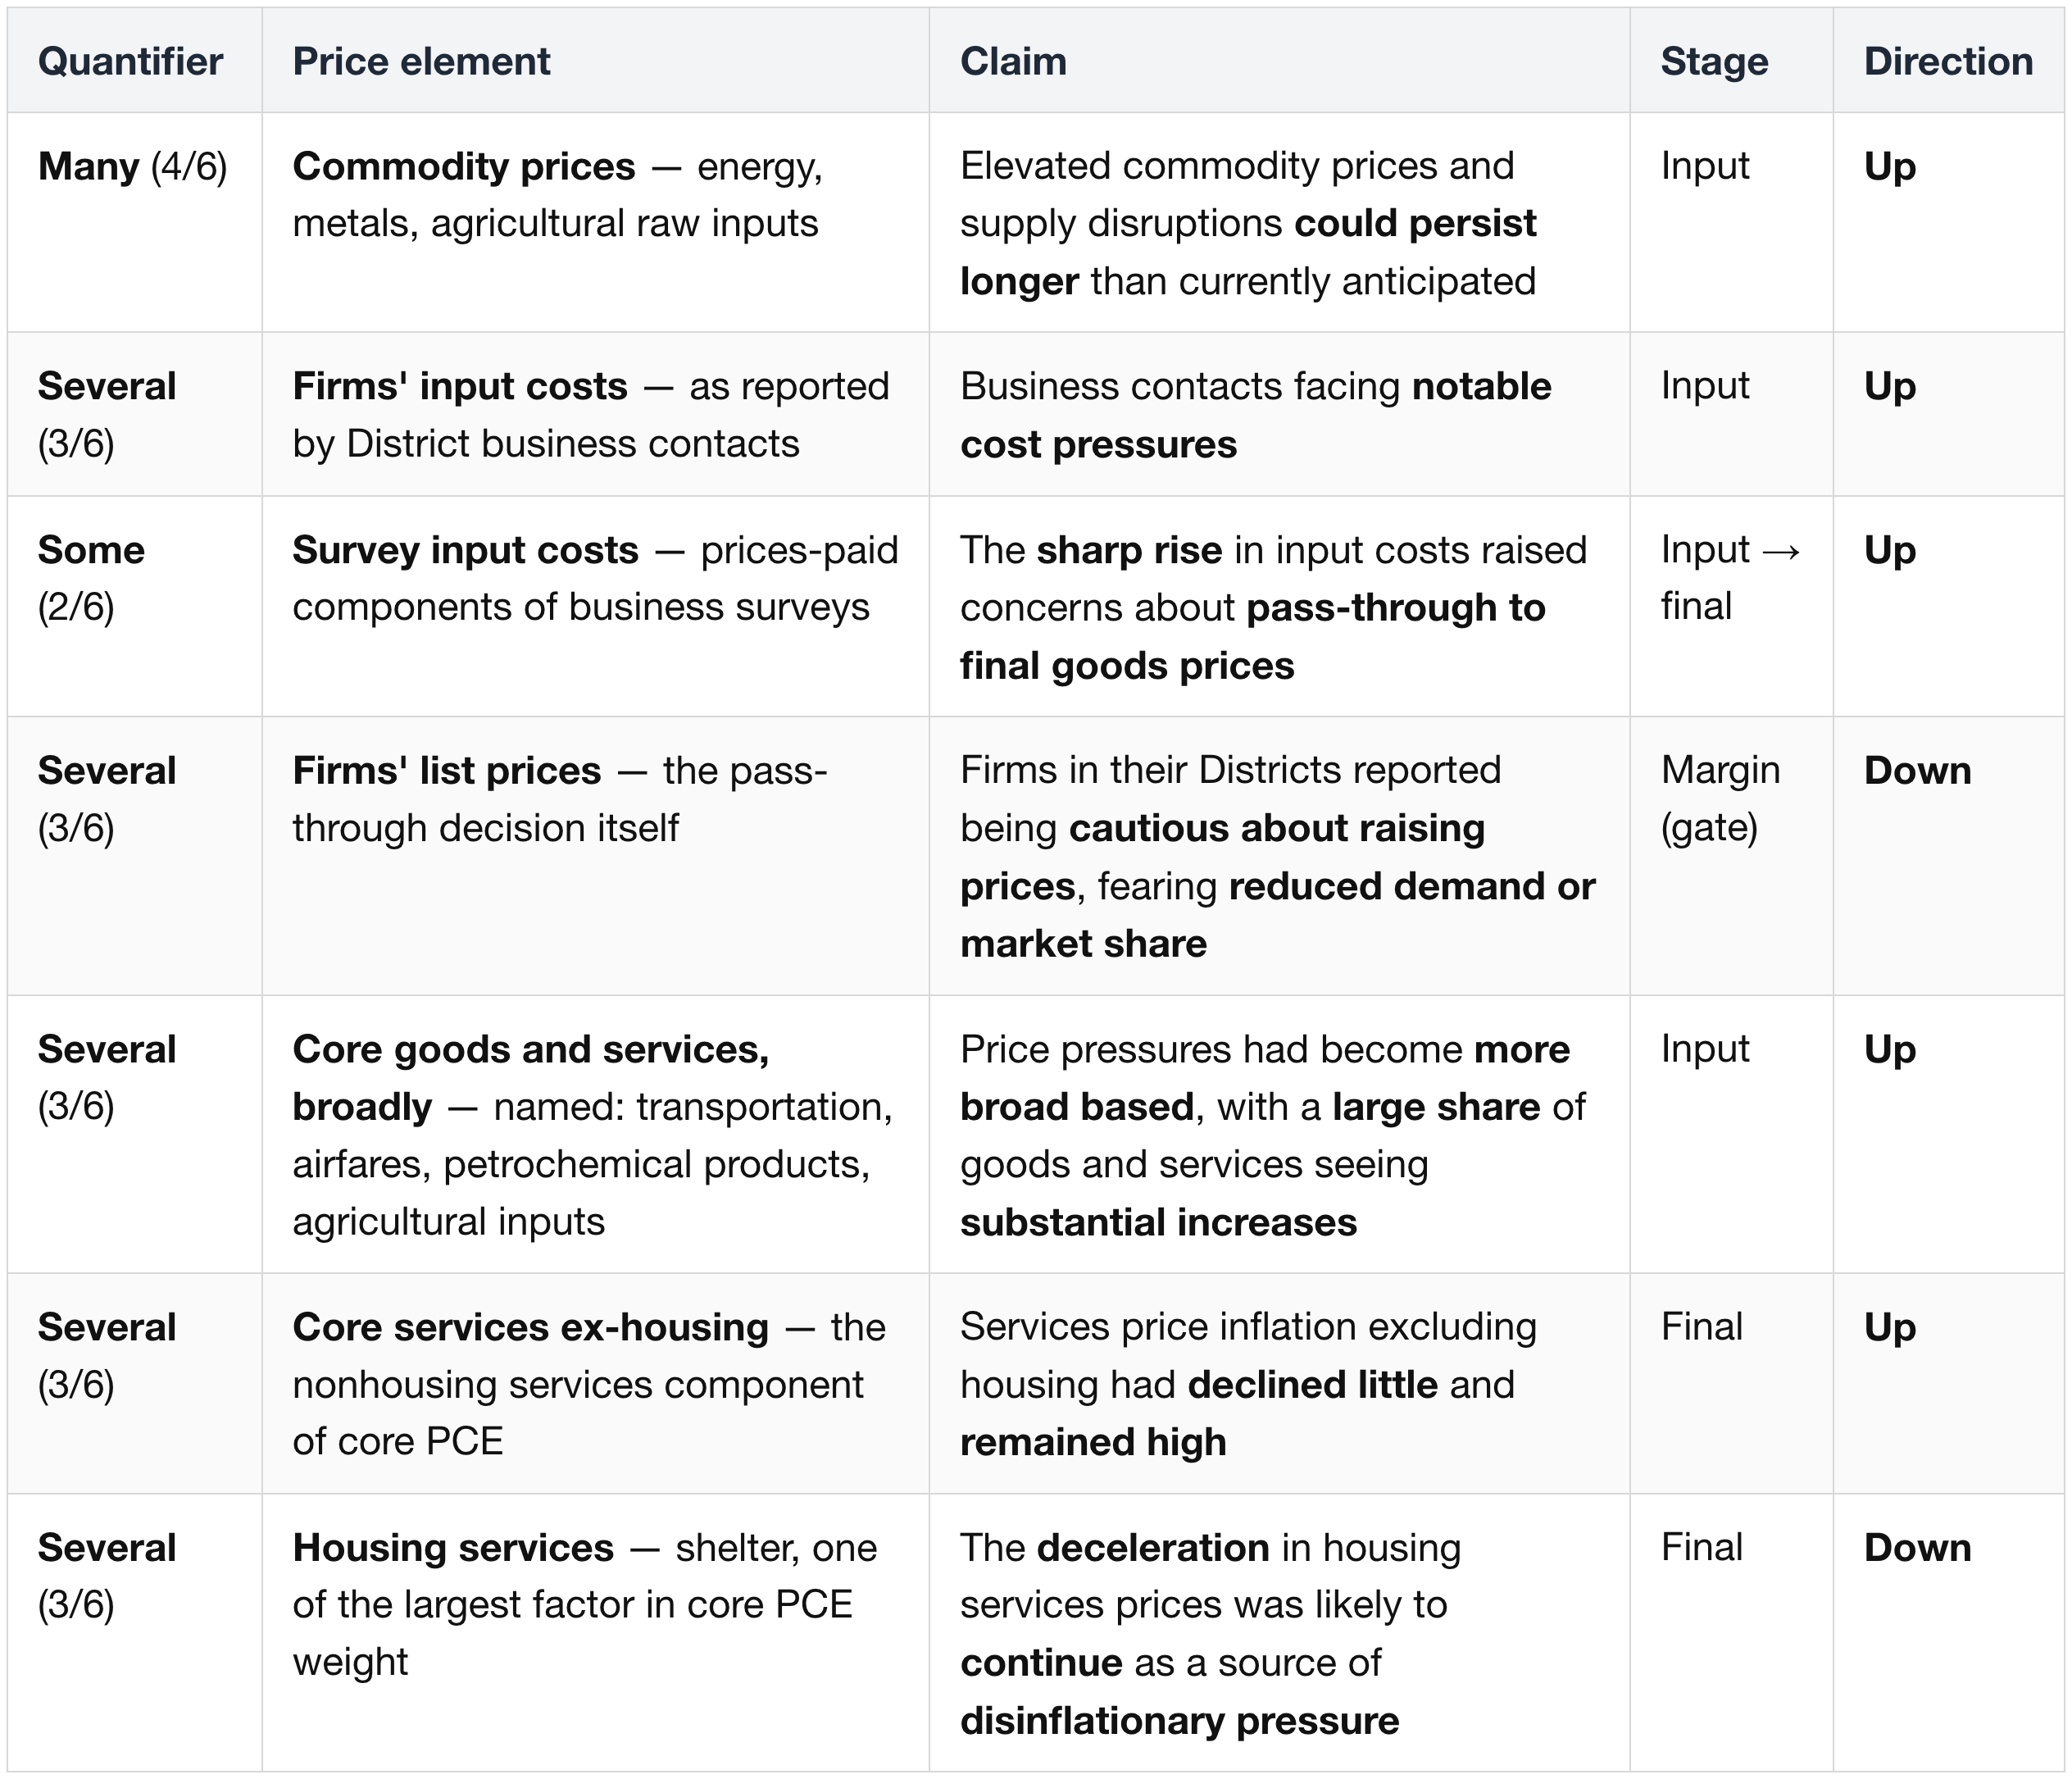
Seven statements, ordered along the cost chain — from raw inputs, to the point where firms decide whether to pass higher costs into their prices, to final prices.
The cost chain is categorized in three phases:
- Input (the raw materials),
- Margin (the mid-process elements),
- and Final (the outcome)
5/7 push inflation up, 2/7 push it down.
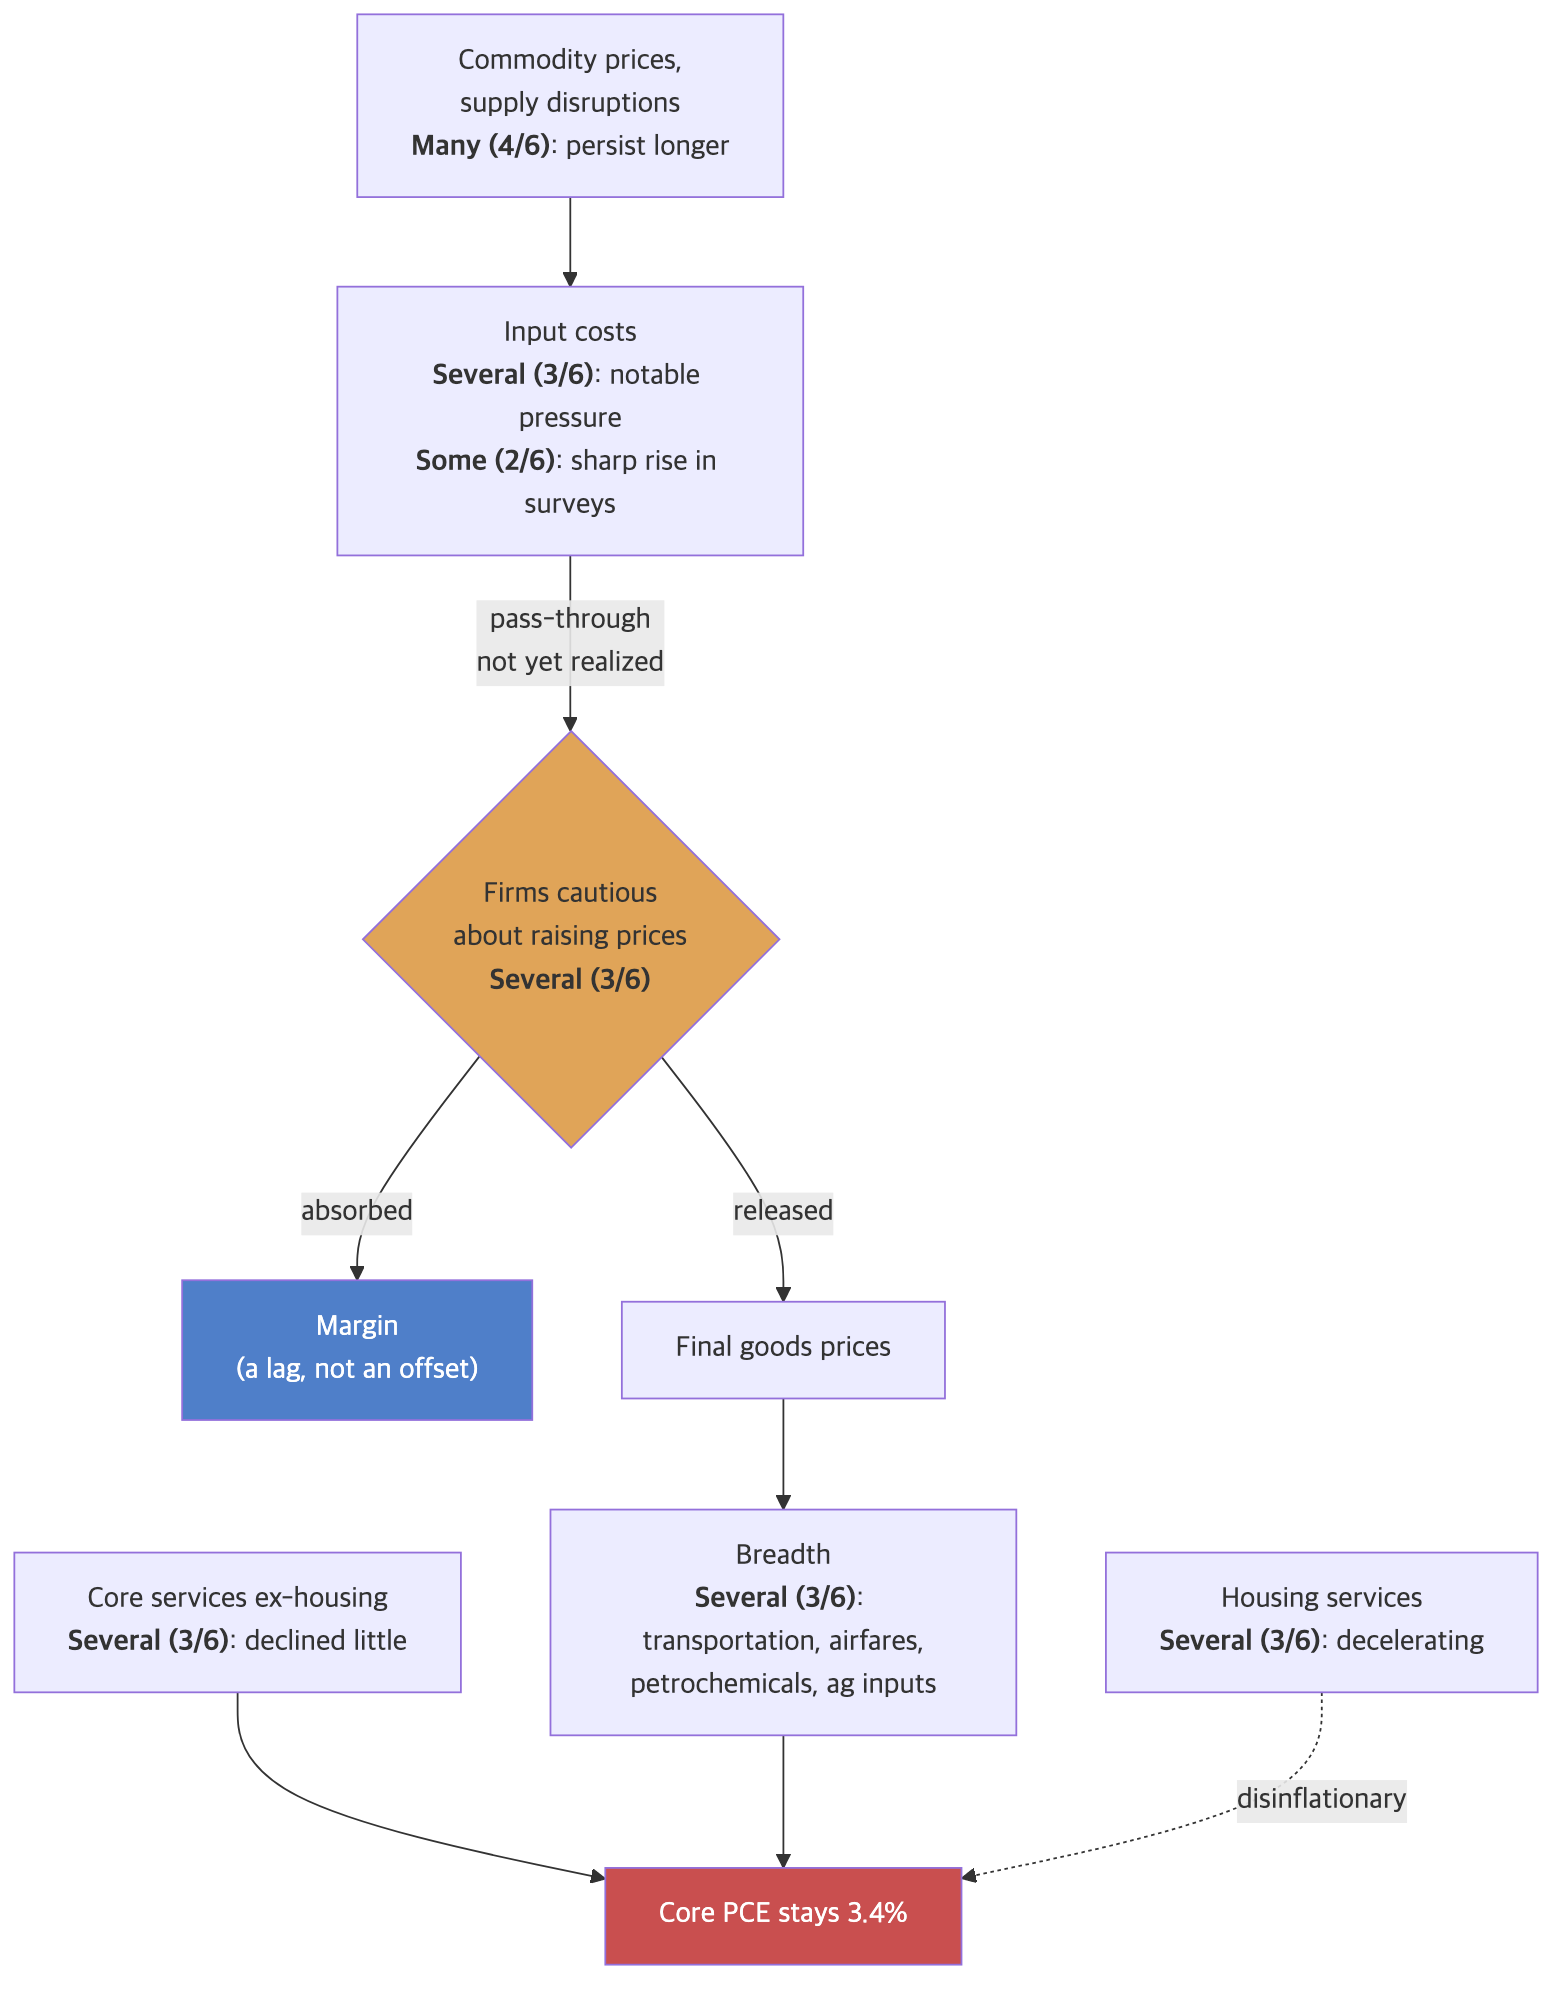
Laid out as a pipeline (excluding services), the cost pressure has reached the input stage and is being absorbed in firms' profit margins rather than passed on to buyers:
Two readings of the breadth list:
- Every named category is an energy derivative one production stage downstream.
- Petrochemicals and agricultural inputs run on crude and natural gas;
- Airfares and transportation run on jet fuel and diesel.
- Reading A — the energy shock is the cause, just arriving late.
- Oil prices spiked; it takes months for that to reach an airline's jet fuel and a chemical plant's feedstock.
- These are not four separate inflations. They are one oil shock, showing up late in four places.
- Oil is already falling — the futures market has already priced in the US-Iran agreement.
- So the four categories will follow it down.
- What it means for policy: hold, and let the shock fade on its own.
- Reading B — broad demand is the cause, and these four just happen to be energy-heavy.
- When spending across the whole economy runs hot, prices rise everywhere.
- The categories that jump first and hardest are the ones with the biggest, fastest-moving costs — which are the energy-heavy ones.
- So the four names show which categories move fastest, not what is causing the rise.
- Oil falling does not make the underlying demand go away.
- What it means for policy: holding lets a demand-driven inflation keep running, while you wait for a fade that never comes.
- The minutes name what is driving that demand: AI.
- Most participants: the economy growing faster than it sustainably can, "owing in part to strong AI business investment," could make inflation more persistent — the strongest quantifier on any cause in the document.
- Many participants: demand for AI infrastructure keeps pushing up prices for tech products and electricity.
- Staff: part of the rise in core goods prices is "AI-related price pressures."
- An AI building boom does not fade on the same schedule as an oil price. See §2.
- What supports Reading B in the text. The staff's own words: some emerging price pressures were "unrelated to tariffs or energy prices." Subtract both nameable causes and something is still left.
- The weak point in Reading B. None of the four categories is one AI pushes on directly (which are tech products and electricity).
- Linking AI to these four names is an inference, not something the minutes say.
- For Reading B to work, AI has to act through the broad channel — the economy running hot overall — not through the electricity bill.
The minutes never say which reading they hold. The staff's wording leans toward B; the list of categories looks like A. Same seven statements, same four names, opposite policy conclusions.
The pricing-caution point is the section's one piece of dovish evidence, and it is fragile:
- It says firms have not raised prices yet — not that they never will.
- The reason given is fear of losing customers, not the absence of cost pressure.
- Firms are eating the cost in their margins. That is a delay, not a cancellation.
The spring 2026 earnings calls — the latest before (and, for PepsiCo, just after) the June meeting — supply the corporate testimony for each leg:
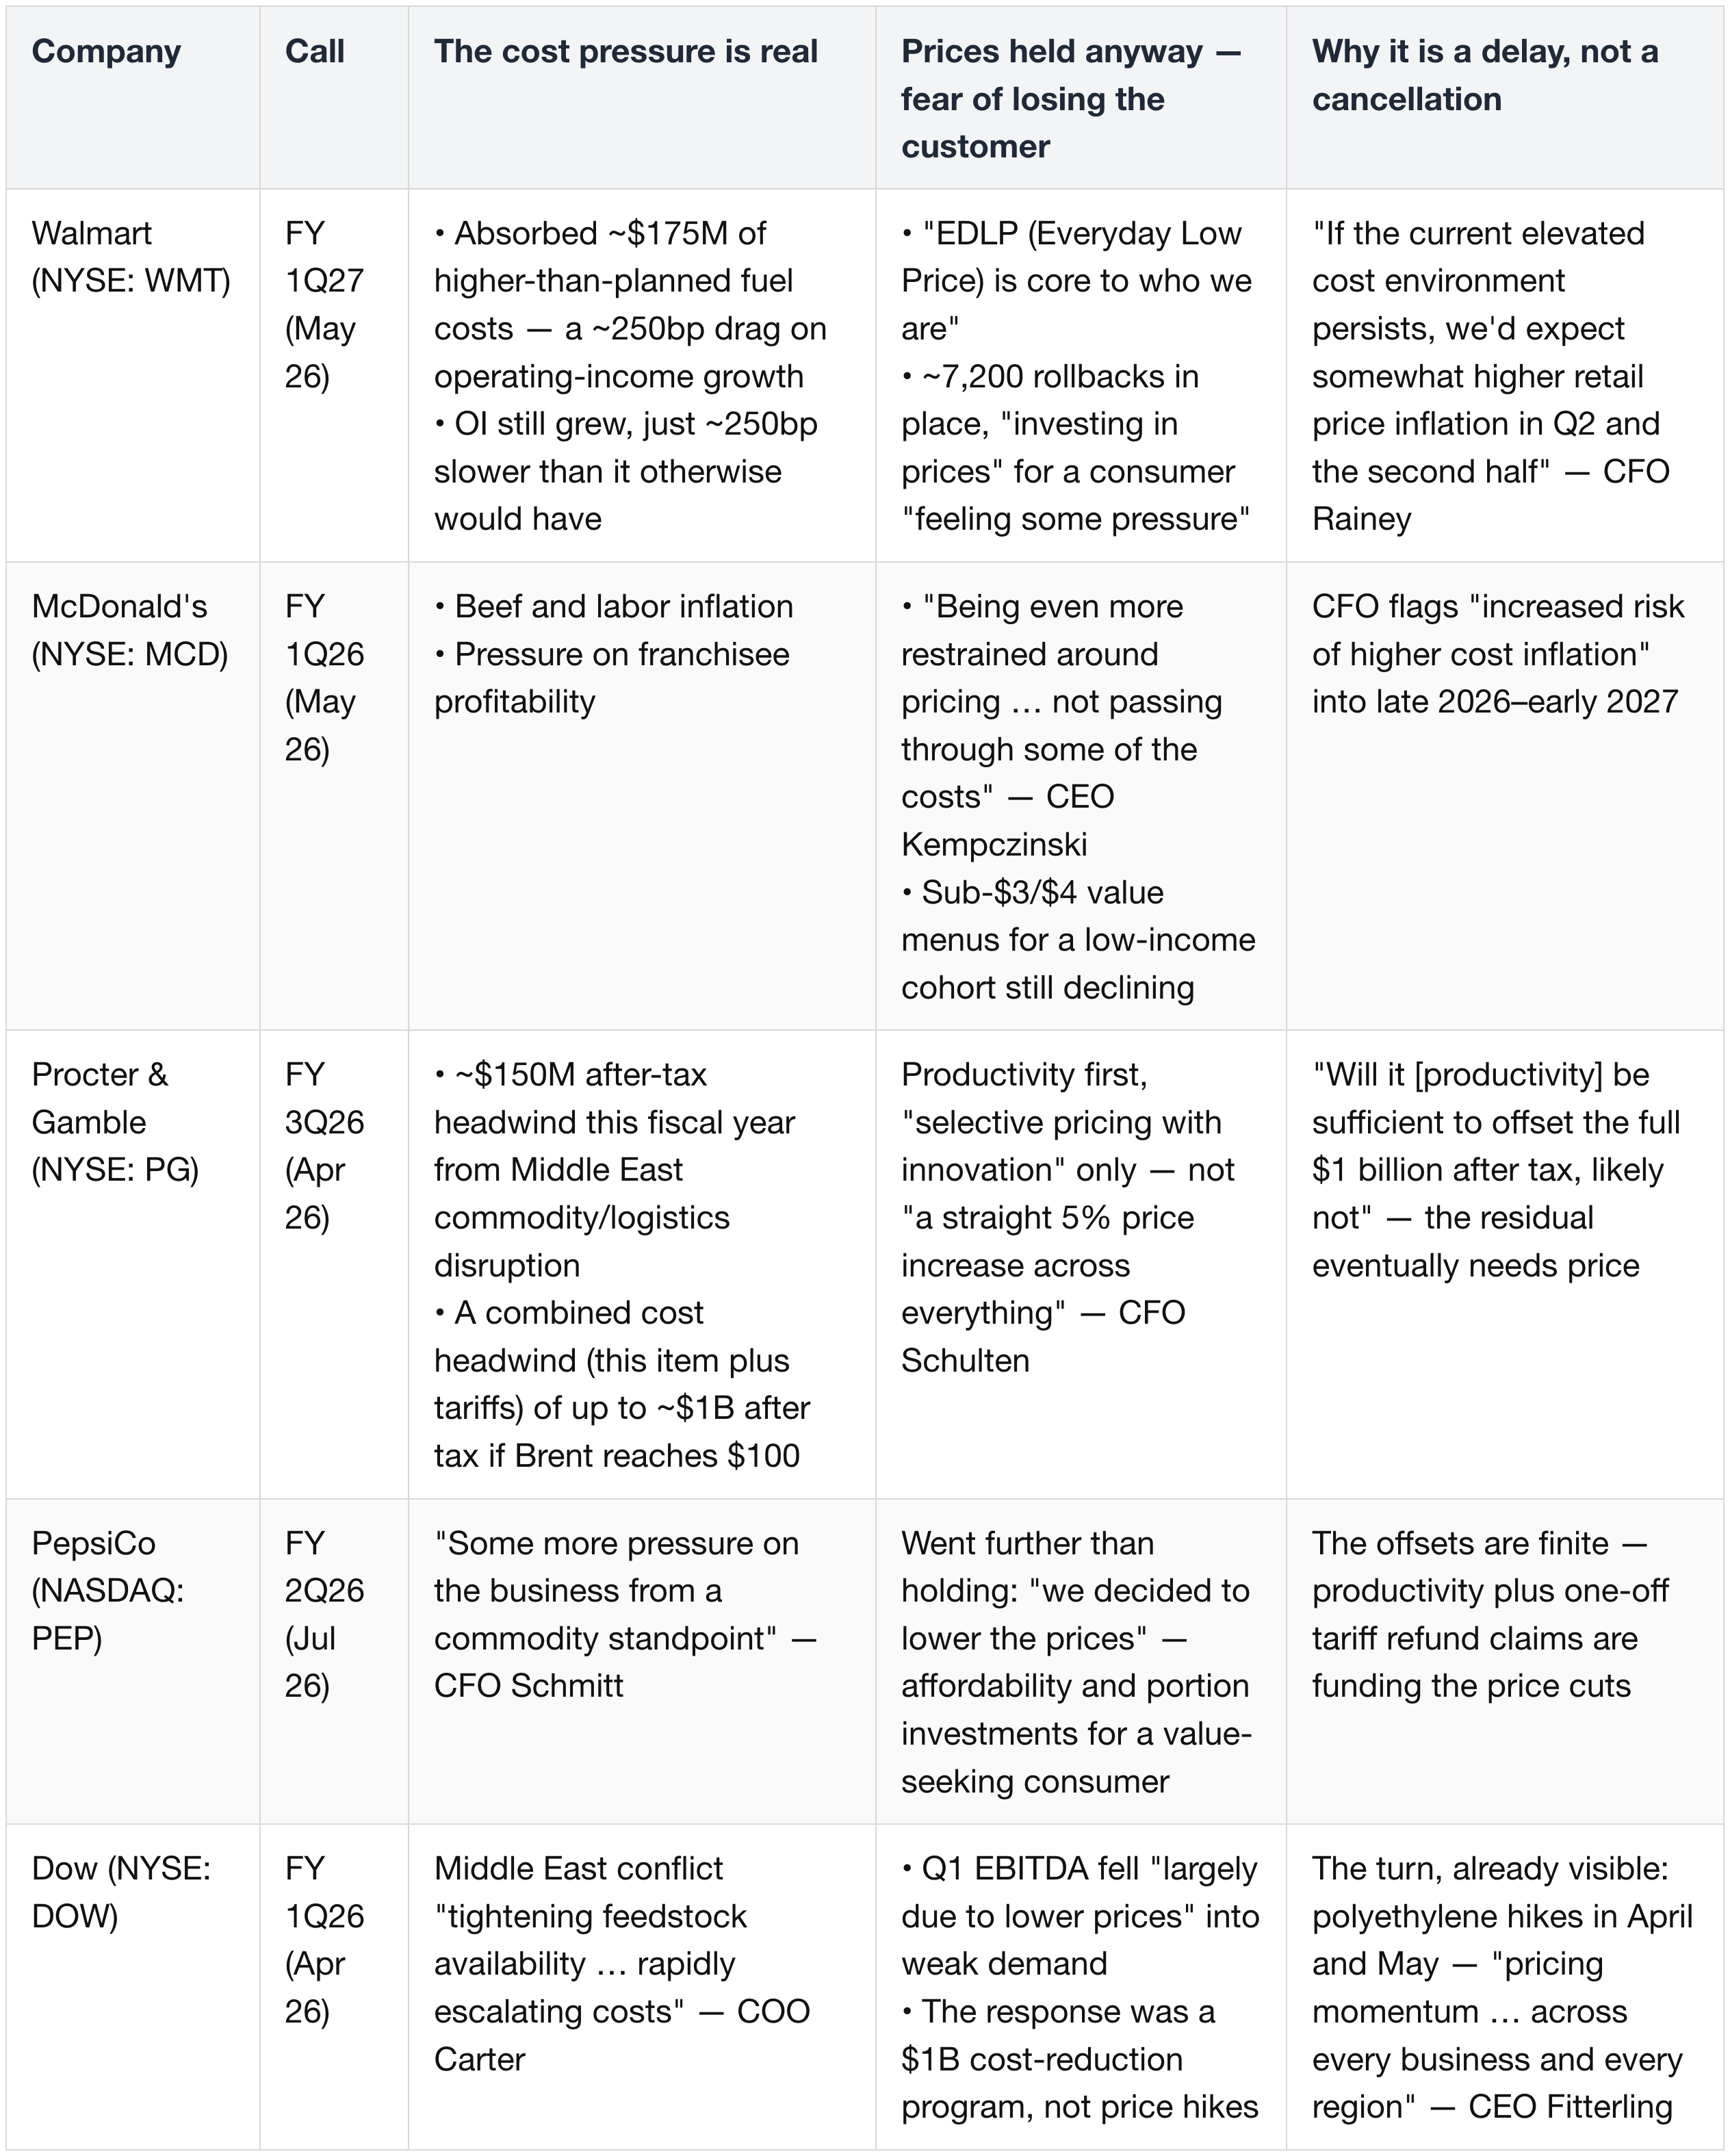
Read down the last column: the restraint is conditional everywhere. Walmart names the condition (costs persist → retail price inflation in H2), P&G quantifies the shortfall productivity cannot cover, and Dow — the furthest upstream of the five — has already flipped from absorbing to raising. The margin is a queue, not a sink.
1.4 Inflation expectations: still anchored, but at risk
- The majority of participants commented that most measures of medium- and longer-term inflation expectations remained at levels consistent with the 2 percent objective.
- The majority of participants highlighted the possibility that, after several years of inflation above 2 percent, continued elevated inflation rates could begin to affect inflation expectations and wage- and price-setting decisions.
Both sentences come from a majority, and they do not conflict — they describe a line that has not yet been crossed. This is the clearest reason the statement added the sentence "The Committee will deliver price stability." It is not a forecast. It is a promise made before expectations move, meant to keep them from moving.
2. How AI Pushes Inflation Up — and Who on the Committee Said So
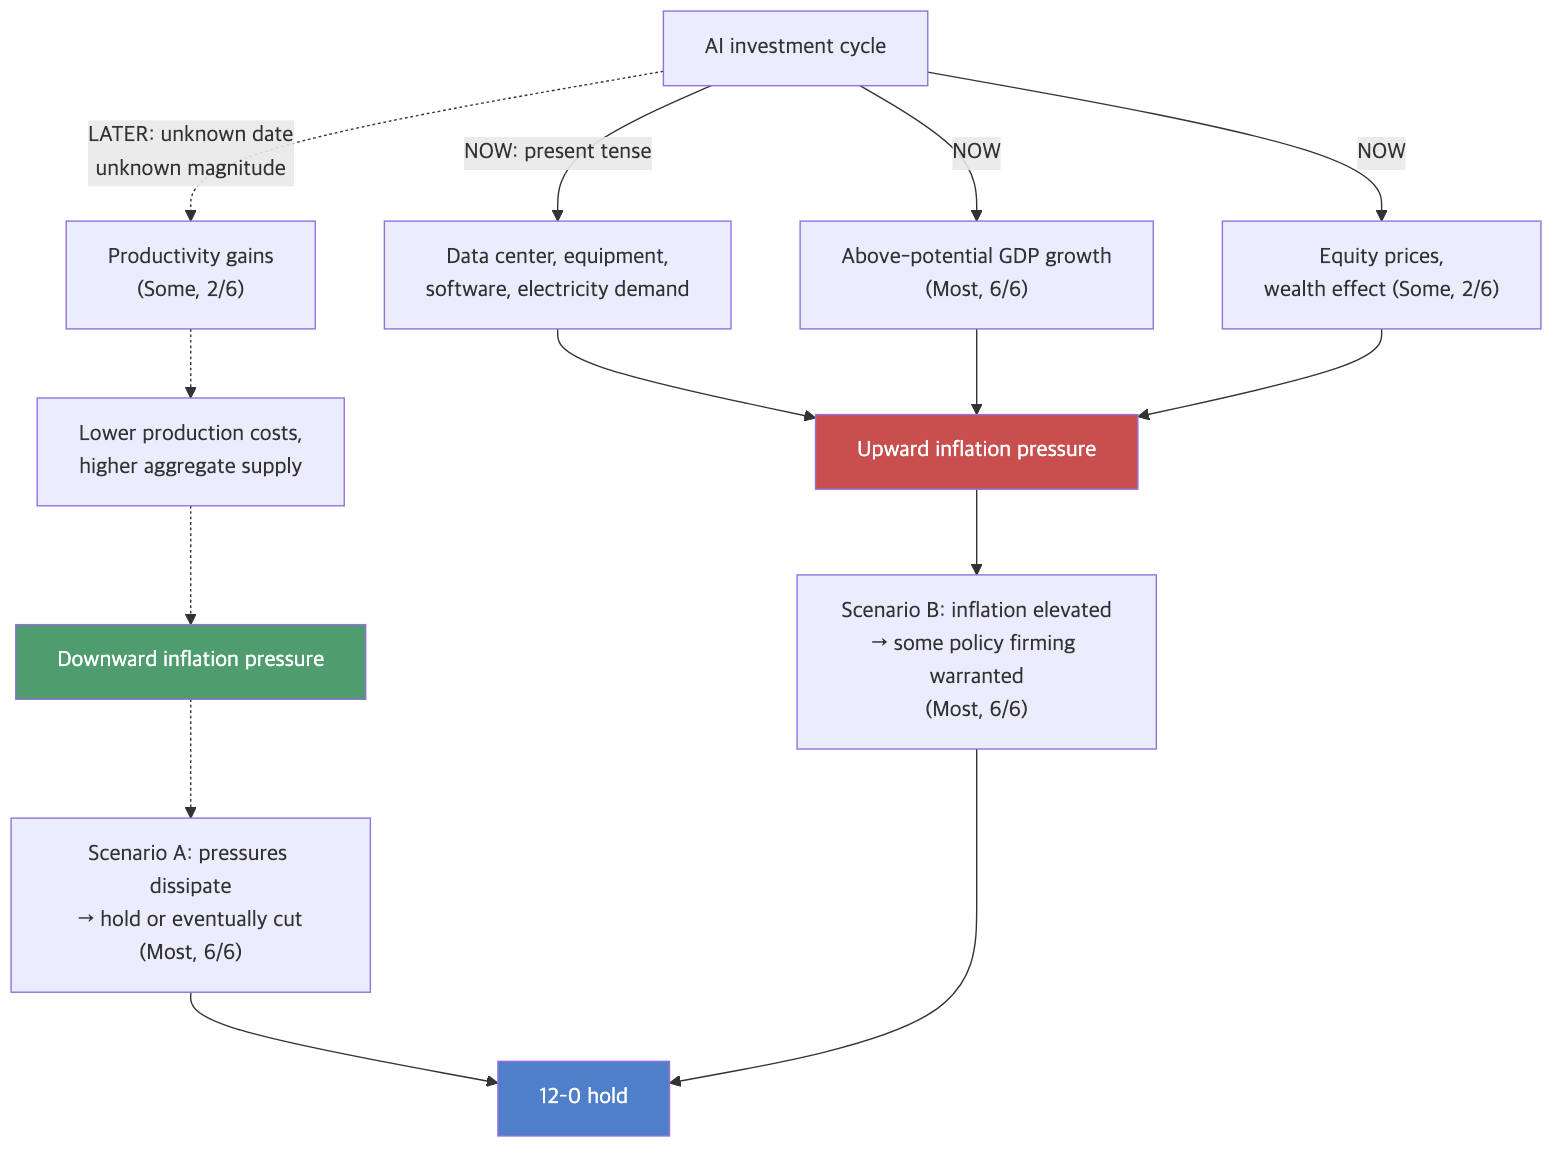
AI comes up more than any other cause in these minutes, and it is the only factor the Committee sees as pushing inflation both up and down at the same time.
2.1 The ways AI moves prices
Three ways it pushes prices up:
(a) It raises input costs directly. "Many participants noted that ongoing strong demand for AI infrastructure would likely sustain upward pressure on prices for technology products and electricity." The staff separately blamed part of the rise in core goods inflation on "AI-related price pressures," alongside tariffs.
(b) It makes the whole economy run hot. "Most participants remarked that growth in economic activity that exceeded that of potential output, owing in part to strong AI business investment, could contribute to more persistent inflationary pressures." This is the standard mechanism — an economy growing faster than it sustainably can pushes prices up — and it carries the strongest quantifier in the entire AI discussion.
(c) It lifts financial markets. "Some participants noted that broad financial conditions were supporting demand. These participants pointed specifically to high equity prices and noted that those prices had been driven by strong corporate earnings and optimism about AI." The S&P 500 rose nearly 6 percent over the period between meetings, led by tech. The minutes note that stock gains supported spending, "particularly among higher-income households."
(Potential, the only-available) One way it pushes prices down:
(d) Eventually, it lowers production costs. "Some participants remarked that productivity gains associated with AI adoption would eventually reduce production costs and increase aggregate supply, which should put downward pressure on inflation, though they noted this effect would likely take time to materialize."
2.2 Why the up-effects outweigh the down-effects
"Some participants suggested that those investments would likely increase the growth of productivity and of potential output in the coming years. These participants remarked, however, that considerable uncertainty remained regarding both the timing and magnitude of potential productivity gains, which were expected to lag the ongoing boost of AI adoption on demand."
Demand comes now; the offsetting supply comes later, in an unknown amount and on an unknown date. AI spending flows into the economy — data centers, equipment, software, electricity — years before the finished models cut any production costs.
The staff's forecast builds this in: real GDP grows at about its sustainable pace this year and slightly faster over the next two, "buttressed by persistently strong productivity growth, continued gains in AI-related capital spending, and supportive financial conditions."
An economy growing faster than it sustainably can is an inflationary economy, whatever is paying for it.
2.3 Participant tally on AI
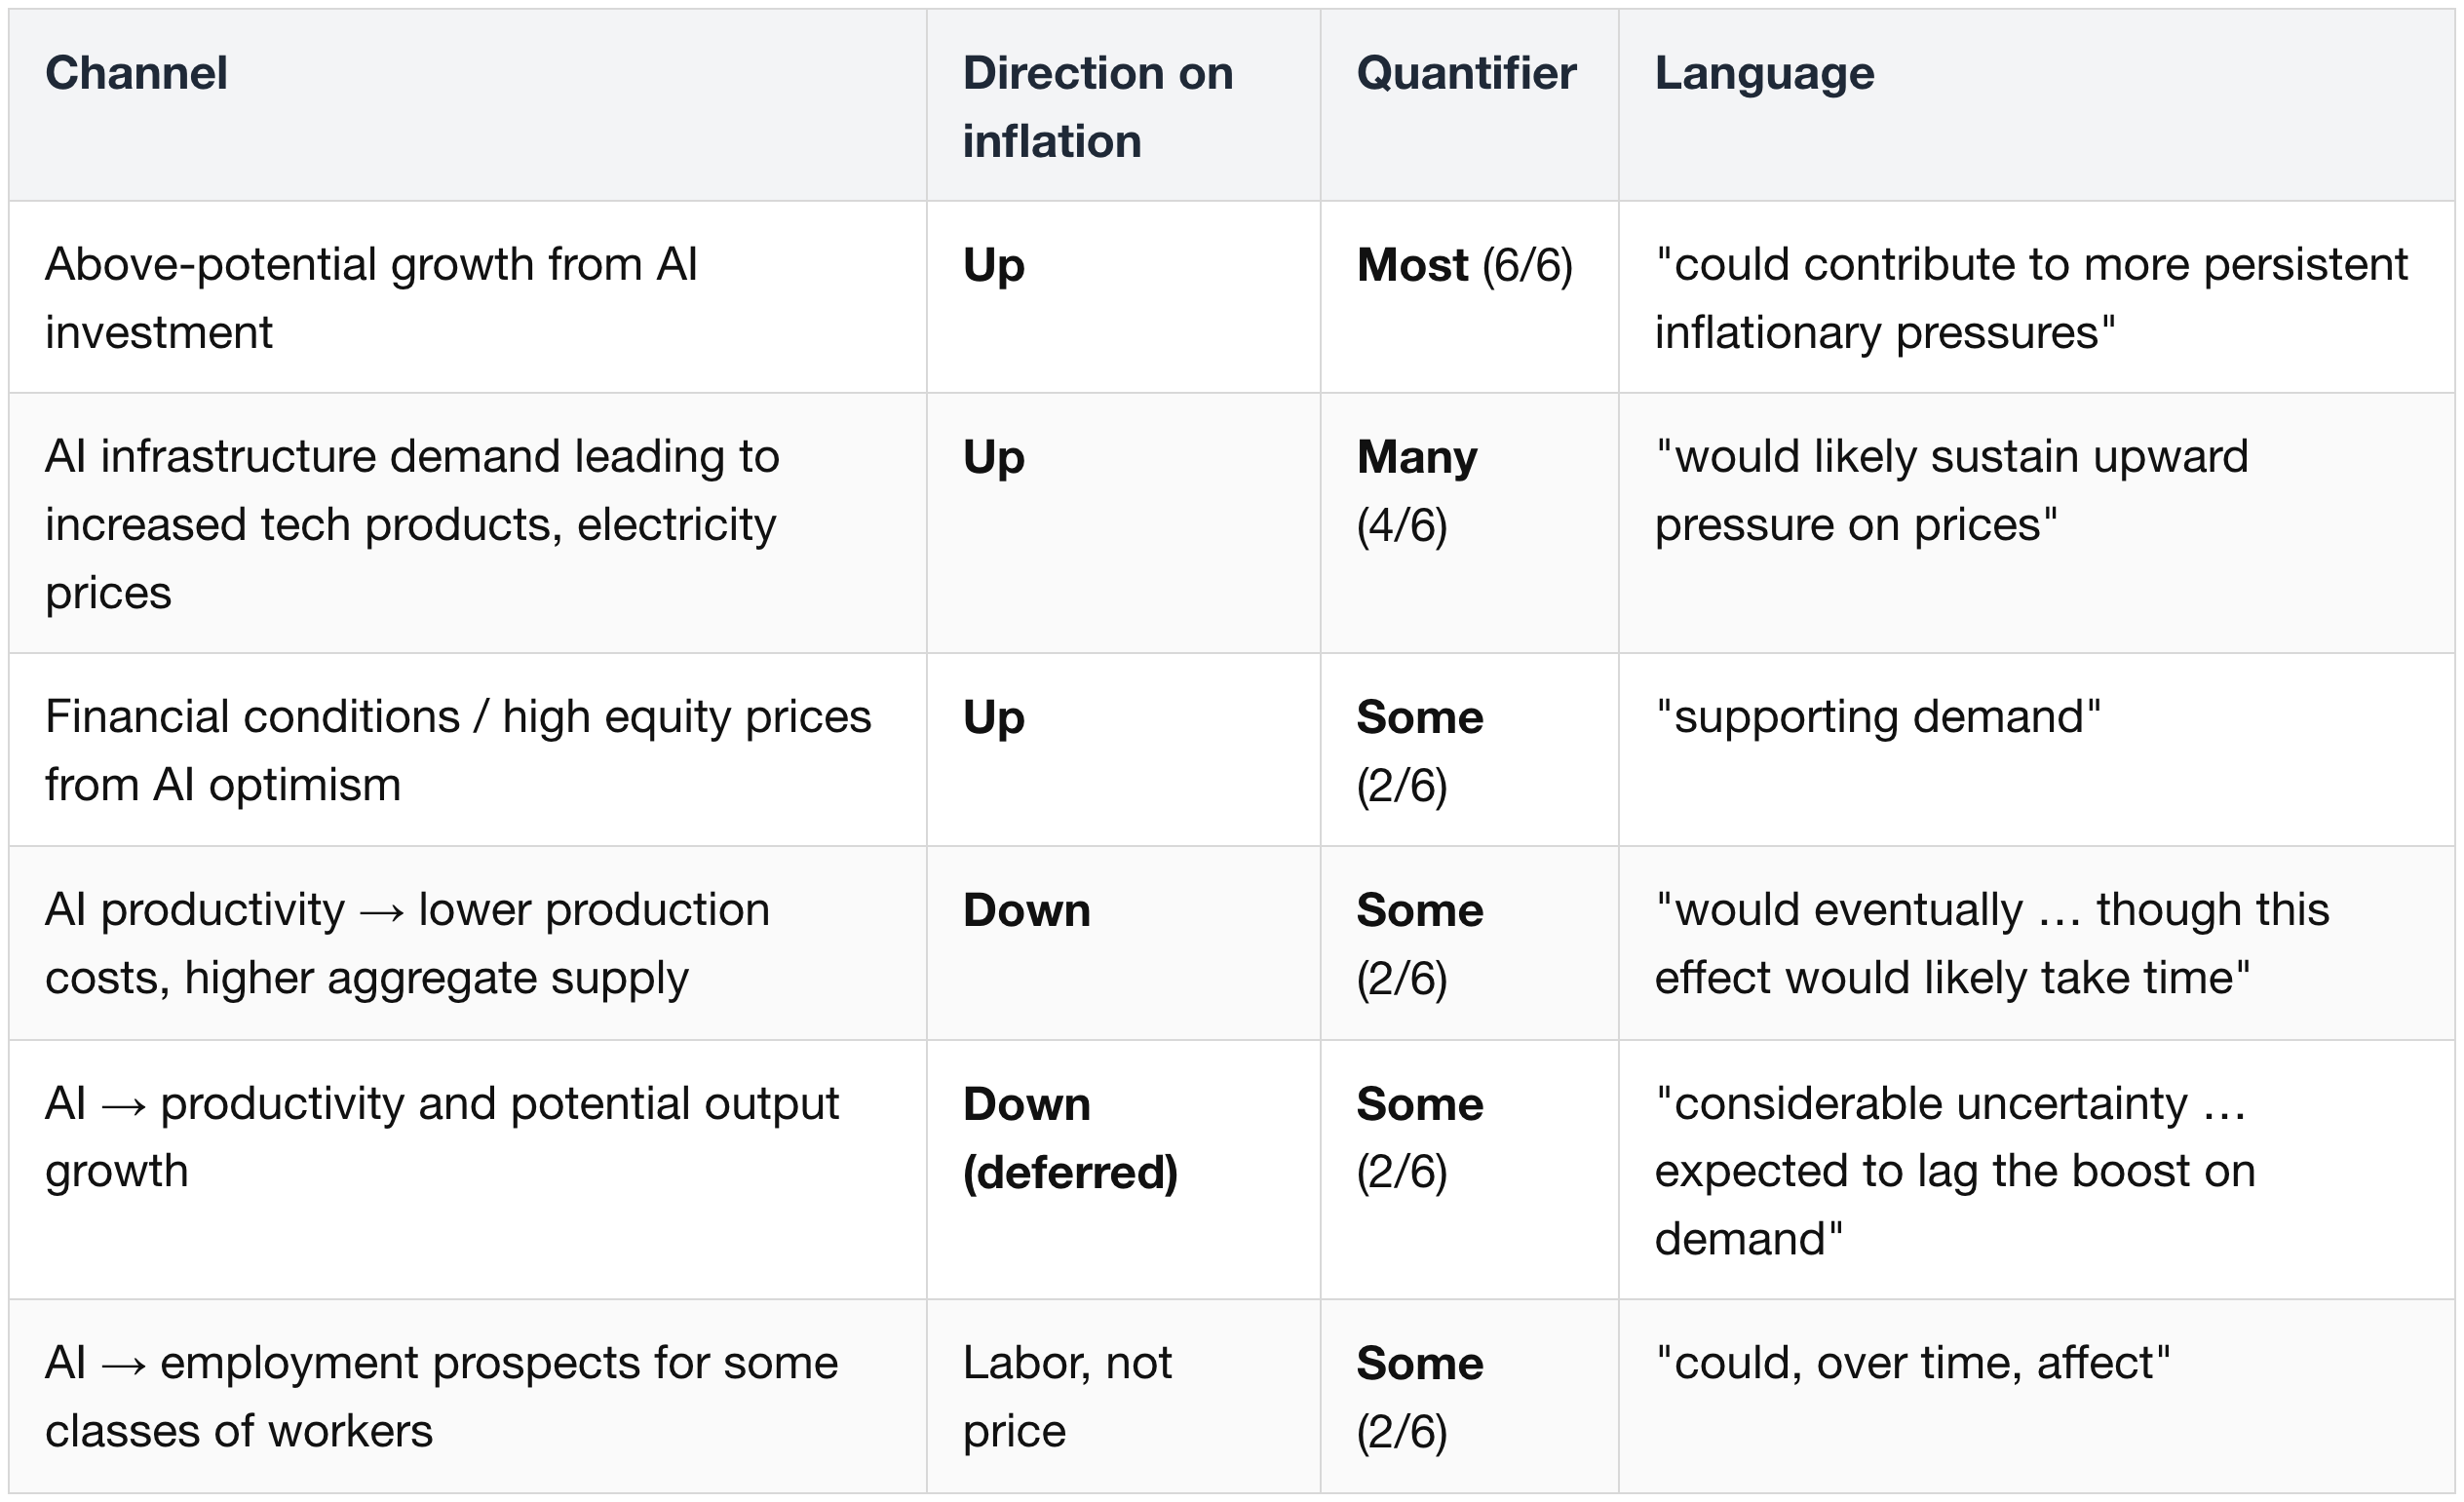
The distribution is lopsided.
- Every AI channel that presses inflation up is present-tense and carries a strong quantifier.
- Every AI channel that presses it down is future-tense, carries Some, and is hedged with a lag qualifier.
- This asymmetry — not the energy shock, not tariffs — is the substantive reason the hawkish weight moved.
2.4 Why AI splits the inflation outlook into two scenarios
- Most participants remarked on scenarios in which inflationary pressures would dissipate and inflation would soon begin to return to 2 percent. In such scenarios, almost all of these participants noted it would likely be appropriate to maintain or eventually lower the target range.
- Most participants, however, also pointed to scenarios in which, with stable labor market conditions, inflation would remain elevated due to strong AI-related demand, the Middle East conflict, or tariffs. In such scenarios, almost all of these participants indicated some policy firming would likely be warranted.
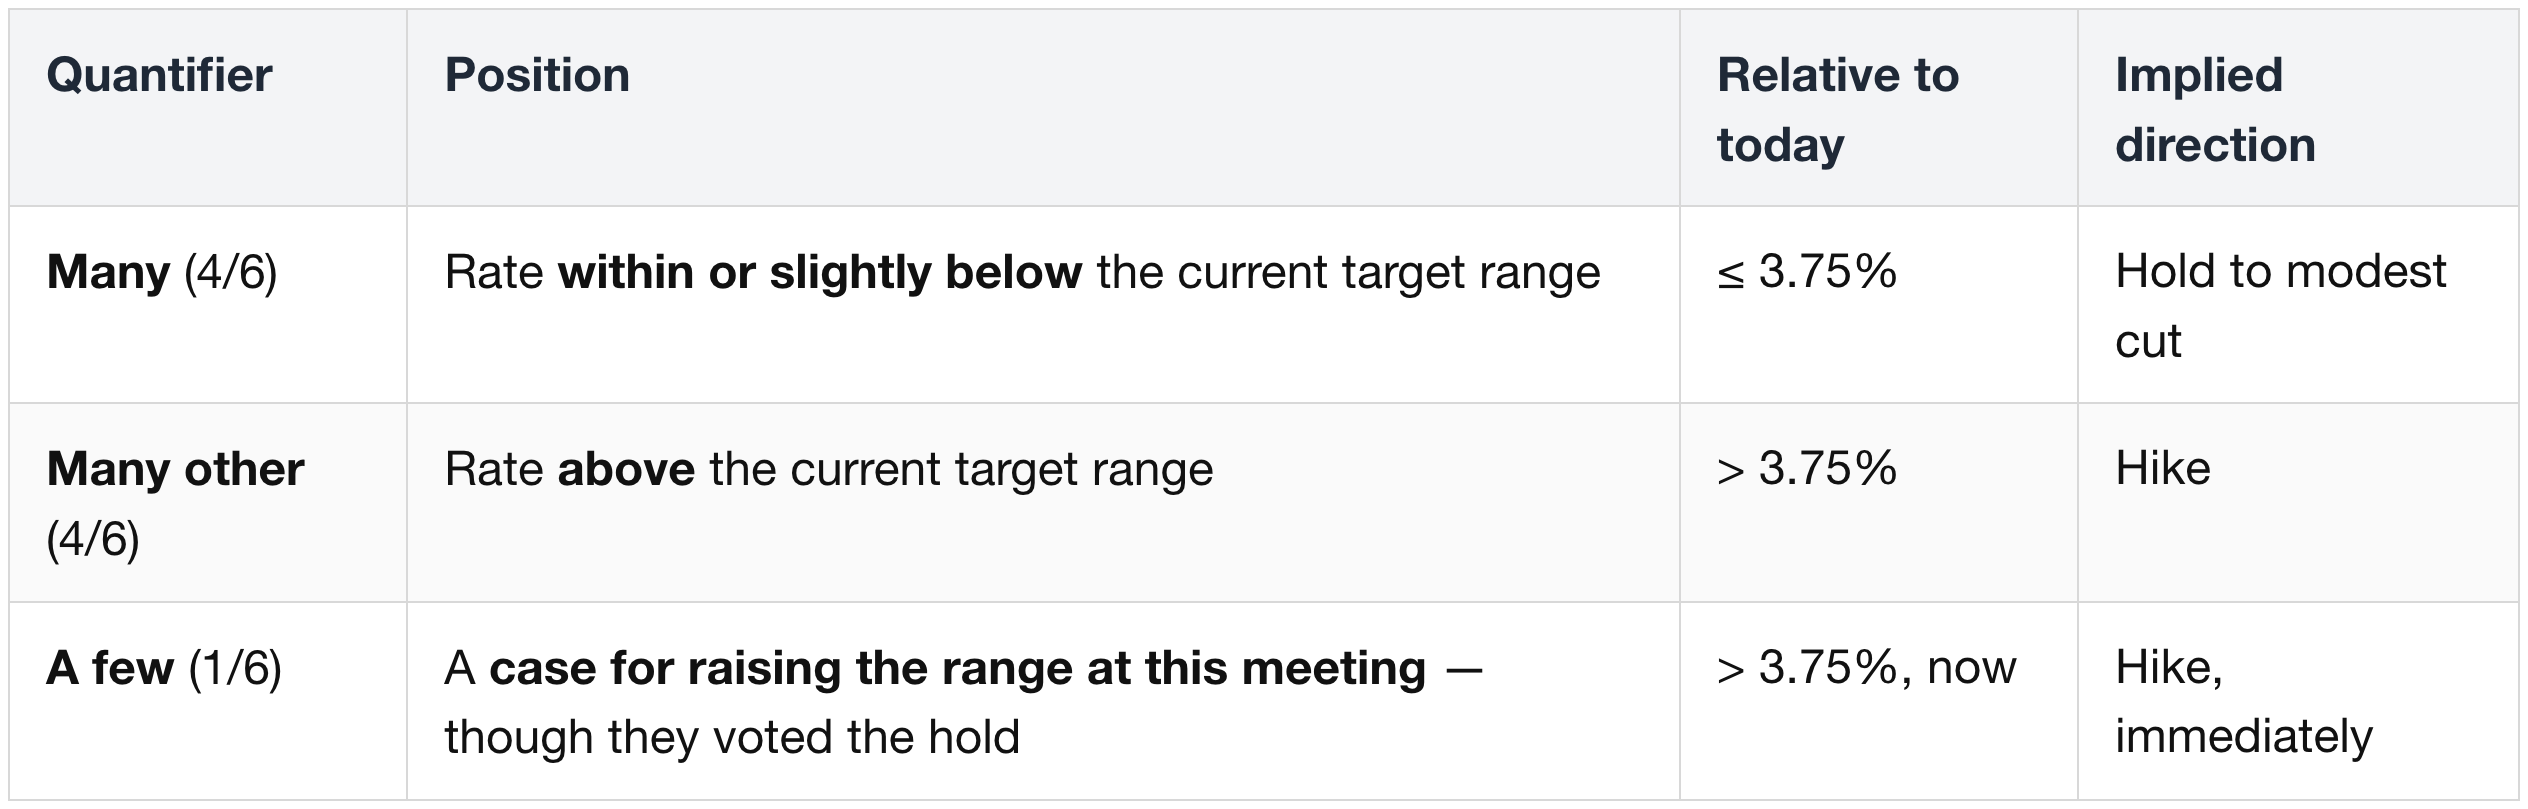
The same participants hold both branches. Where they split is on the point estimate — and on whether policy is even tight today.
Where rates should sit at end-2026 (current range: 3.50–3.75%)
Whether policy is restrictive today

Nobody, in either table, calls current policy meaningfully tight.
A 12–0 vote for maintaining the federal funds rate steady, sits on top of a committee that cannot agree on whether the next move is a hike or a cut, or even on whether current policy is tight at all.
3. The Labor Market as the Committee Saw It
3.1 The composite judgment
"Participants generally assessed that information received over the intermeeting period suggested that upside risks to price stability remained elevated while downside risks to achieving maximum employment had moderated a bit."
For several meetings the labor market had been the deciding factor of the fed funds rate. In June it moved to the background and inflation moved forward. Everything hawkish in this document rests on that one sentence.
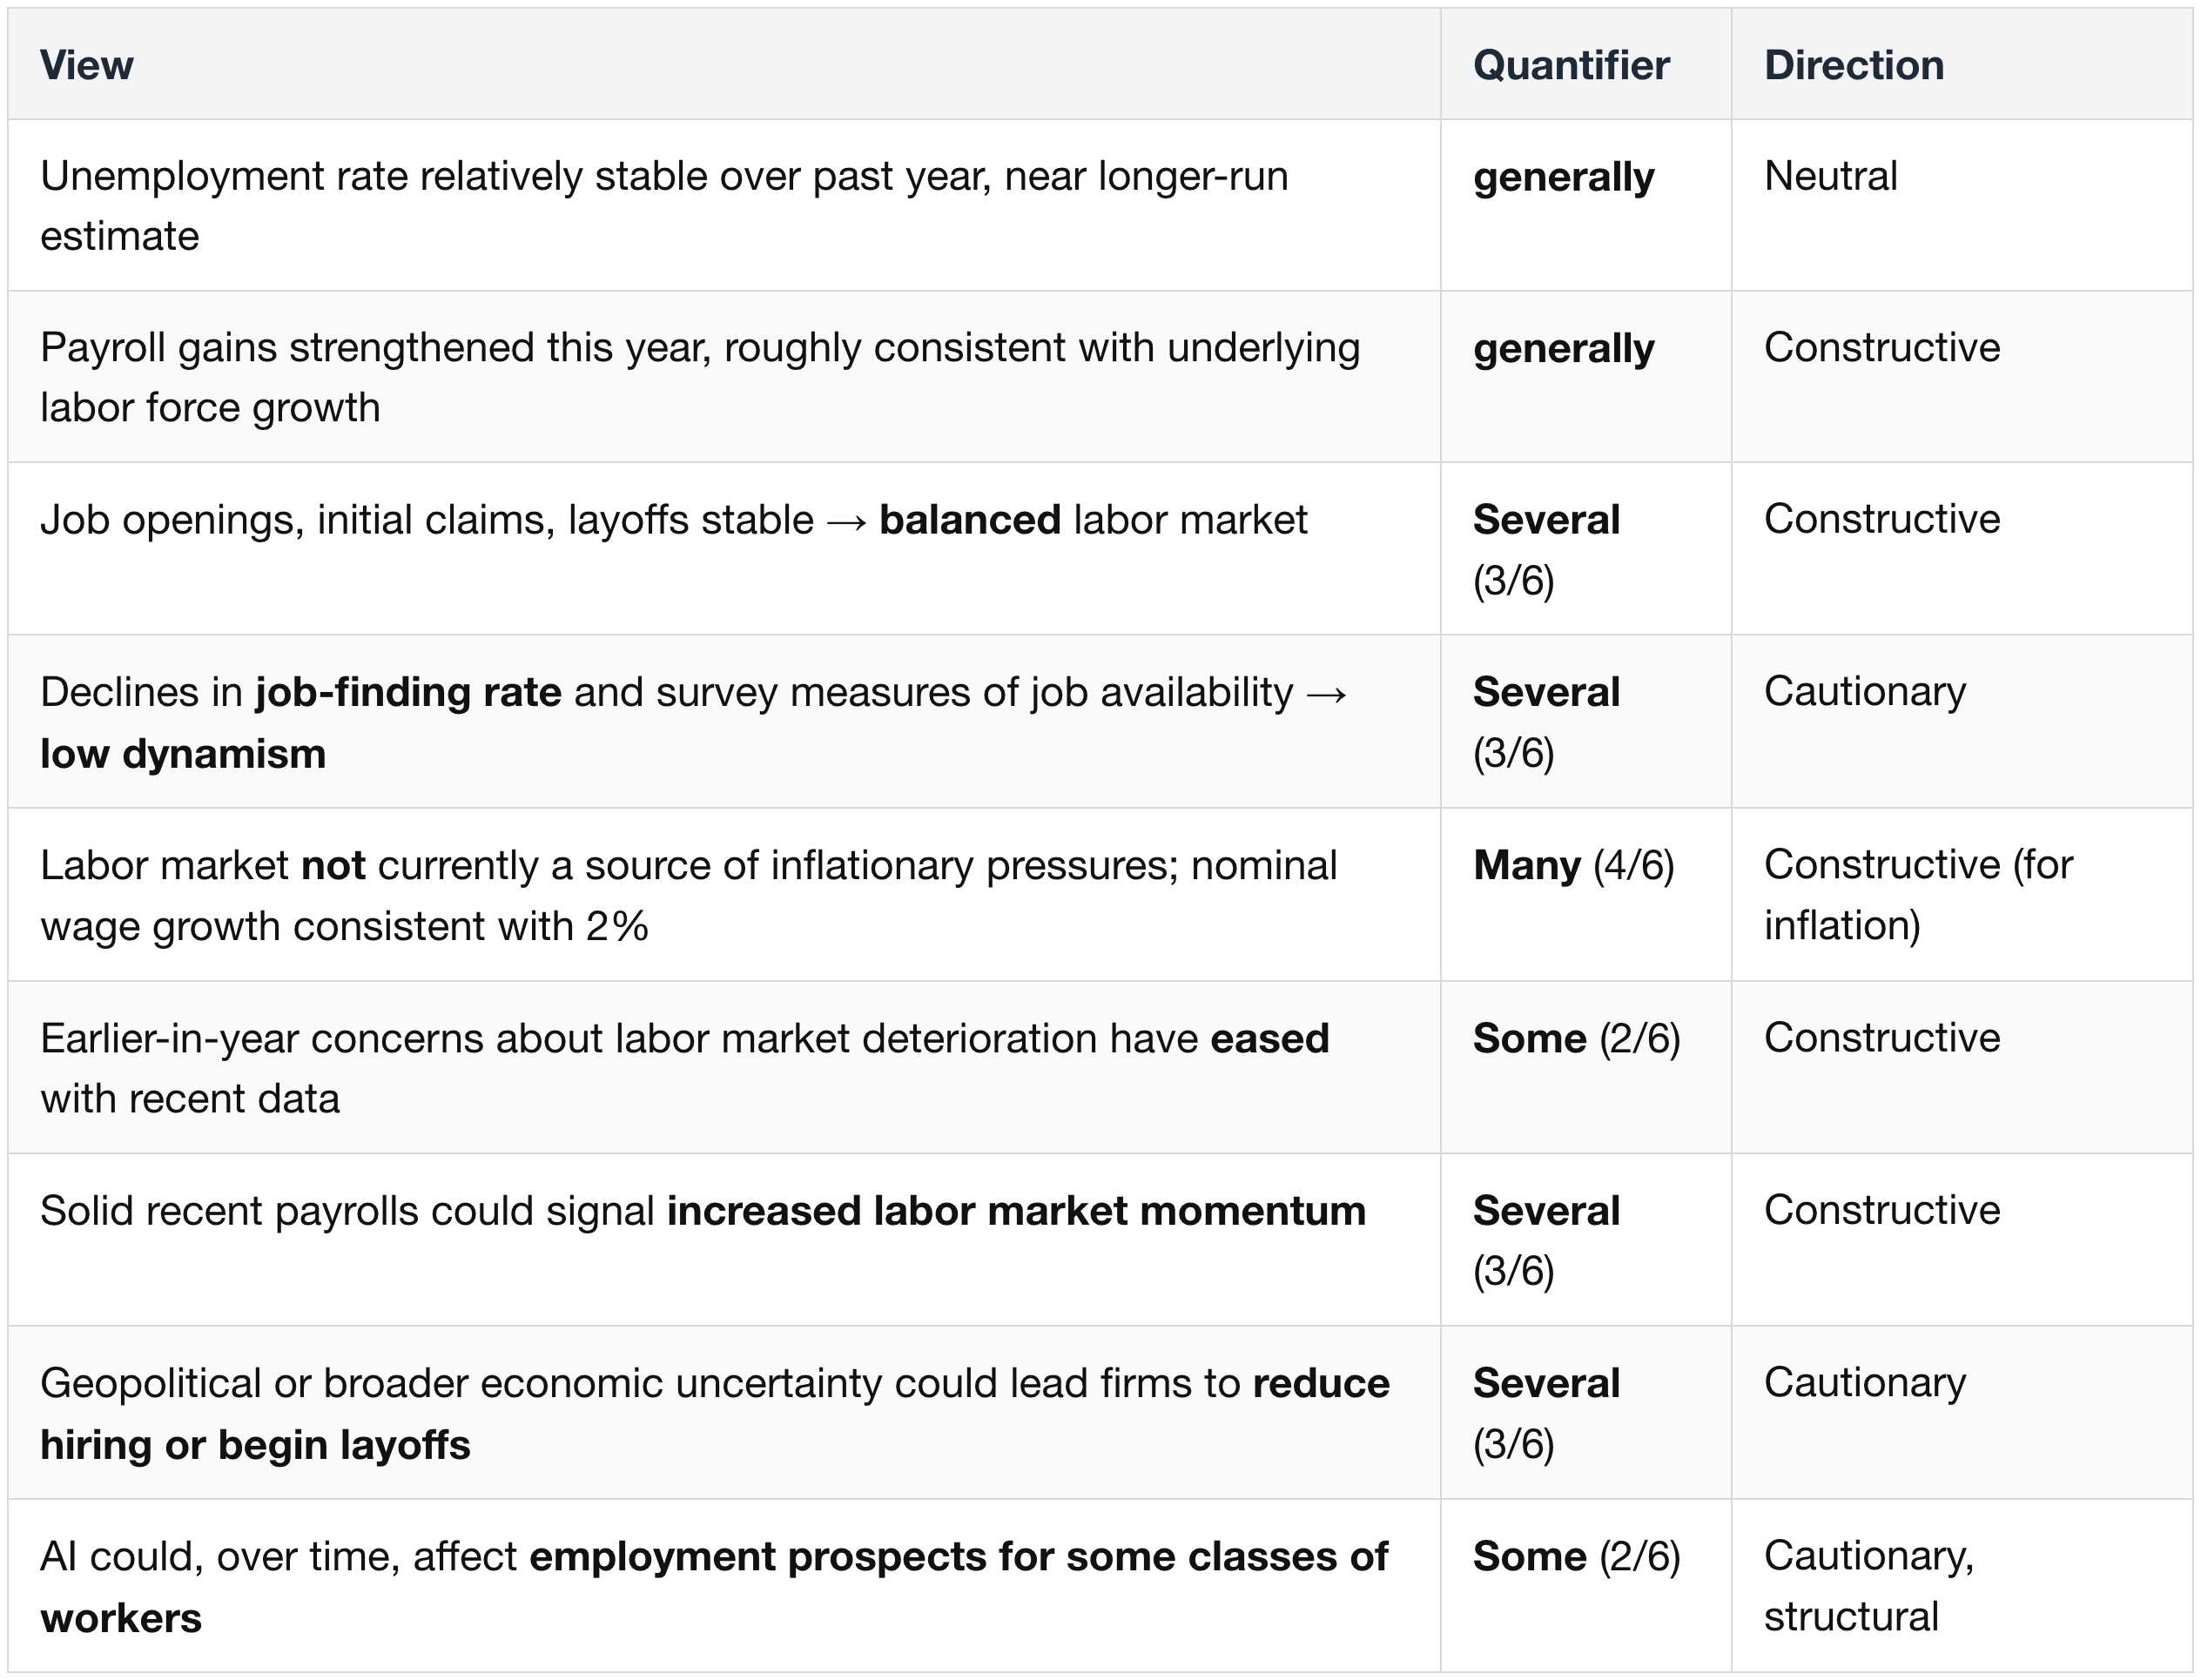
3.2 Participant tally on labor
3.3 What kind of "stable" this is
The Committee describes a low-churn labor market: not getting worse, but barely moving. The two cautionary items — it is getting harder to find a job, and surveys show fewer jobs available — describe a market where the total number of people employed holds steady only because both hiring and quitting have slowed to a trickle.
JOLTS (the government's monthly survey of job openings and turnover) confirms this. Against pre-pandemic (Jan 2019) baselines:
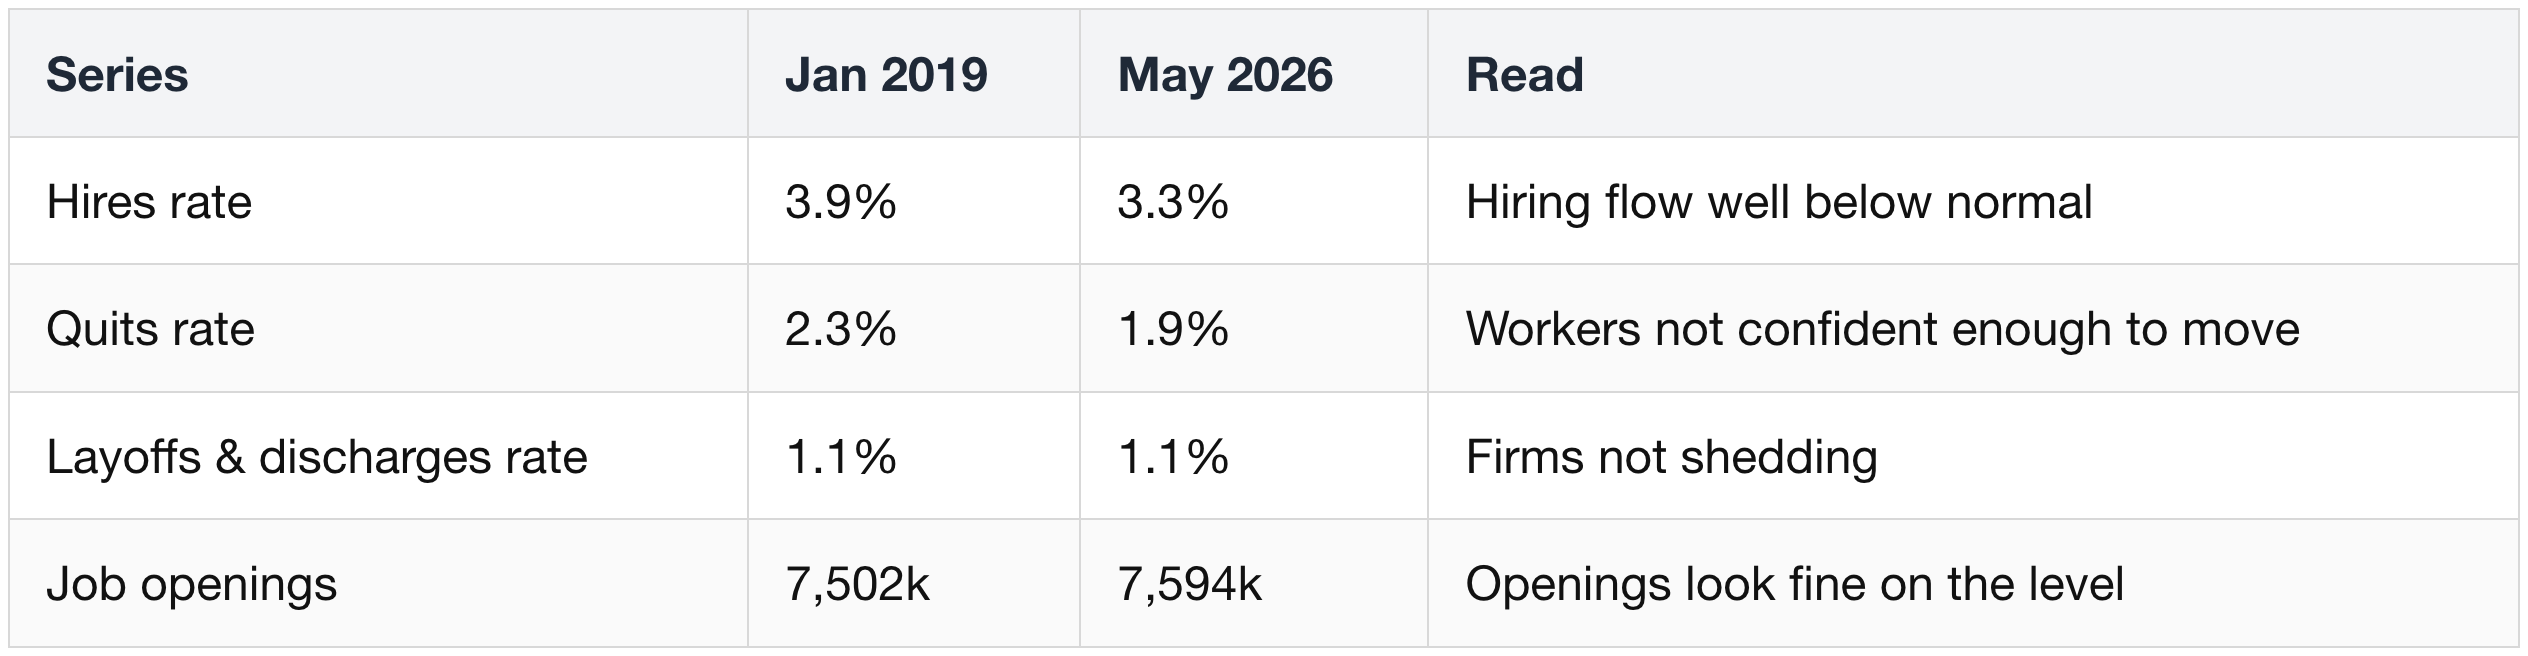
Openings at 7.59 million look healthy; hiring at 3.3 percent does not. That gap — plenty of jobs posted, but few actually filled — is what "low churn" means.
The people who pay for this are the ones already out of work. The long-term unemployed (out of work 27 weeks or more) numbered 1.937 million in June, 27.3 percent of all unemployed, up from 19.8 percent in Jan 2019 and up 286,000 over the year.
One timing point: the Committee formed this view on June 16–17. The June jobs report came out July 2 — sixteen days after the meeting ended, and six days before the minutes were published. Every positive labor-market sentence above was written before the data in Section 4 existed.
4. The June Employment Situation — What the Committee Did Not See
4.1 June headline
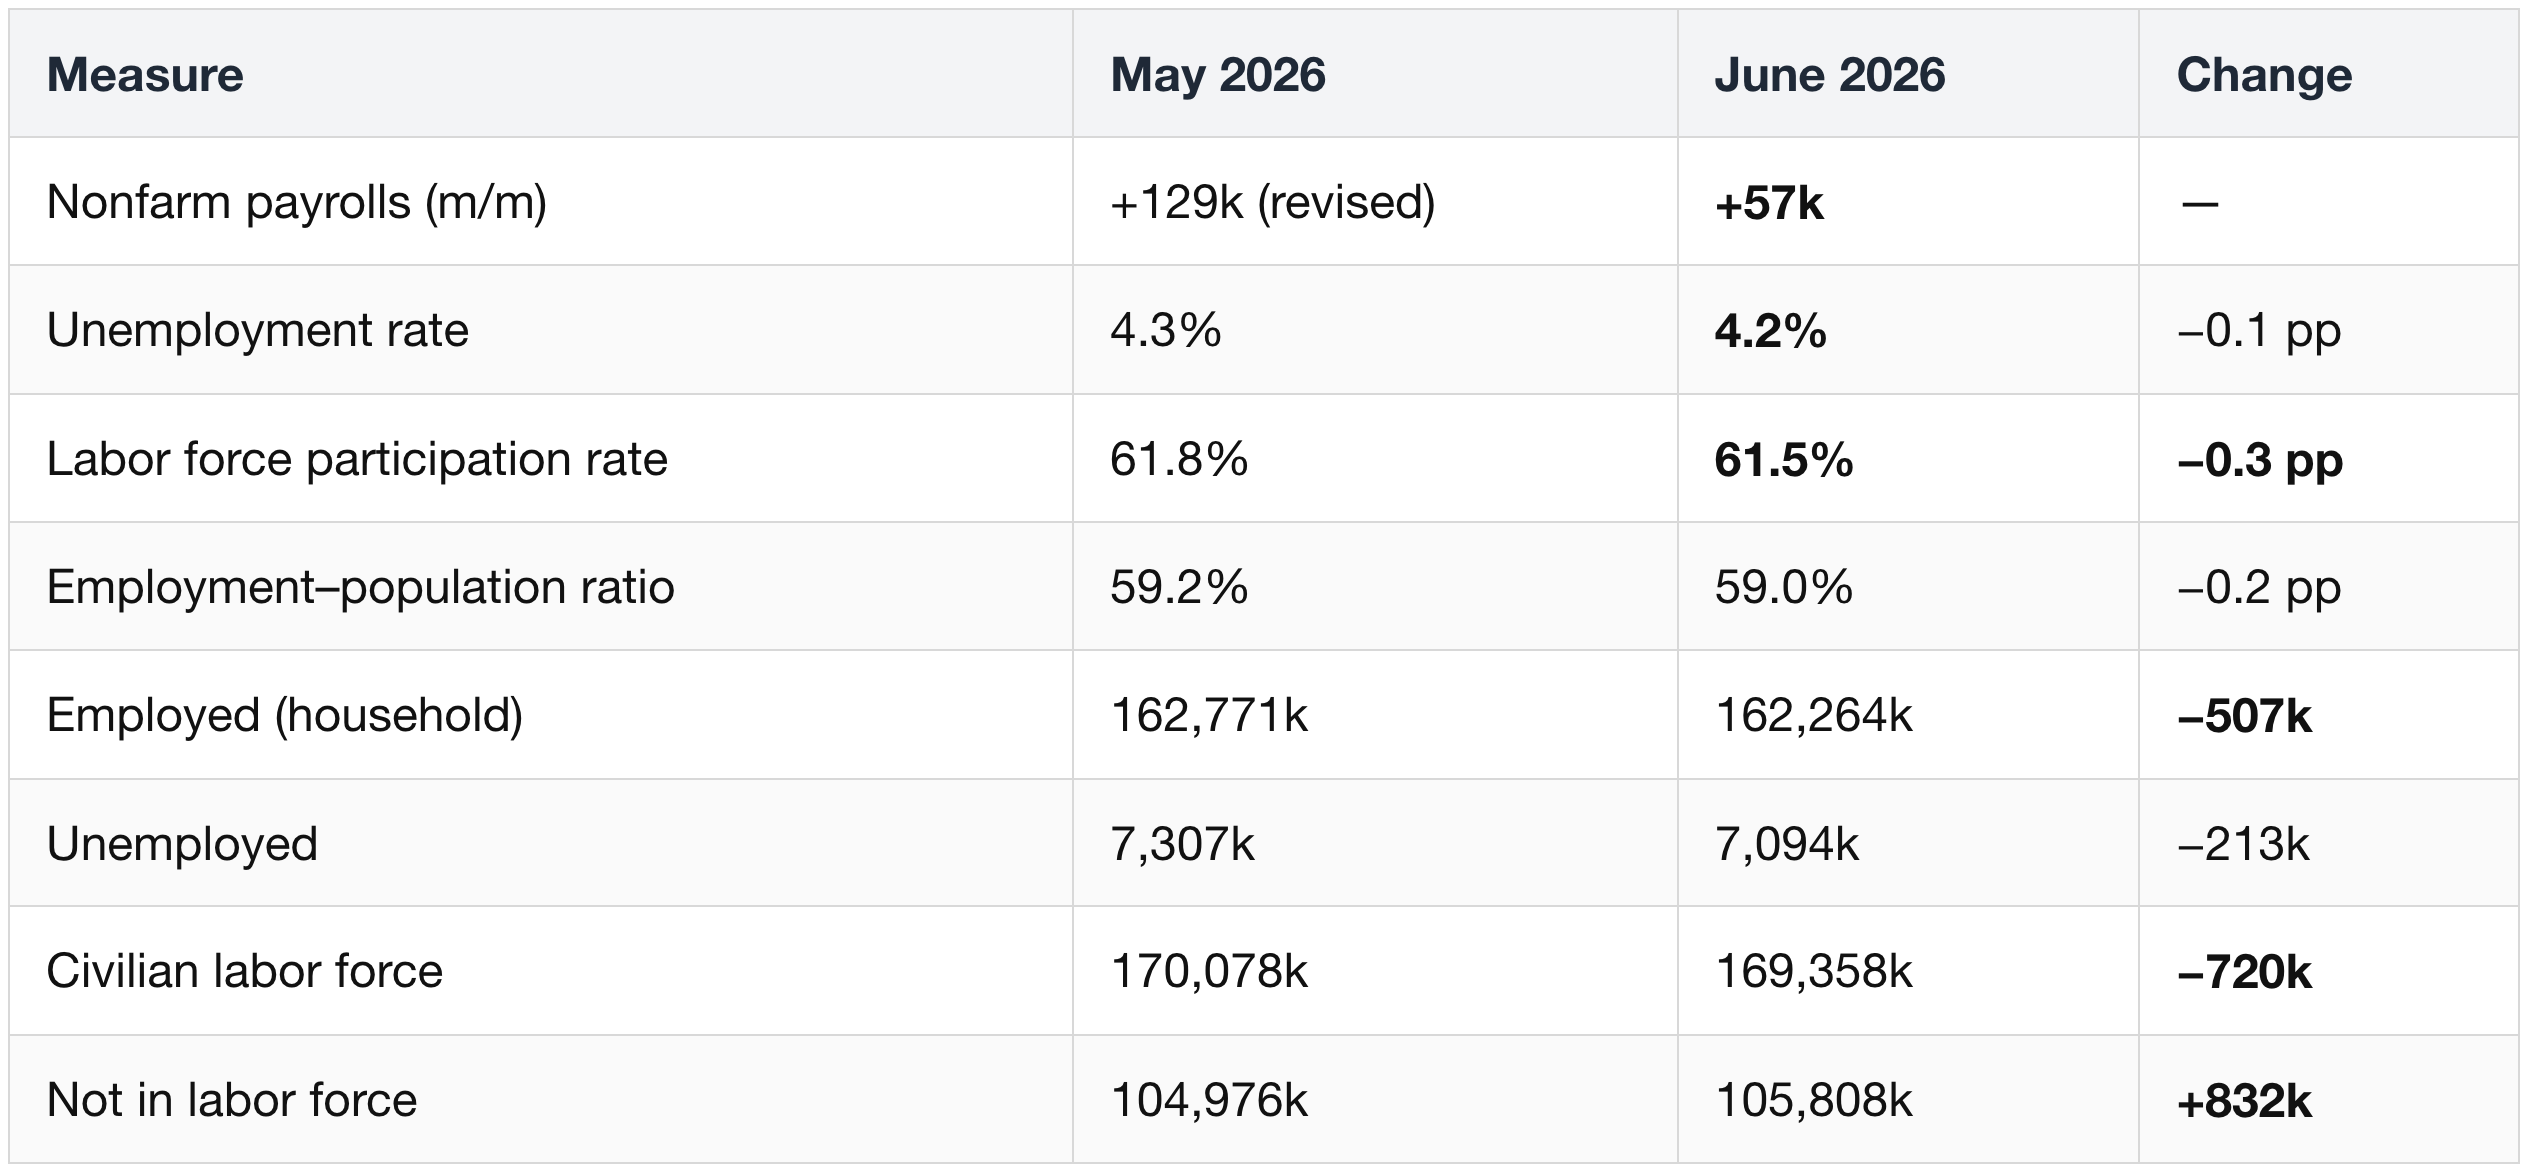
- Payrolls at +57k missed consensus badly (Reuters +110k, WSJ +115k), yet the release notes it was "roughly in line with the average monthly change over the prior 12 months (+36,000)."
- The 12-month average is +36k; the 3-month average is +111k. June is above the year's trend and well below the quarter's.
Industry detail:
- Leisure and hospitality −61k, attributed to "weaker than usual seasonal hiring." Thus far in 2026 the industry shows little net change.
- Professional and business services +36k, including temporary help services +9.3k — mildly constructive, since temp help usually turns first.
- Social assistance +25k; health care +22k, slower than its prior-12-month average of +38k.
- Retail trade −7.5k; information −9k.
- Diffusion index (1-month, 250 private industries) 54.4.
Strip leisure and hospitality and payrolls are +118k. That is the case for not over-reading the establishment survey.
- Average hourly earnings rose 0.3 percent m/m to $37.64, +3.5 percent y/y; the workweek held at 34.3 hours.
- Nothing in the wage data pressures inflation — consistent with the Many participants who judged the labor market is not currently a source of inflationary pressure.
4.2 The downward revisions
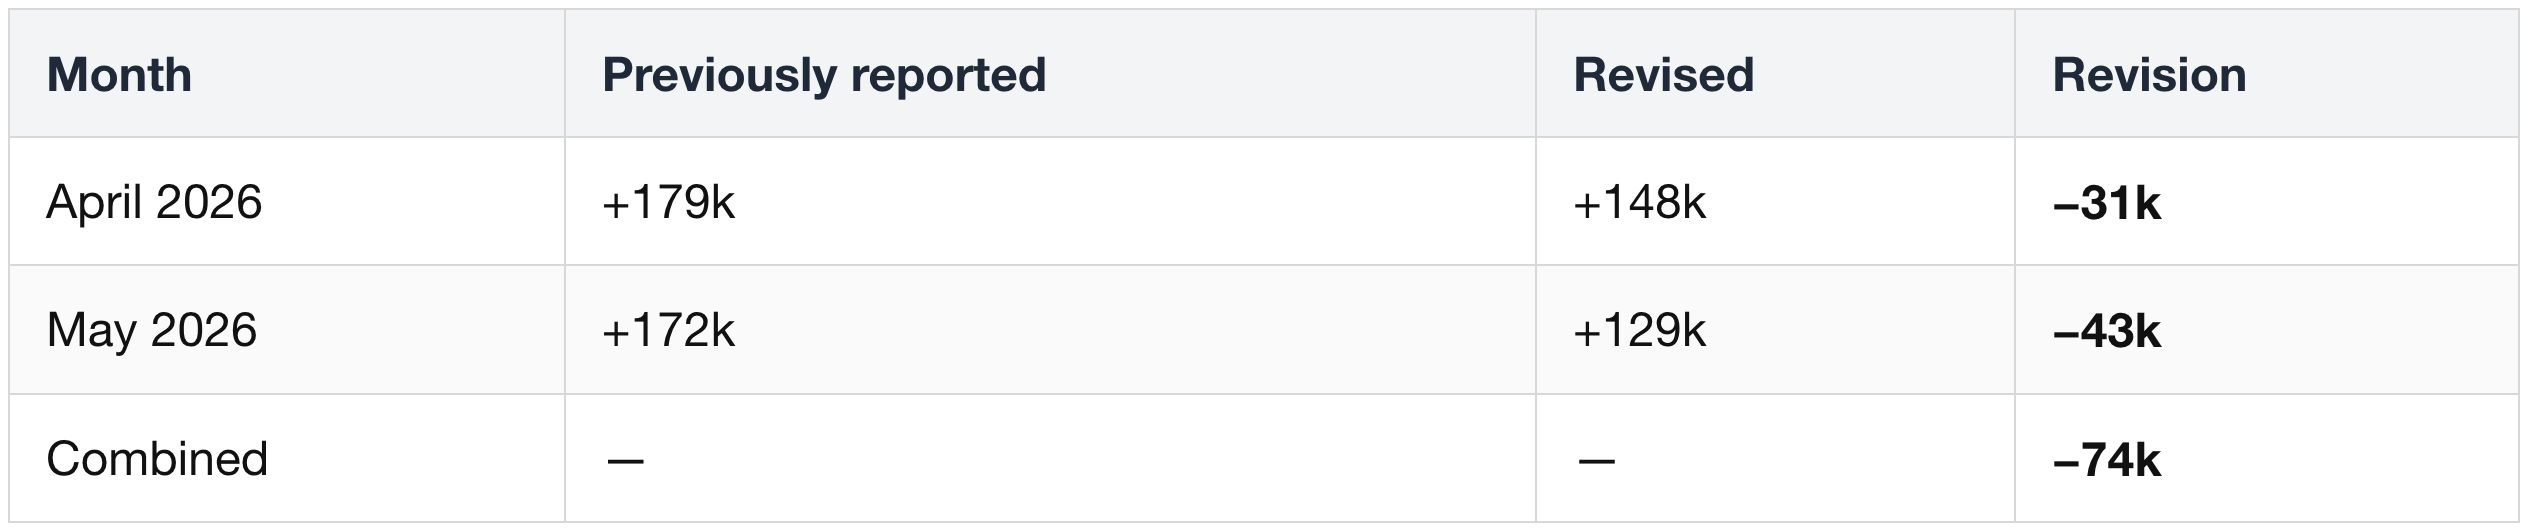
- The June 16–17 meeting most likely proceeded on April's +179k and May's +172k. The figures have since been revised to +148k (−31k) and +129k (−43k).
- The minutes' phrase — "payroll employment gains had strengthened this year" — may not have reflected the figures since revised down by a combined 74,000 jobs.
- Add June's +57k and the revised path reads +148k → +129k → +57k: a monotonic deceleration the Committee never saw.
4.3 Who left the workforce: not retirees, but 25-to-54-year-olds
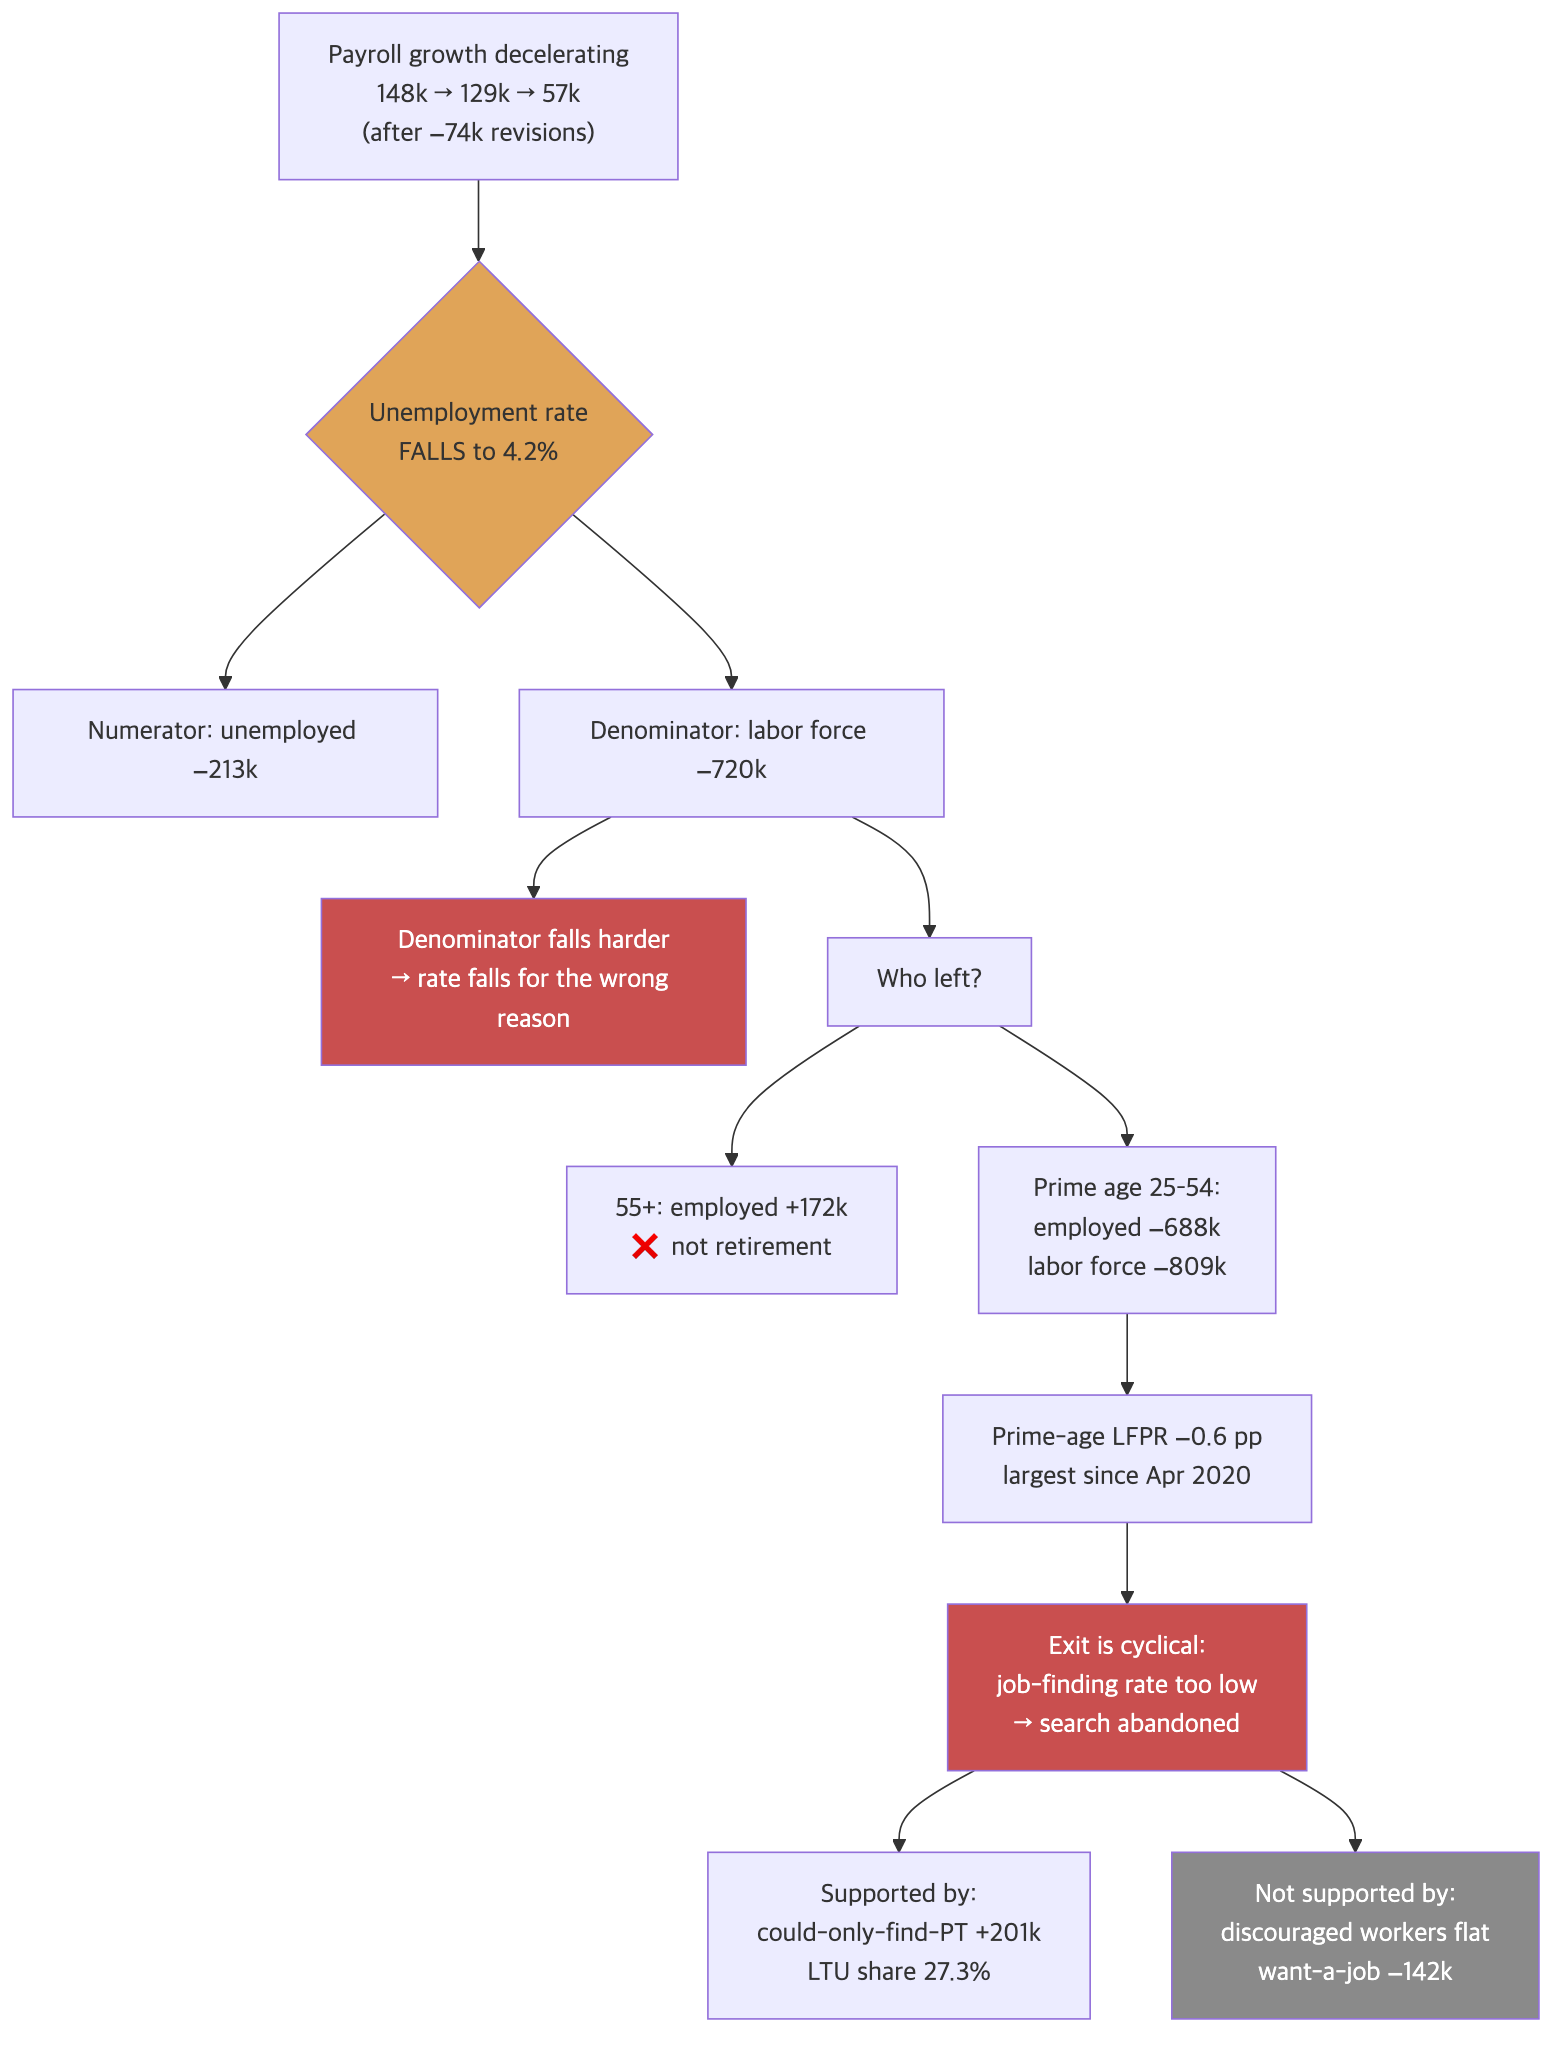
Job growth slowed sharply, and yet the unemployment rate fell to 4.2 percent. It fell for the wrong reason.
The formula. The unemployment rate is not "the share of all people who have no job." It is a ratio measured only among people in the labor force, and both parts of it move:

- Numerator — Unemployed. Jobless and actively searching in the last four weeks and available to work. Fail any of the three tests and you are not in the numerator.
- Denominator — Labor force. Employed + Unemployed. Anyone neither working nor searching is not in the labor force (NILF) and appears in neither term.
That last point is the catch.
- A worker who loses a job and keeps looking moves from Employed to Unemployed.
- The denominator does not change, the numerator rises, and
urises. - A worker who loses a job and stops looking leaves both — the numerator falls, the denominator falls, and
ucan fall even as employment collapses.
What the June numbers put in each slot (16+, seasonally adjusted, thousands):
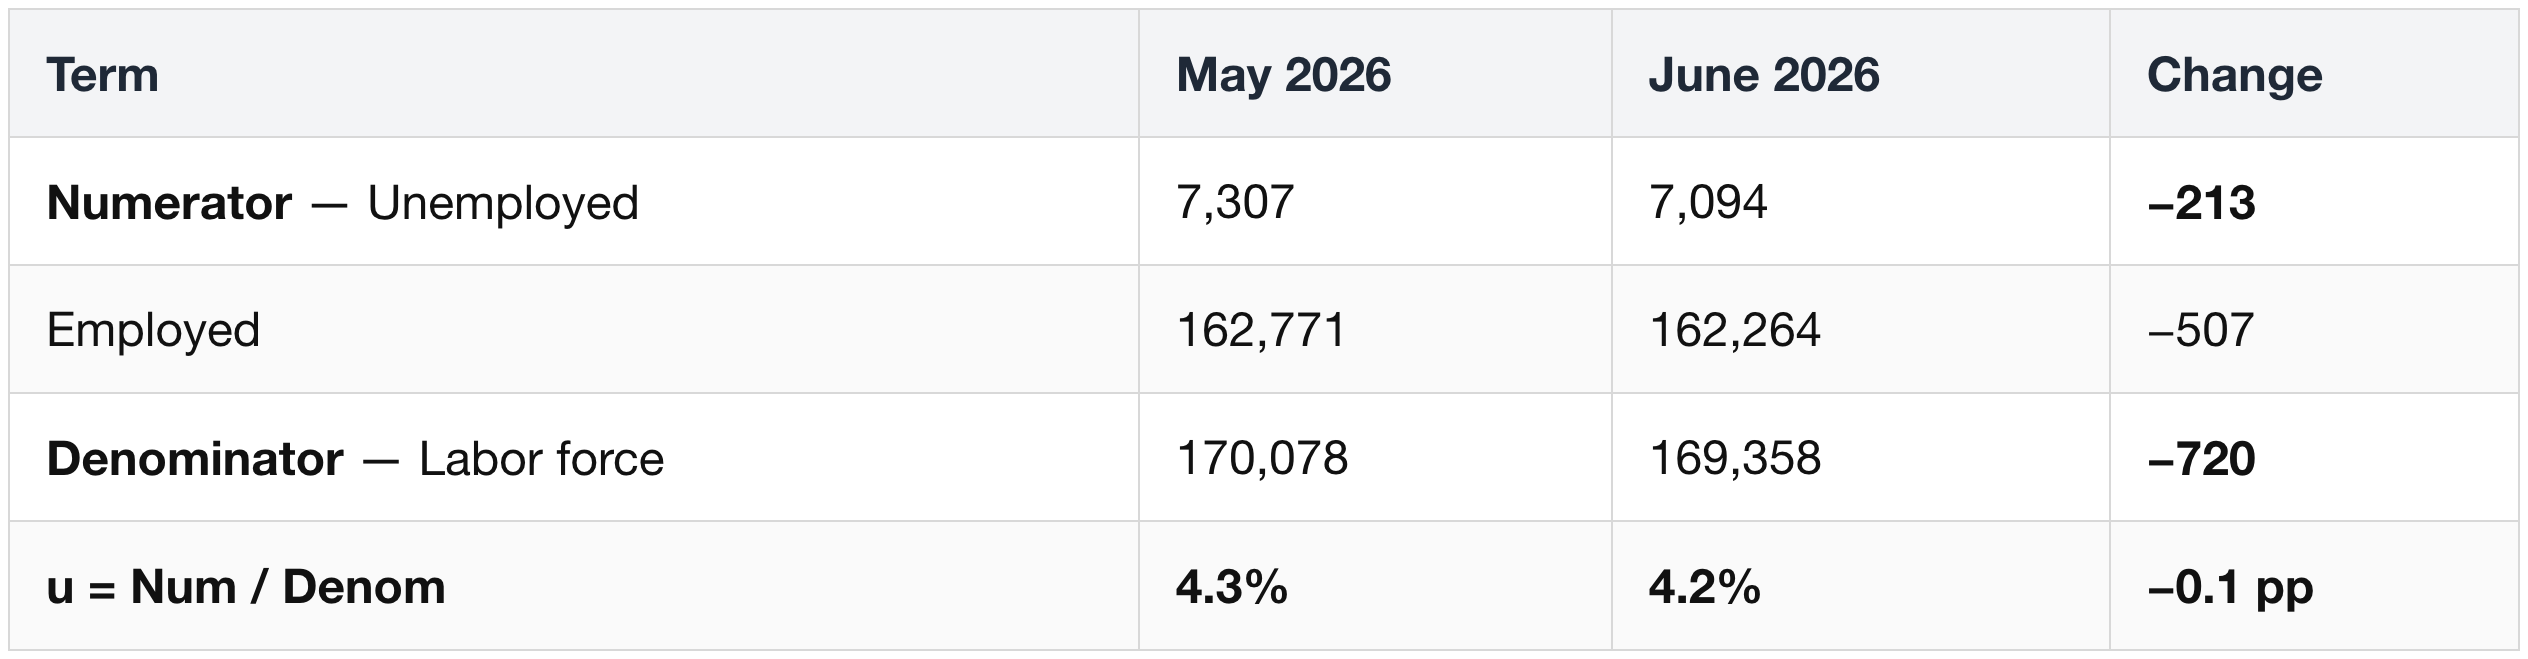
- The numerator fell 213k. The denominator fell 720k — more than three times as fast.
- A shrinking number over a faster-shrinking number gives a smaller quotient. That is the entire move.
- In net terms, employment and unemployment both fell while NILF rose by 832k. These stock data do not show that all 507k moved directly into NILF, but they do show why the rate fell: both its numerator and denominator shrank.
- Where the 720k comes from:

The counterfactual. Hold the labor force at its May level of 170,078k and recompute with June's actual employment:

Had nobody exited the labor force, the June unemployment rate would print 4.6 percent, not 4.2 — a 0.3 pp rise from May rather than a 0.1 pp fall. The reported improvement is an artifact of the denominator. Nothing improved.
The question is who left. If it were people 55 and over, this would just be an aging population leaving — a slow, long-run trend with no bearing on interest-rate policy. It is not that.
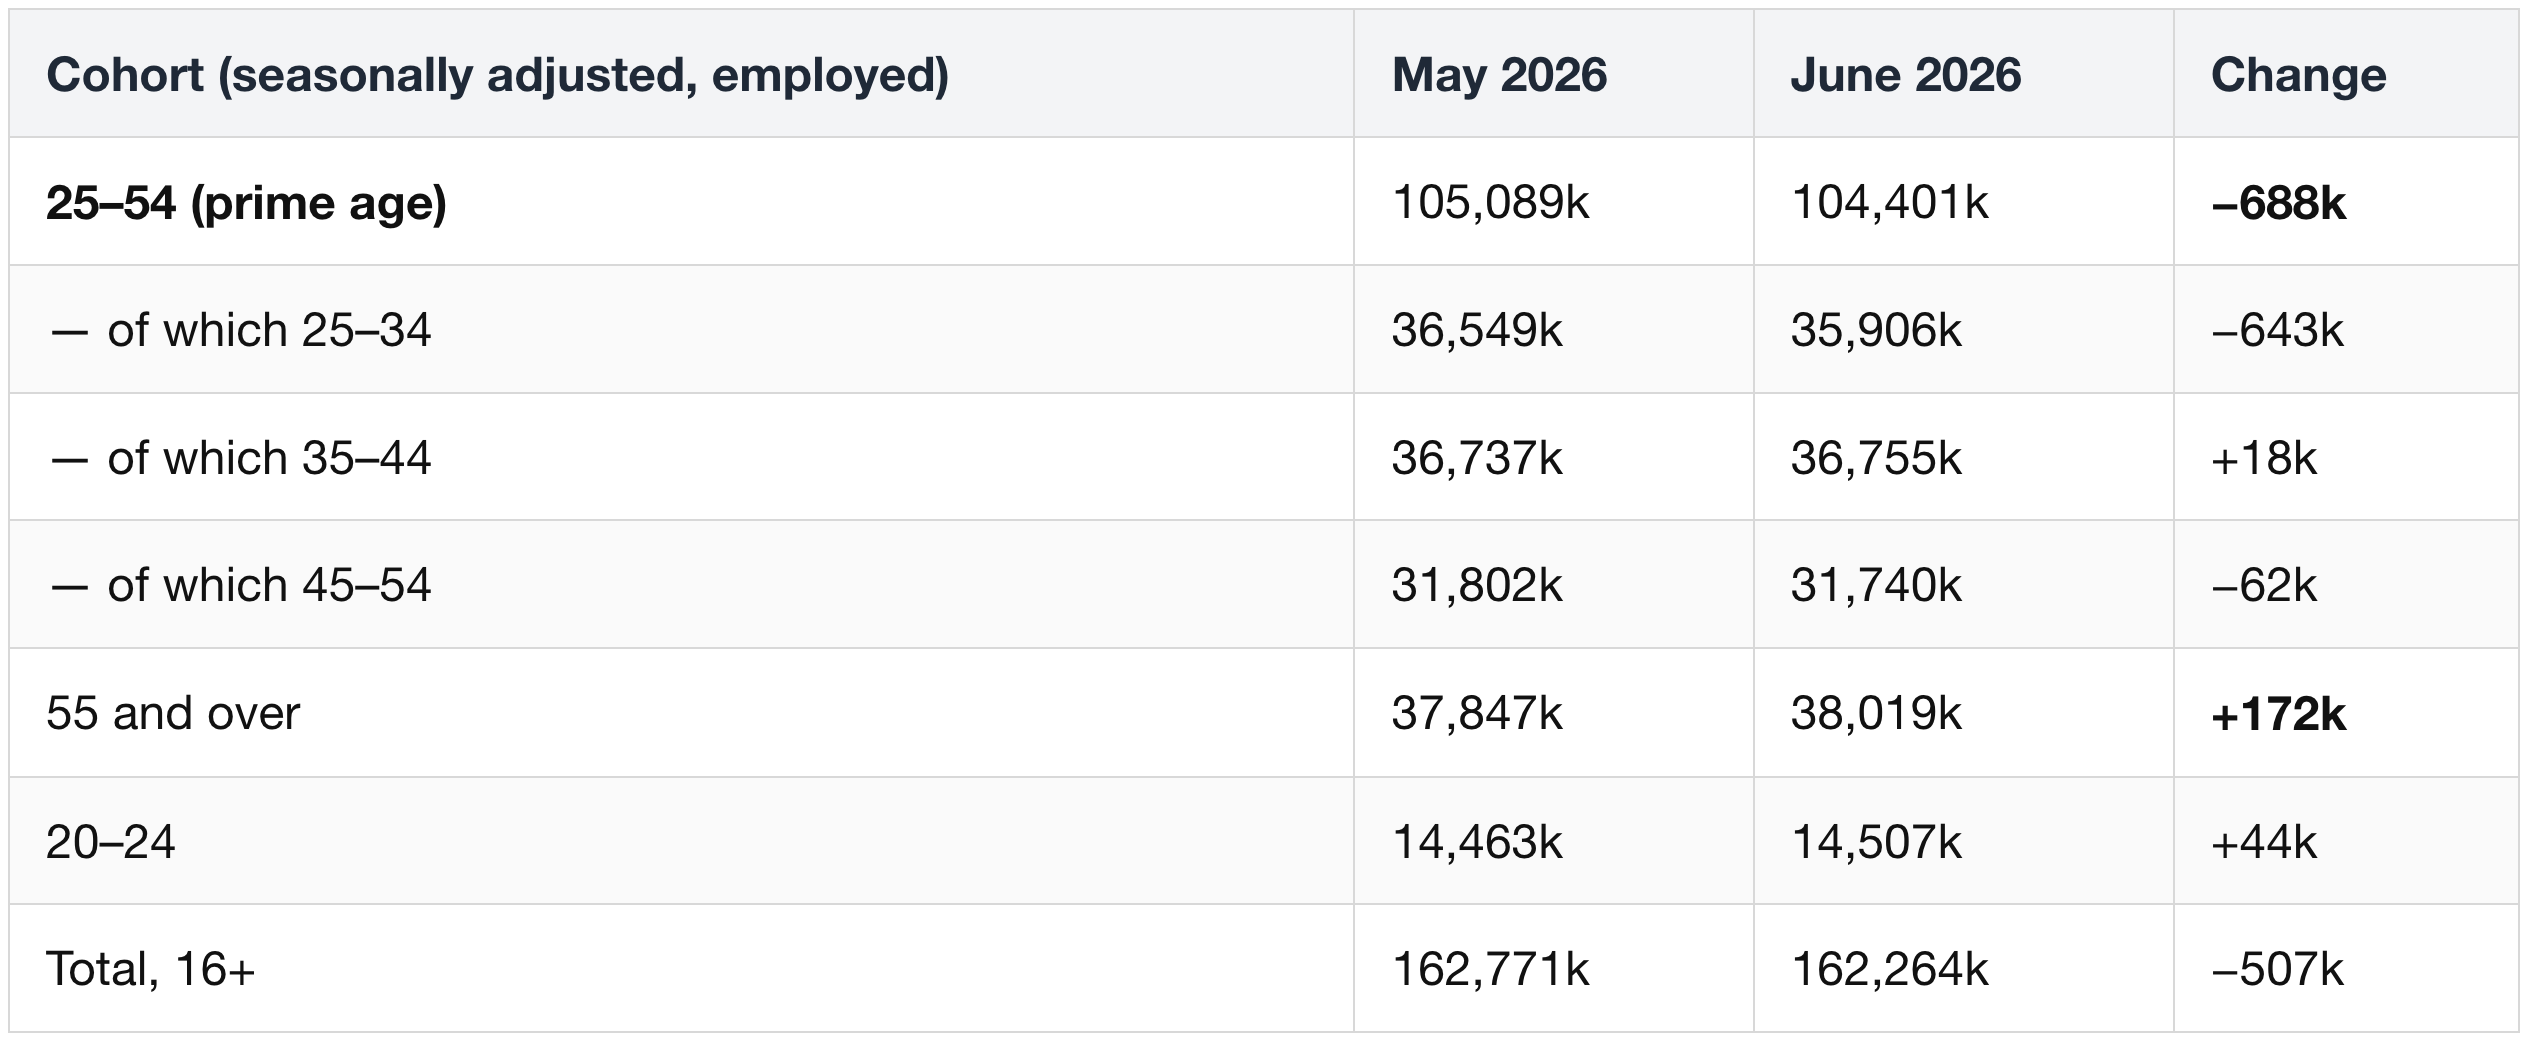
- Prime-age employment fell −688k against a total employment decline of −507k.
- The prime-age drop exceeds the entire drop in total employment.
- The 55-plus cohort added +172k, partially masking it. Retirement was running the other way.
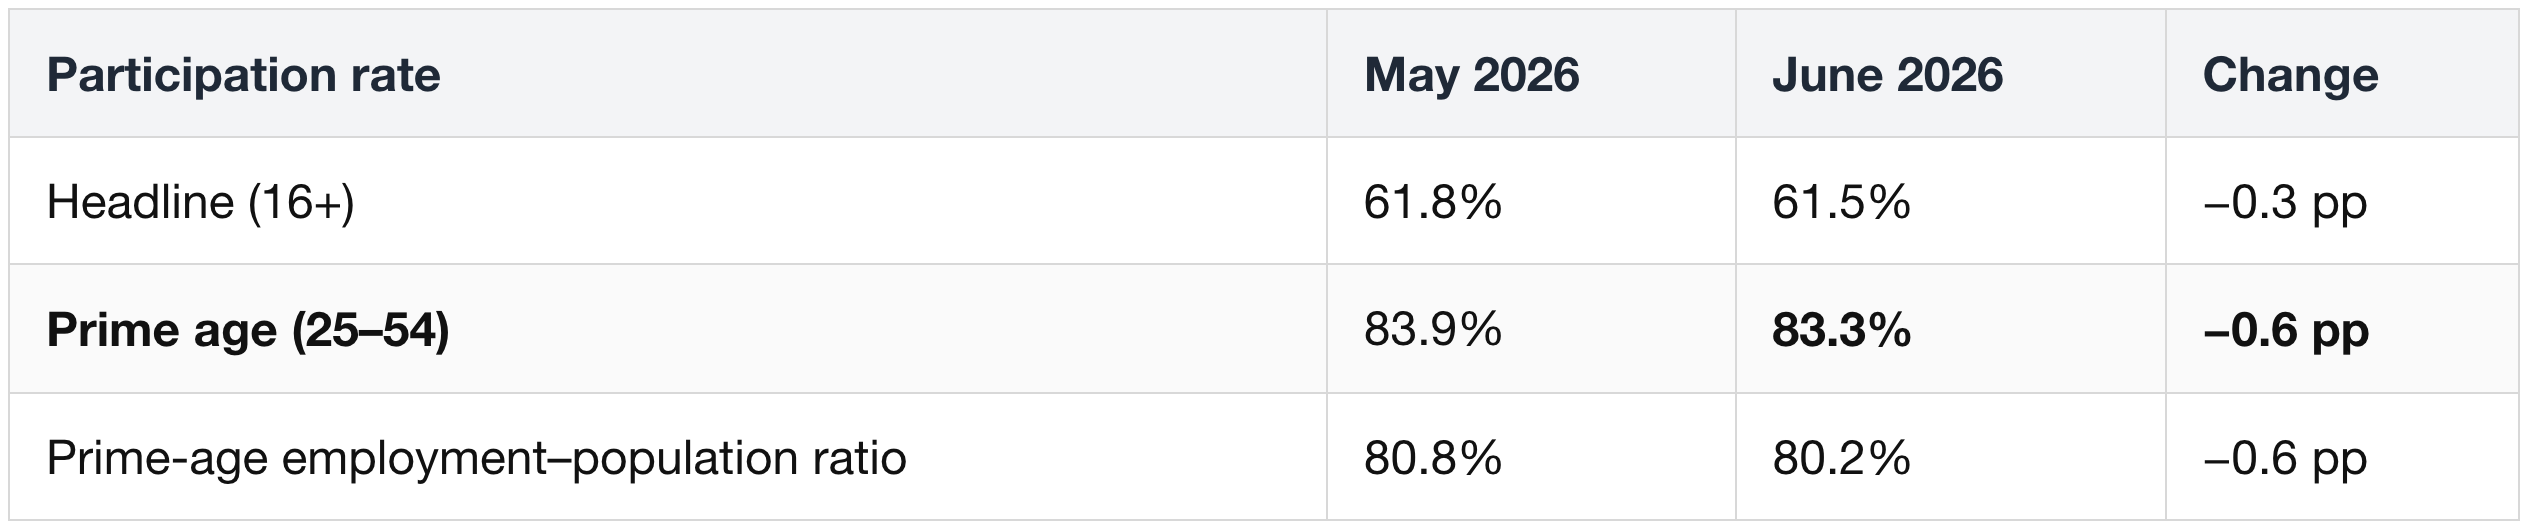
- The prime-age participation drop is double the headline drop.
- Checking the full history: the only other month since 2015 with a prime-age participation decline of 0.6 pp or worse is April 2020. Every other month in the last eleven years moved by 0.3 pp or less.
Prime-age decomposition:
- Prime-age employed: −688k
- Prime-age unemployed: 4,112k → 3,991k = −121k
- Prime-age labor force: −809k
Prime-age workers left employment and left the unemployment count. They moved out of the labor force entirely — which is why the prime-age unemployment rate went down (3.8% → 3.7%) while 688,000 prime-age workers stopped working.
What it means.
- A 25-to-54-year-old who leaves the workforce is not retiring, and for the most part is not choosing to stop working by preference.
- The most sensible reading is that the job went away and the search for a new one failed — people gave up because the economy was weak, not by choice.
- This is exactly what the Committee's own "declining job-finding rate" point predicts: when the odds of finding work drop far enough, people stop looking, and once they stop looking they disappear from the unemployment rate.
Two corroborating series in the same release:
- People working part time because they could only find part-time work: 1,208k → 1,409k (+201k).
- Long-term unemployed at 27.3 percent of the unemployed, up 286k over the year.
4.4 Counter-evidence
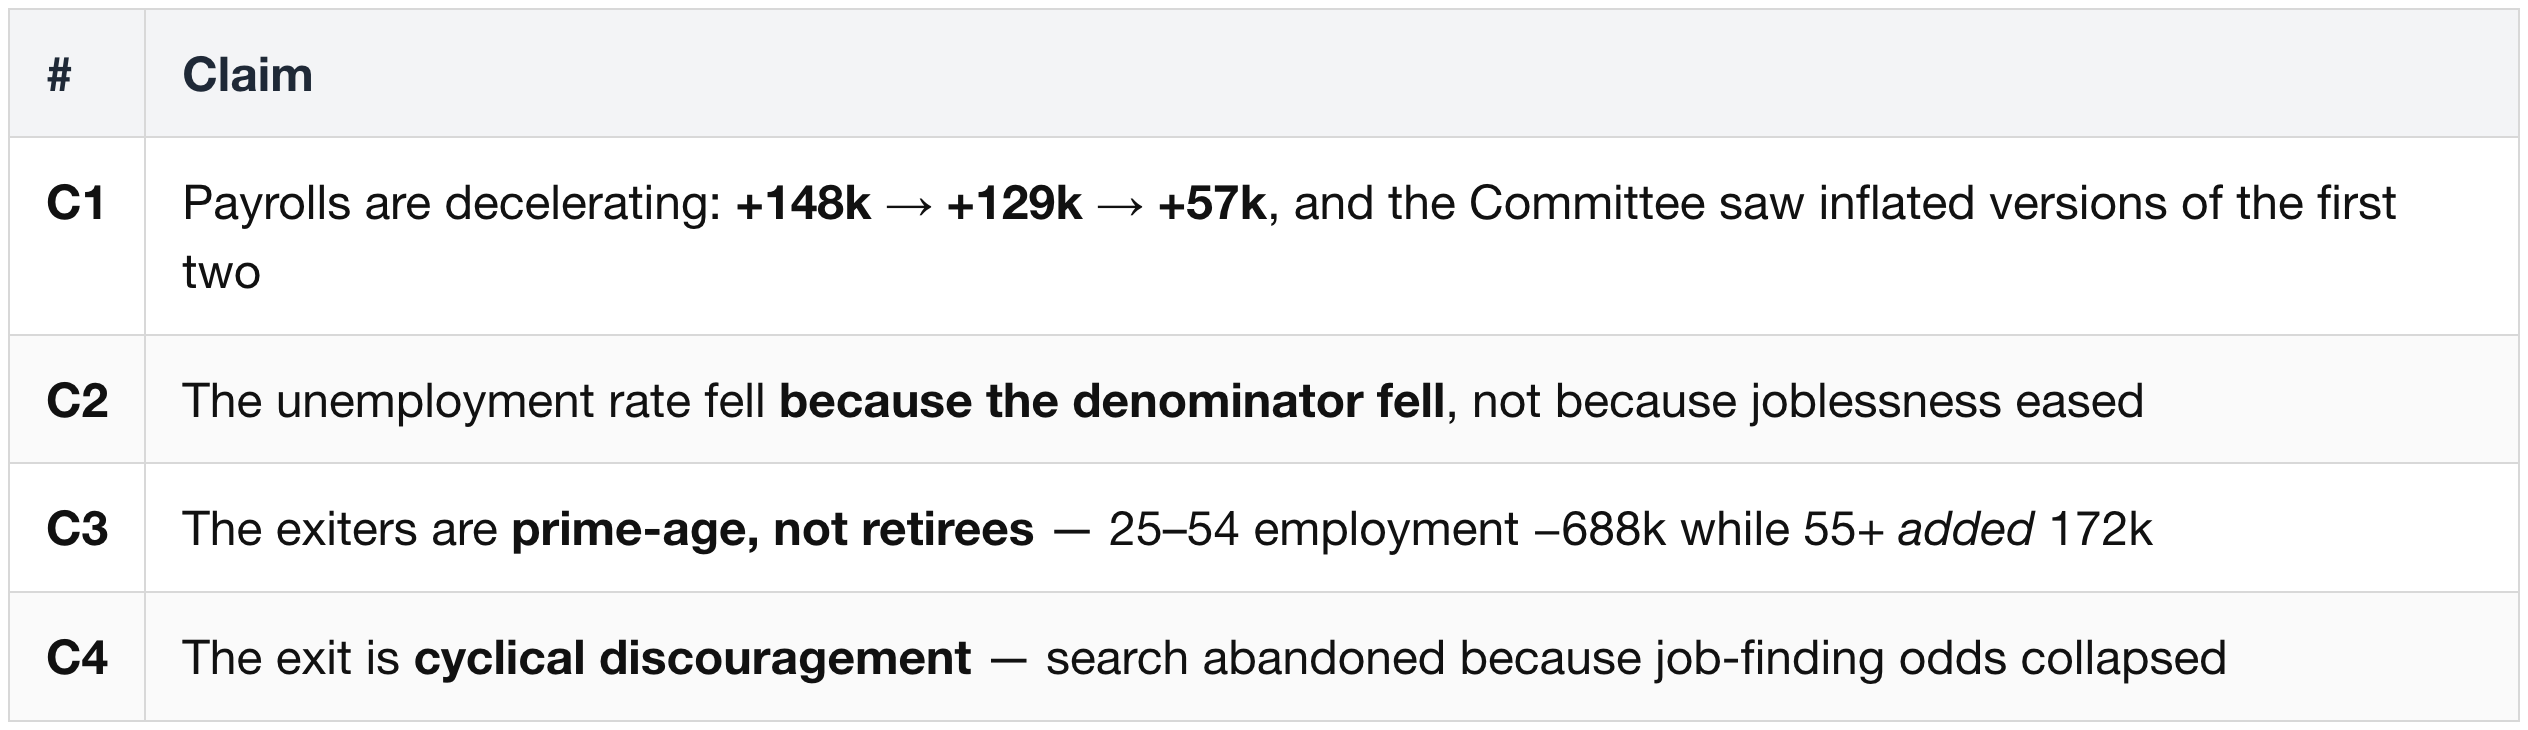
The five counters, mapped to their target. The source column does most of the work below.
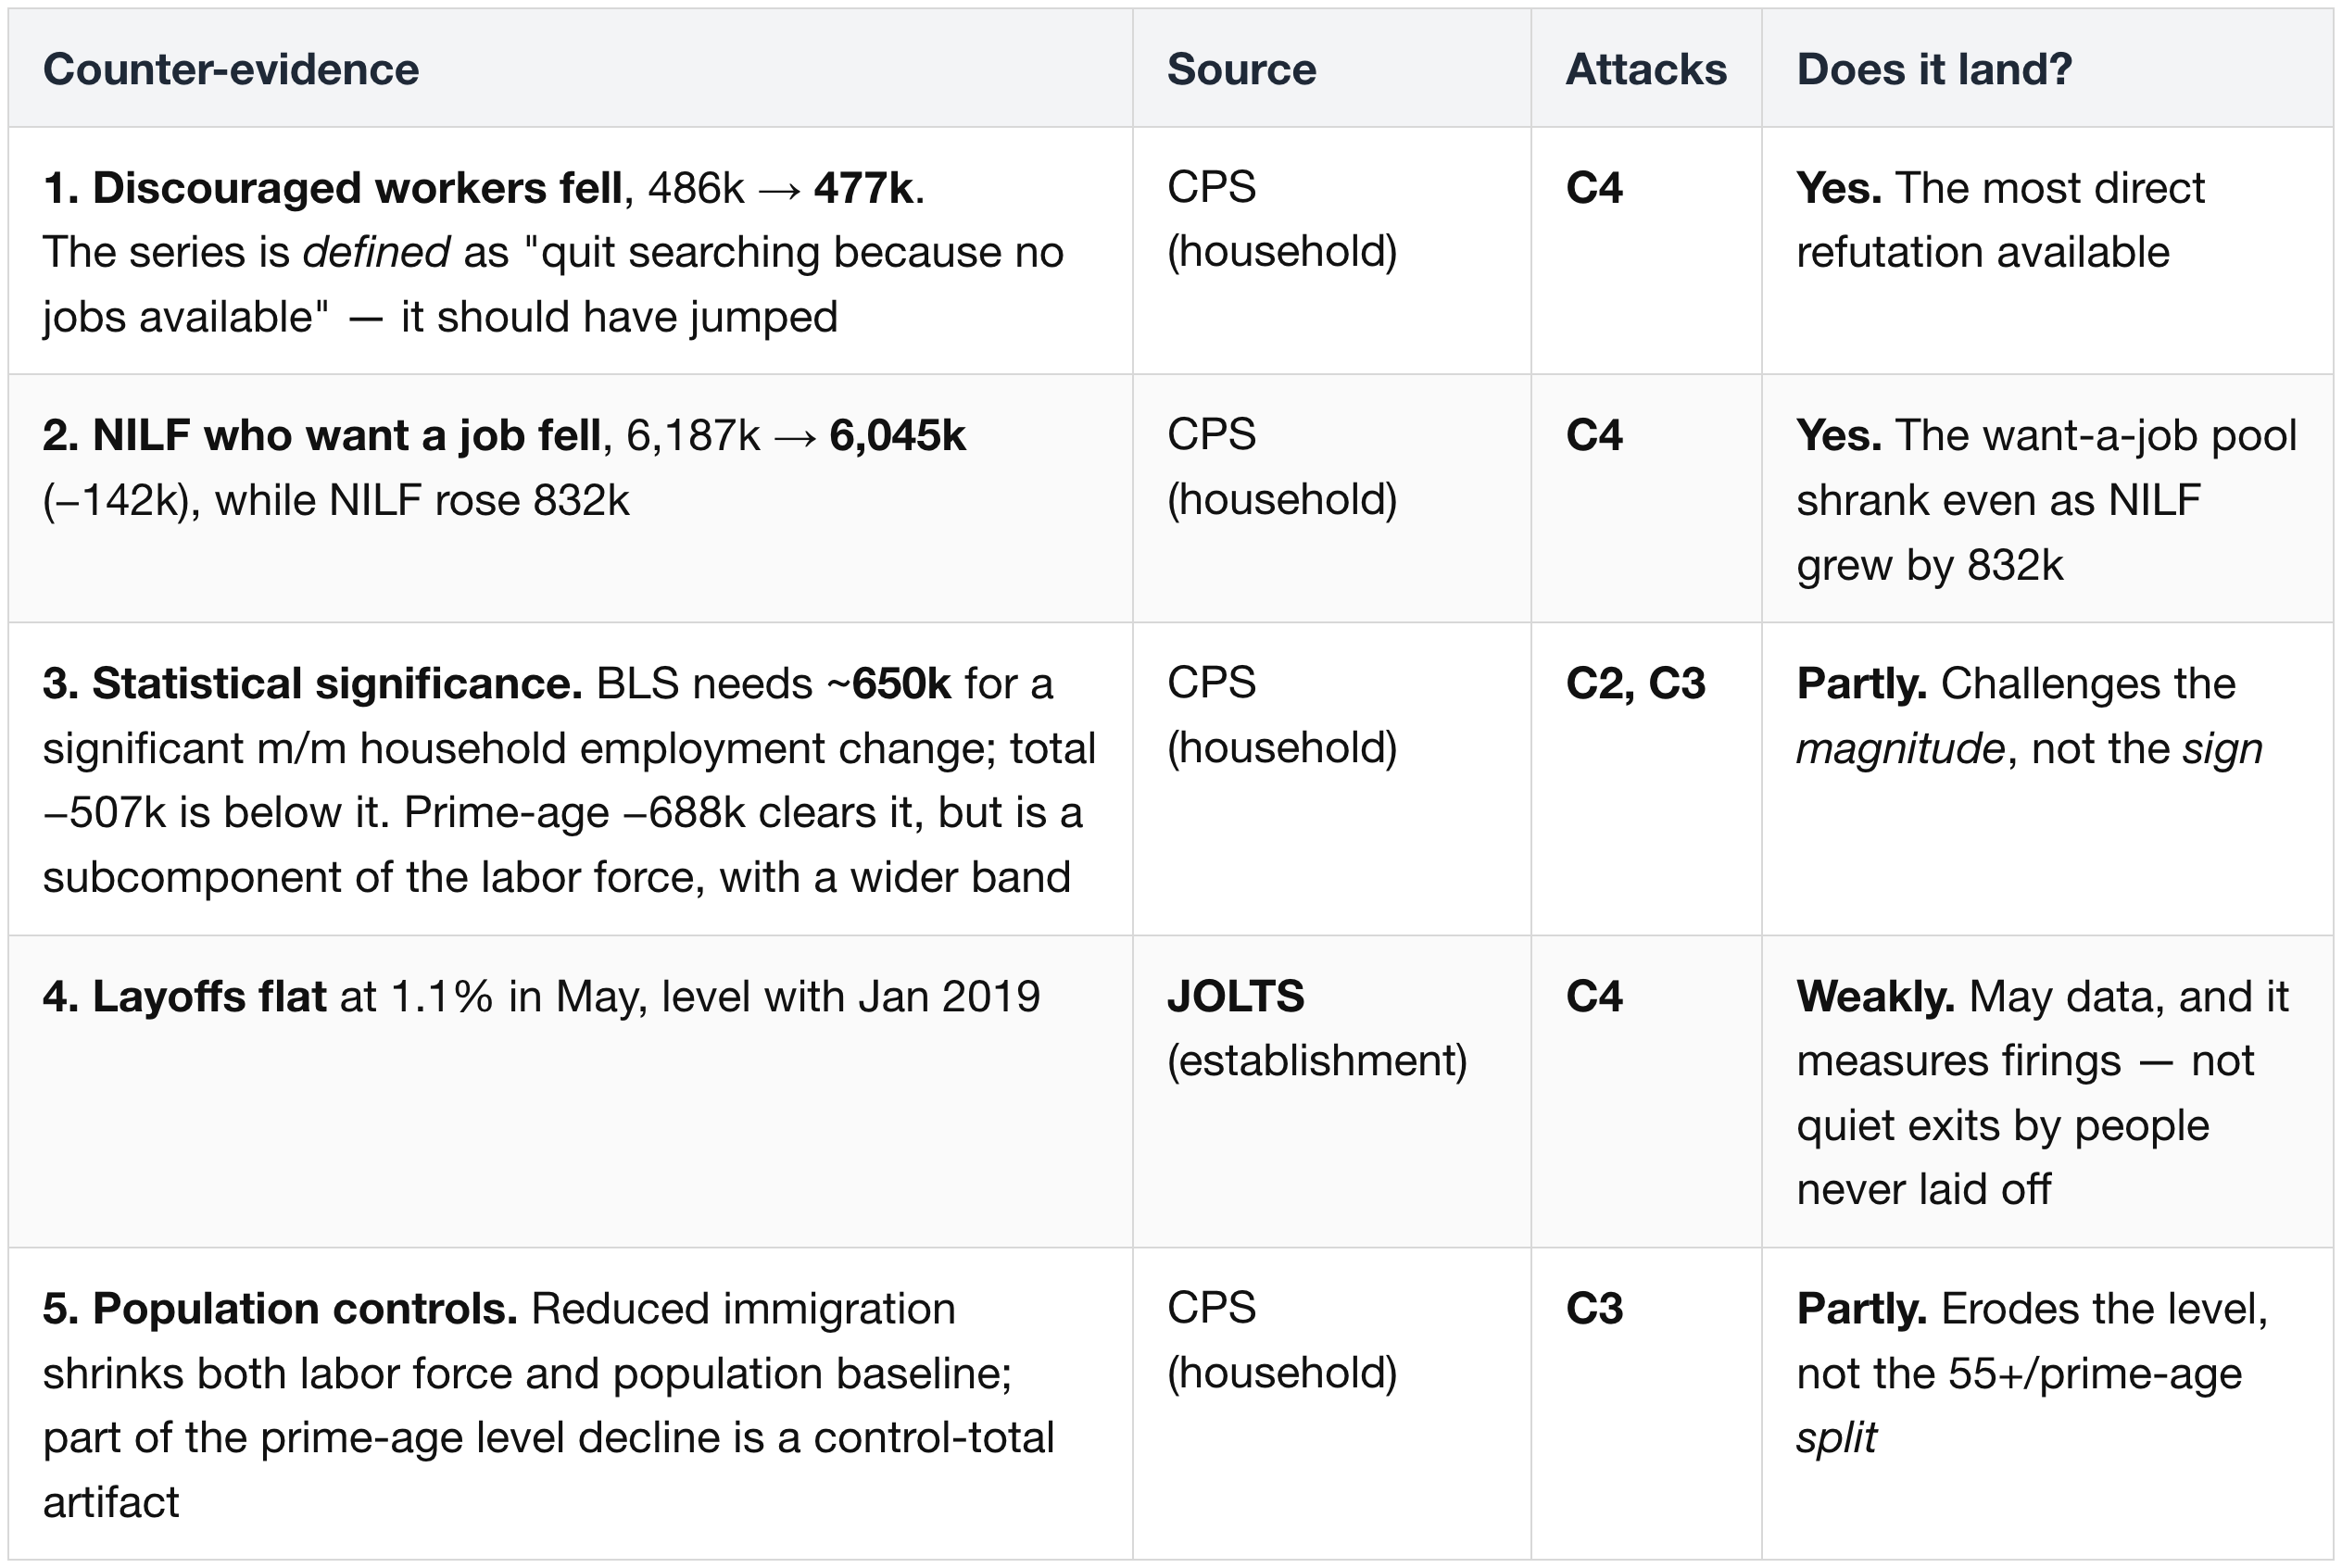
Only C4 breaks — and it breaks on a conflict inside a single data release.
The June report contains two kinds of evidence about the same people, and they disagree.
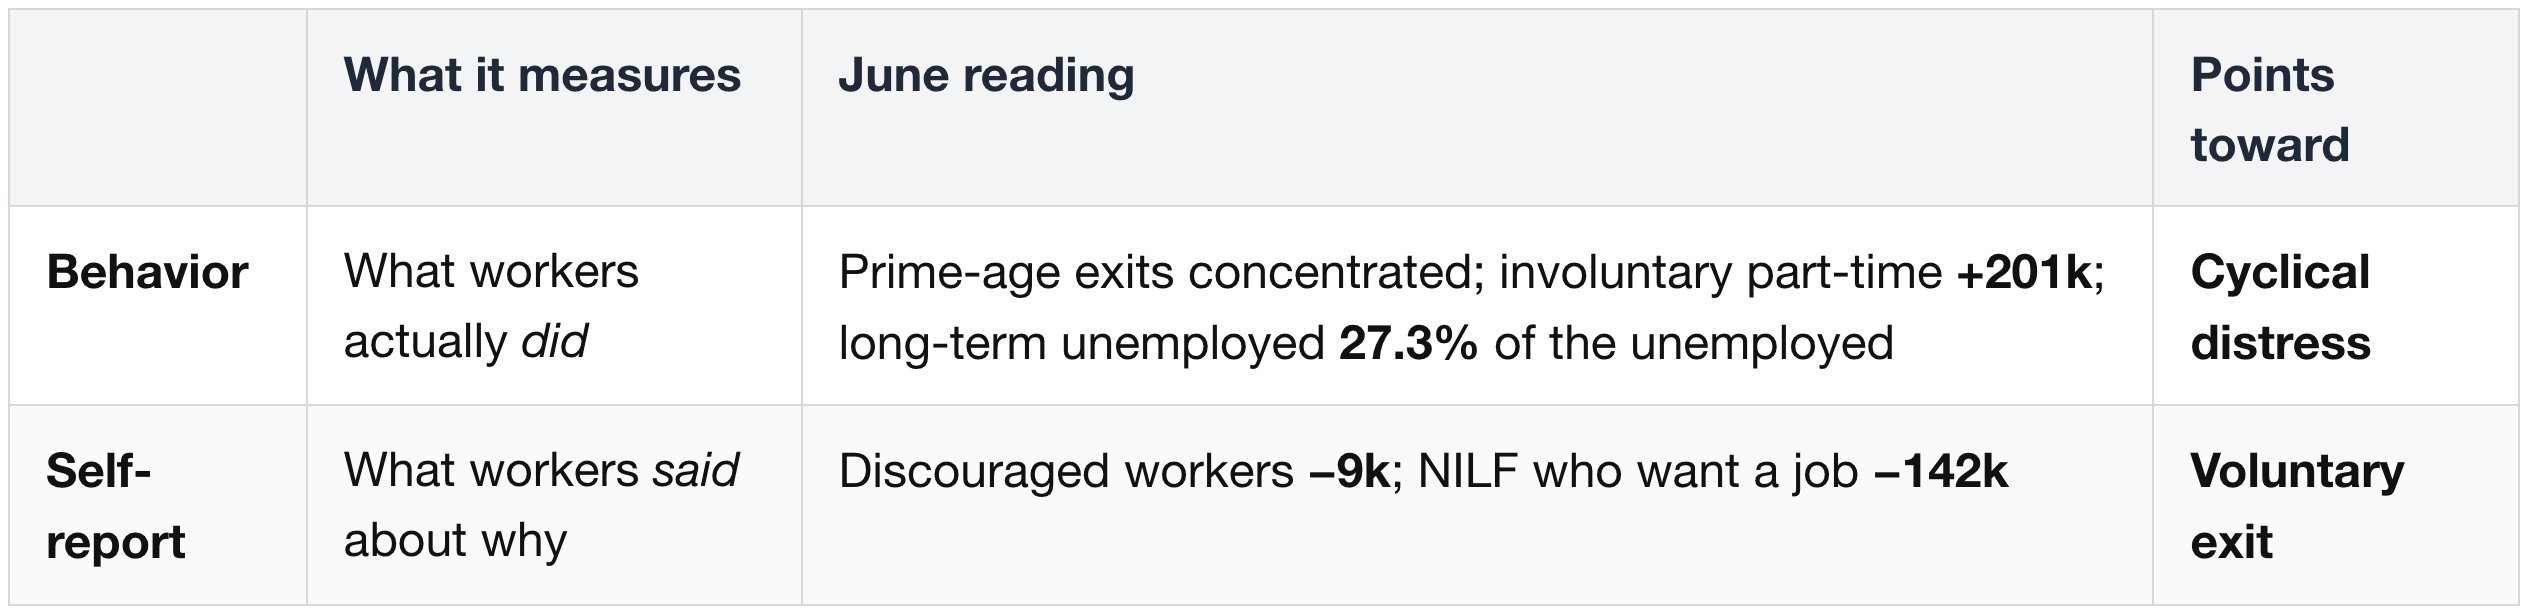
- Behavior says these people were pushed out of work.
- Self-report says they left because they did not want a job.
- Both come from the same survey and month, drawn from the same respondent pool.
A reasonable resolution: discouragement is reported on a lag.
- "Discouraged worker" is a self-description, and people do not adopt it quickly.
- A worker whose job ended in May does not, in June, describe themselves as having given up. Six months later, they do.
- If that is right, the behavior data leads and the self-report data follows — the discouraged-worker series would confirm C4 in the second-half of Q3, not in June.
- Two months of the same distribution — the July report lands August 7, 2026 — turns C4 from hypothesis into trend.
That resolution is defensible. It is not proven, and it is exactly the kind of story that sounds right and turns out wrong. Stated without varnish:
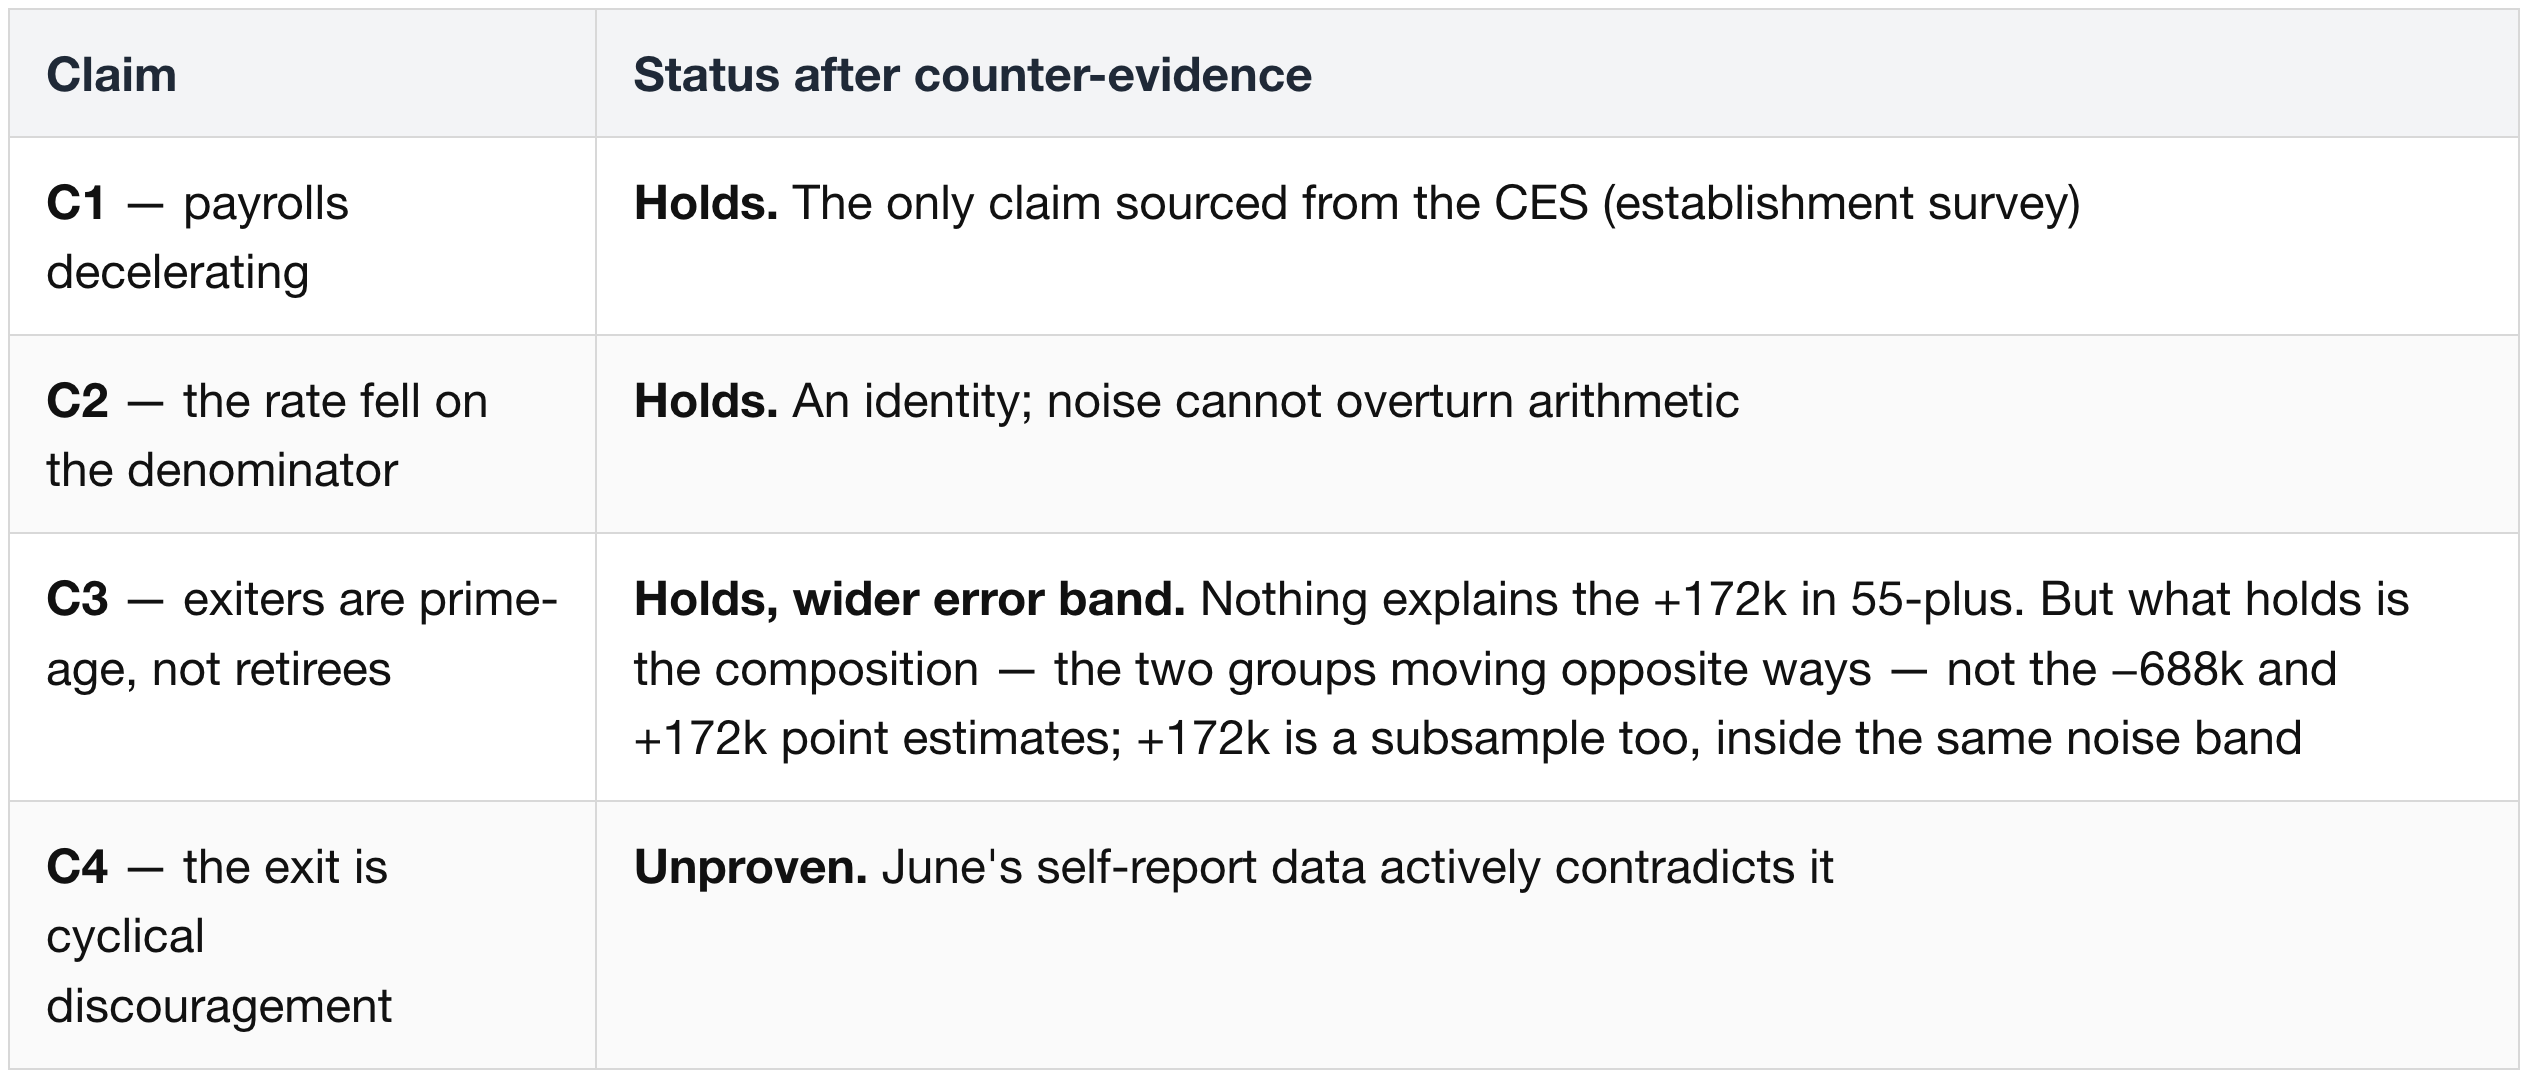
5. How the Committee Would Likely React
The Committee has said nothing about the June report yet. What follows works out its likely reaction from the decision rules stated in its own minutes.
5.1 The parts of the minutes that survive
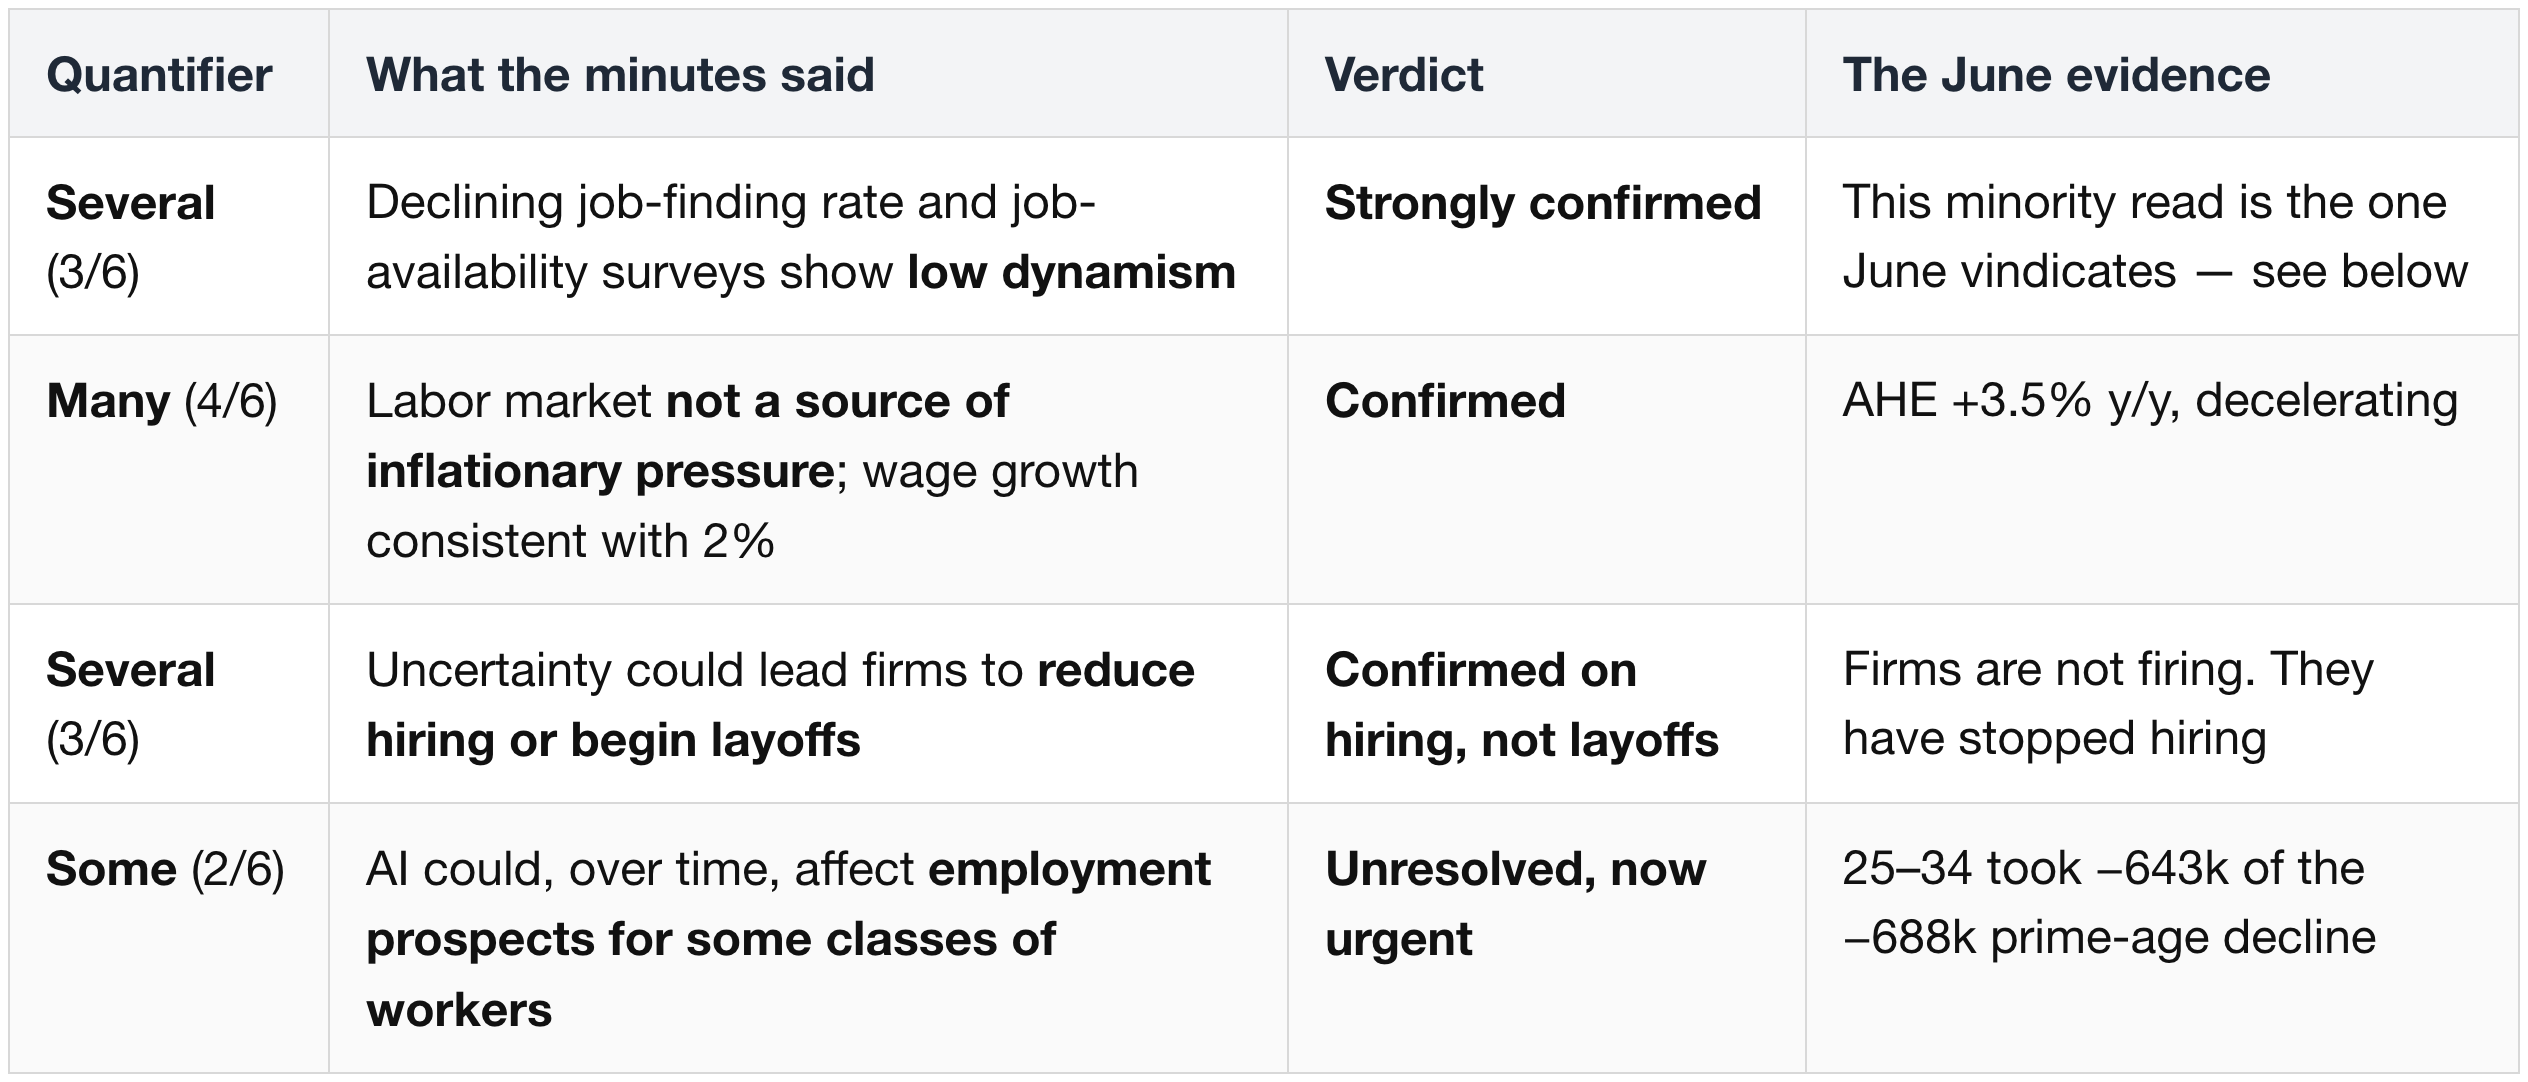
Two of these deserve another line.
- The low-churn warning is the one that quietly matters most. A collapsing job-finding rate is exactly what turns an unemployed 25-to-54-year-old into someone who stops looking for work. The Several who flagged it described June's mechanism a month before the data showed it.
- The AI-displacement warning cannot be settled yet. The concentration in 25-to-34-year-olds is either AI replacing entry-level workers, a side effect of population adjustments, or noise. One month of data cannot tell them apart.
5.2 The parts now proven wrong or unsafe
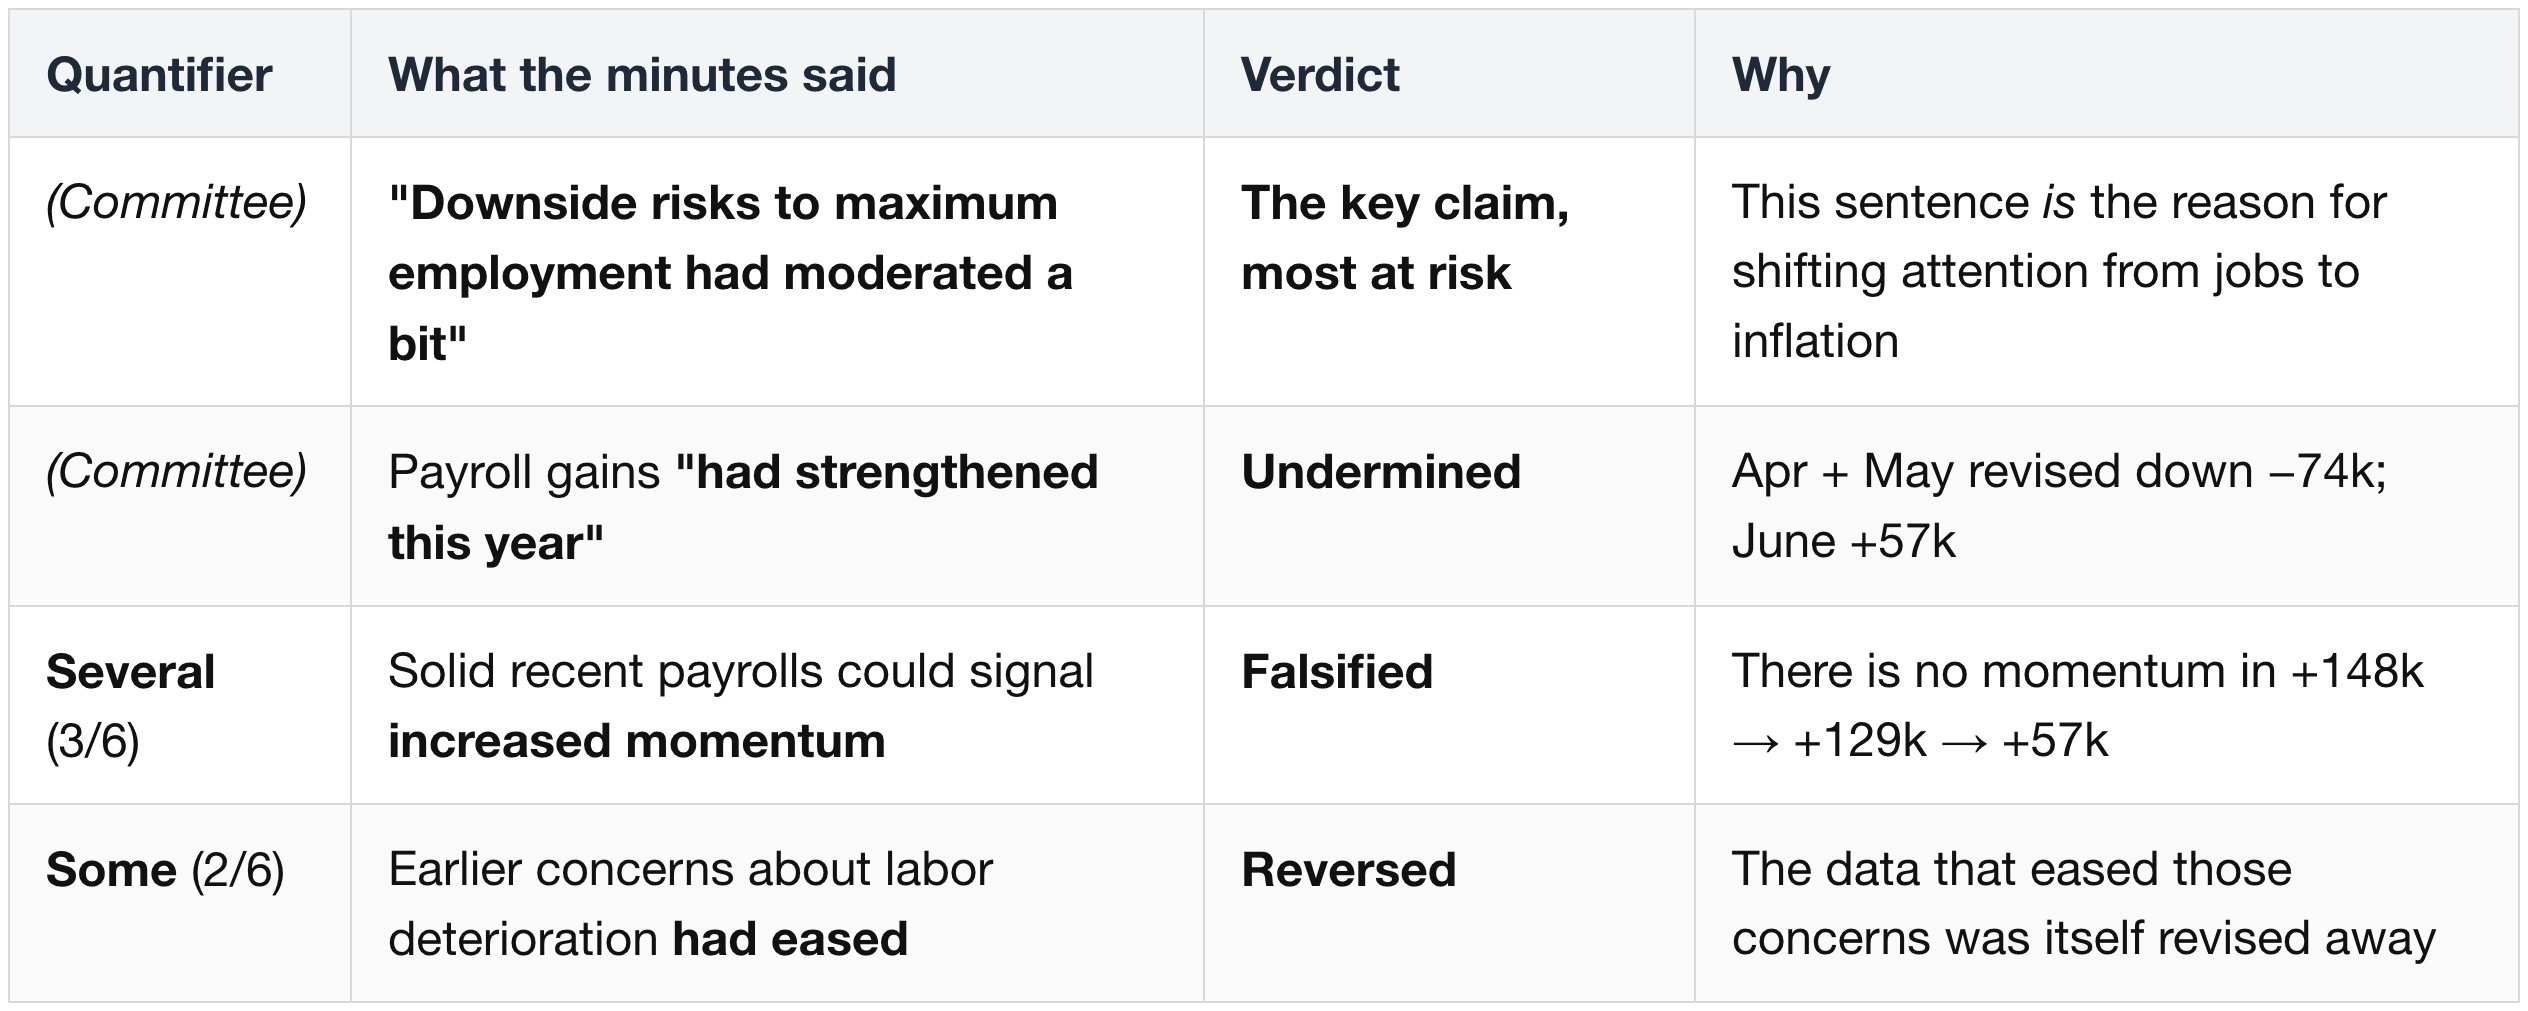
- Every falsified item traces back to the same two payroll prints.
- Revise those away and the Committee's constructive labor read loses its evidentiary base — while the cautionary minority read (§5.1, row 1) gains one.
5.3 The trap in the Committee's own rule
The trap, in one sentence: the Committee set itself a rule that calls for a rate hike when the job market is stable — and the number it will use to judge stability is the one that improves precisely when the job market is falling apart.
Step 1 — the rule. The hawkish scenario is stated with a condition attached:
"Most participants, however, also pointed to scenarios in which, in the context of stable labor market conditions, inflation would remain elevated due to strong AI-related demand … In such scenarios, almost all of these participants indicated that some policy firming would likely be warranted."
Read it as a rule: IF labor is stable AND inflation stays elevated → THEN firm.
Step 2 — the number they will read is broken. Which number tells the Committee whether the job market is stable? The unemployment rate. And §4.3 showed what that number did in June:
- It fell to 4.2% — a picture of stability.
- It fell because 720,000 people left the workforce, shrinking the denominator faster than the numerator.
- Hold the size of the workforce steady and the same month would print 4.6%.
So the weakening and the apparent stability are the same event. 25-to-54-year-olds leaving the workforce is exactly what makes the number read "stable."
Step 3 — the two line up. The rule's condition gets met by the very thing that should cancel it.
- June's headlines — unemployment 4.2% (down), payrolls +57k (positive), wages +3.5% (mild) — all read as a stable job market.
- The July 28–29 statement can say "the unemployment rate has changed little" and be literally accurate.
- So the rule stays live. Elevated inflation plus a "stable" job market points to a hike.
- Hiking into a job market that is losing 25-to-54-year-olds is the mistake the rule was never built to catch, because whoever wrote it never imagined the unemployment rate could mislead this way.
Why neither side gets out of it.
- The hawks' condition is quietly failing, and the headline hides it.
- The A few (1/6) who wanted a hike in June have a weaker case in July — but the data will not tell them so.
- Not because inflation improved. Core PCE went 3.32 → 3.41.
- The rule itself — IF labor is stable AND inflation stays elevated → THEN firm — is quietly weakening.
- The doves cannot use the weakening either.
- A cut needs inflation heading toward 2%. Core PCE at 3.4% and rising says no.
- Or a job market bad enough to justify cutting into 3.4% core inflation.
- One month of workforce data — too small to be statistically certain, and contradicted by the "gave up looking" numbers (§4.4) — is not that.
So the likely July outcome is no move in either direction:
- The two scenarios both survive. Most participants (6/6) held both because they could not tell whether AI's price-lowering or price-raising effect wins. June does not settle it either.
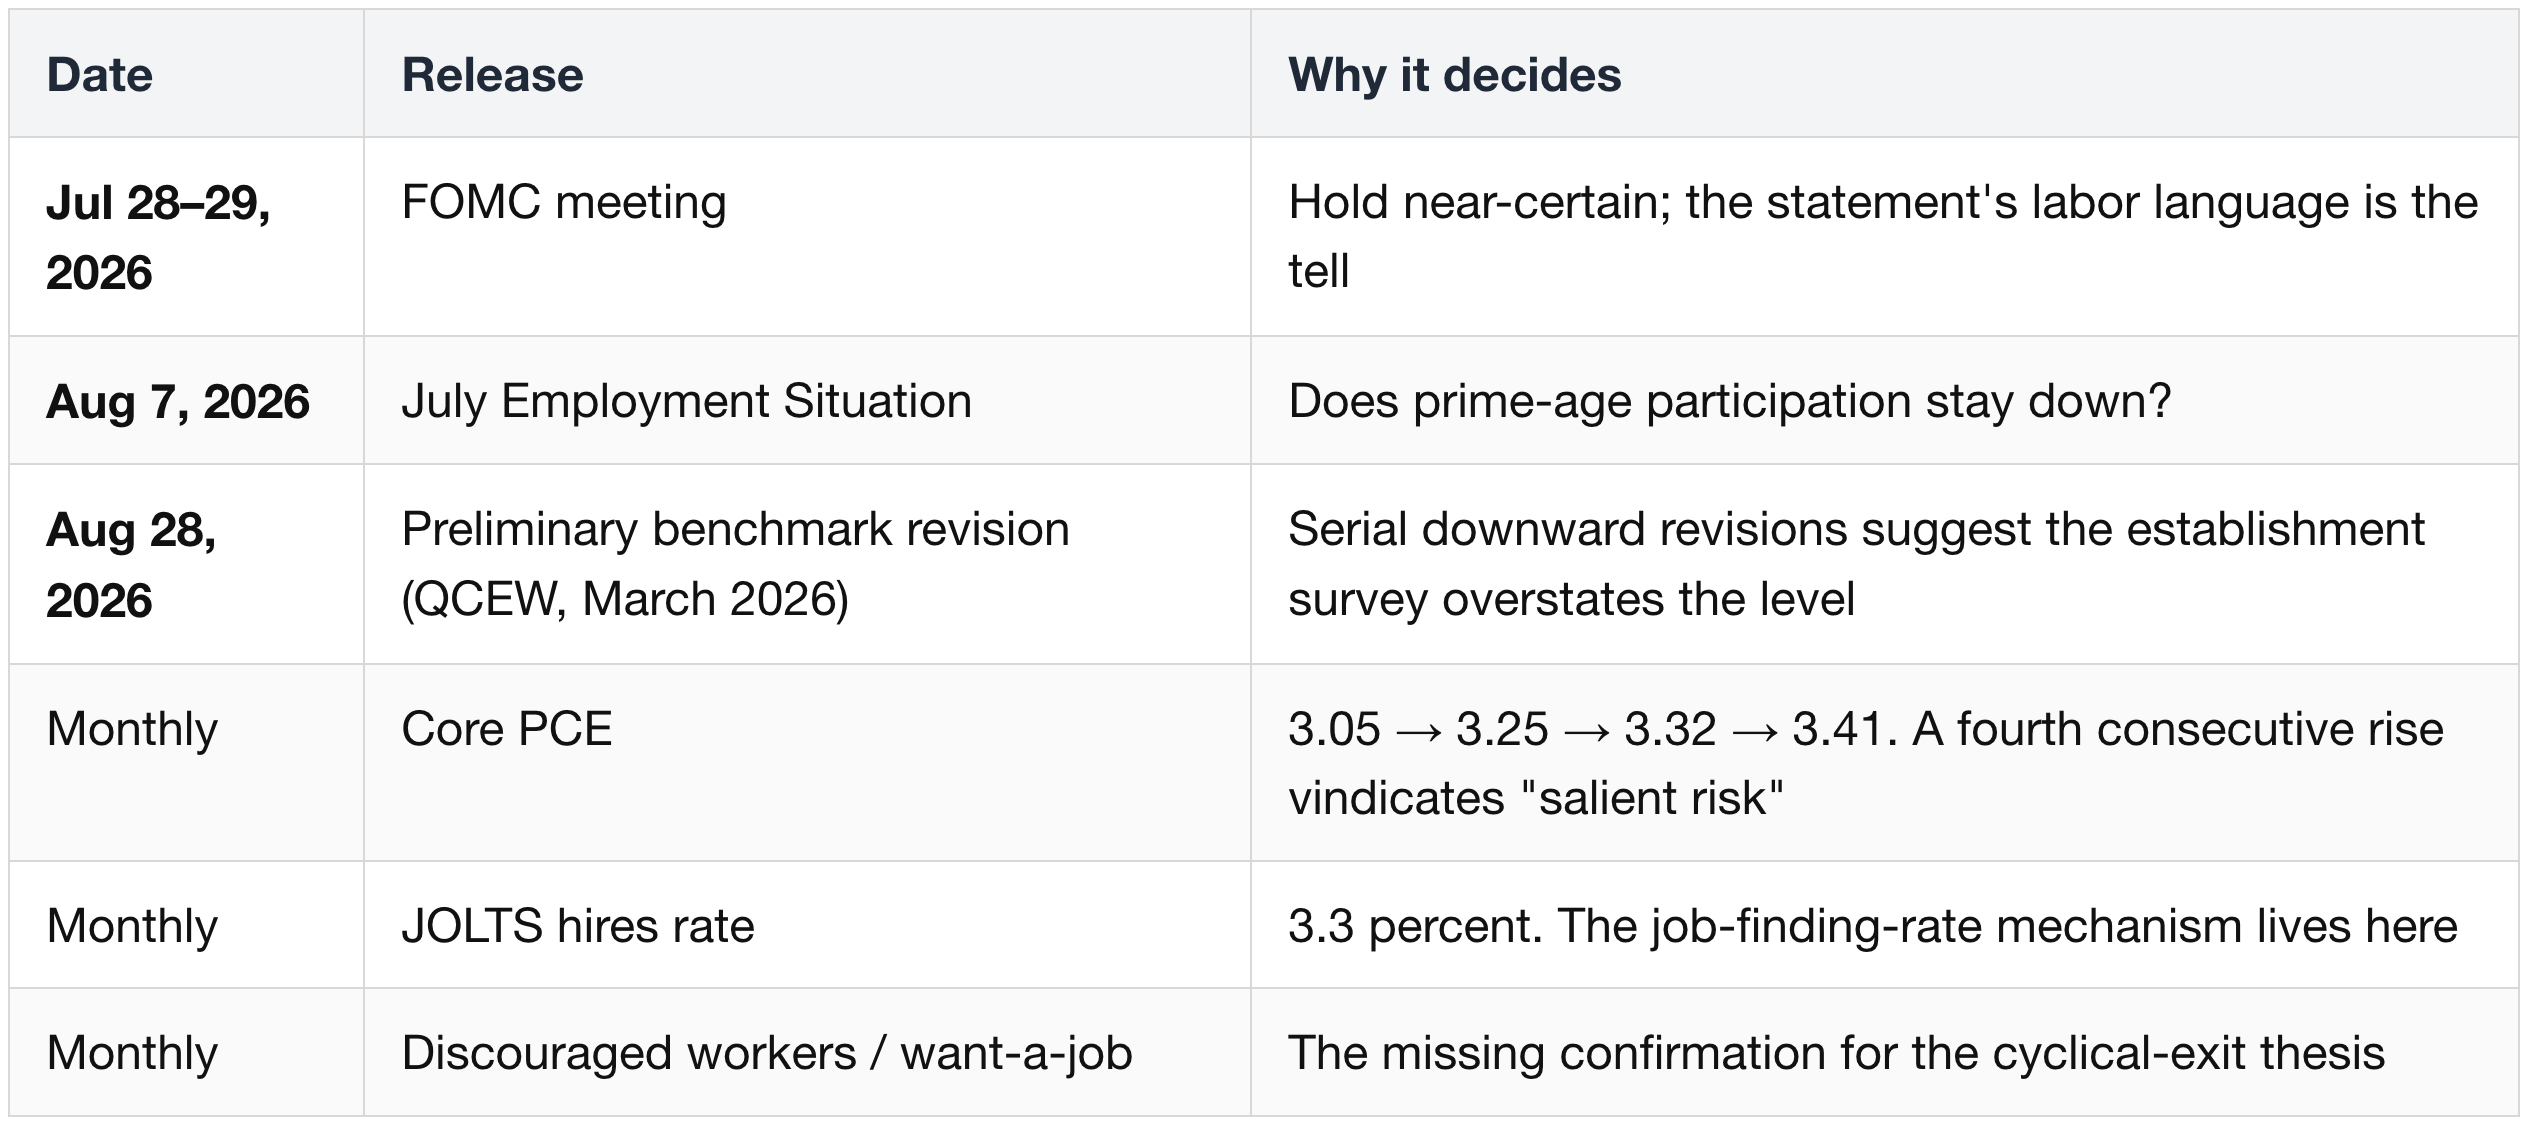
- The hawks lose urgency, not conviction. No hike in July. The Many (4/6) who saw year-end rates above the current range wait for August 7 and August 28.
- The focus drifts back toward jobs — partly, and only if the July report confirms the weakness June showed.
- The Committee has no plan for the real risk. Core inflation at 3.4% and rising, driven by an AI spending boom running the economy hot — while 25-to-54-year-olds quietly leave the workforce.
That last item is the one to sit with. Inflation coming from the spending, weakness showing up in jobs — at the same time.
- Every framework in these minutes assumes an economy running hot shows up in both prices and jobs — that is what makes "stable job market" a safe condition for hiking.
- June suggests it may show up in only one.
5.4 What will decide it — the calendar ahead
6. Bank Reserves: Still "Ample," and No Change Made
6.1 What happened
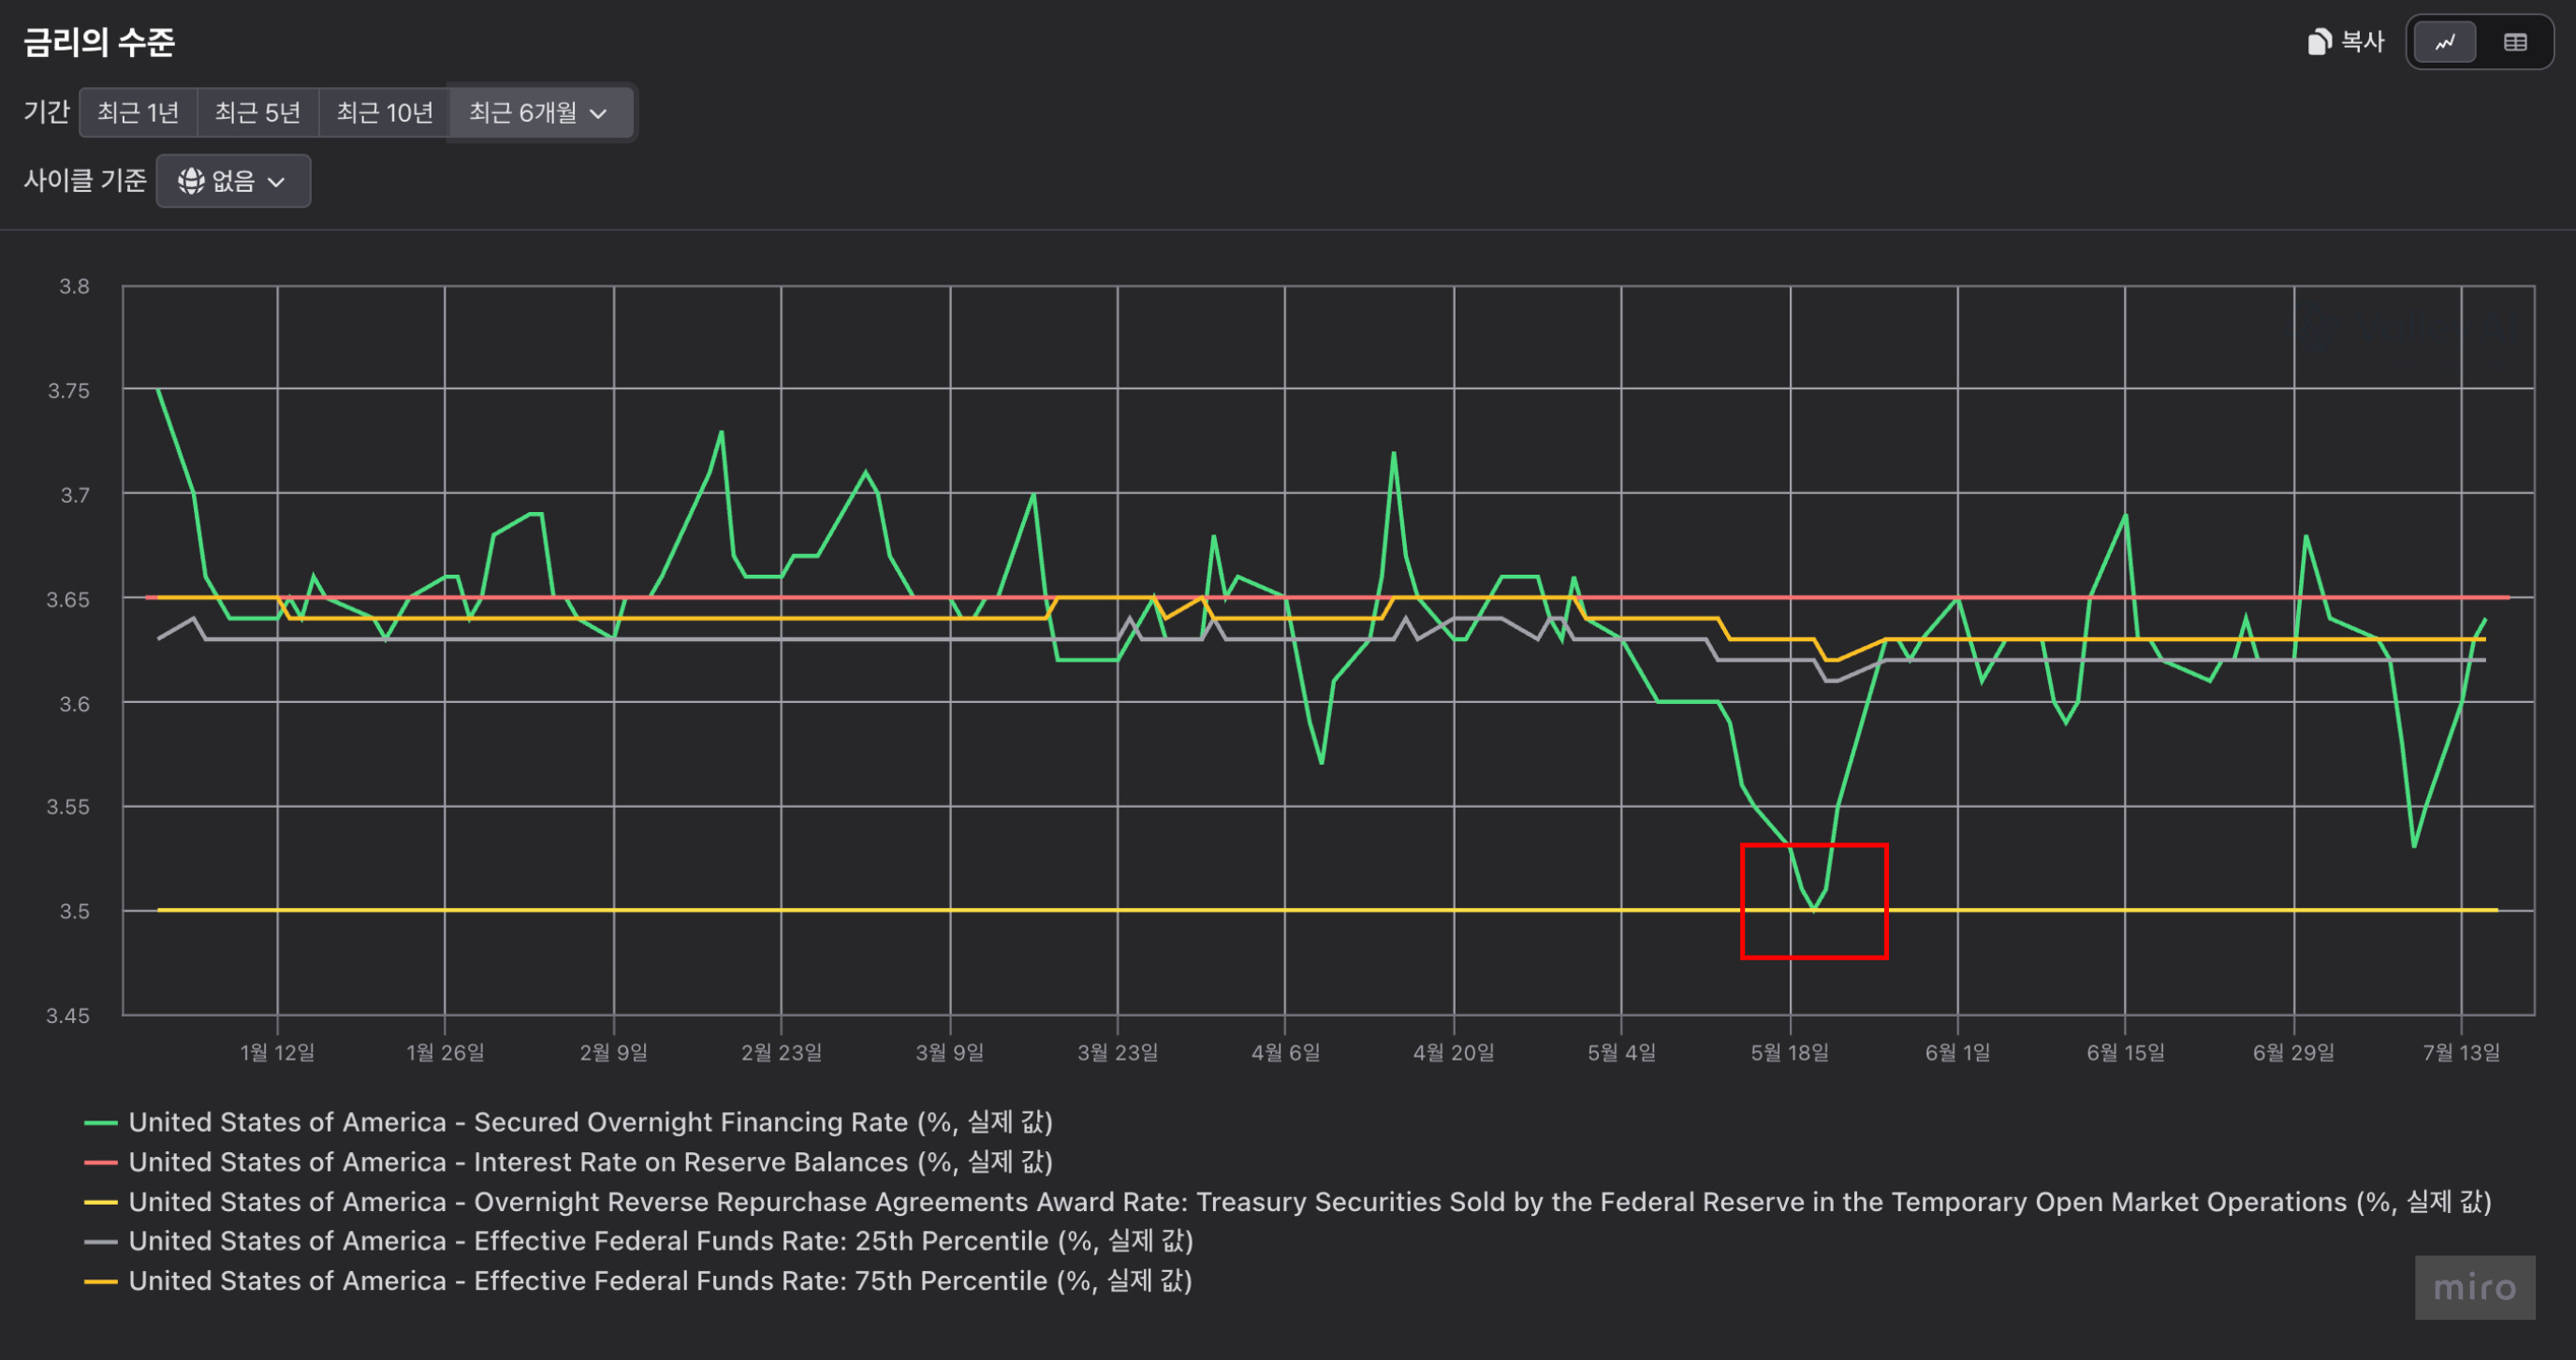
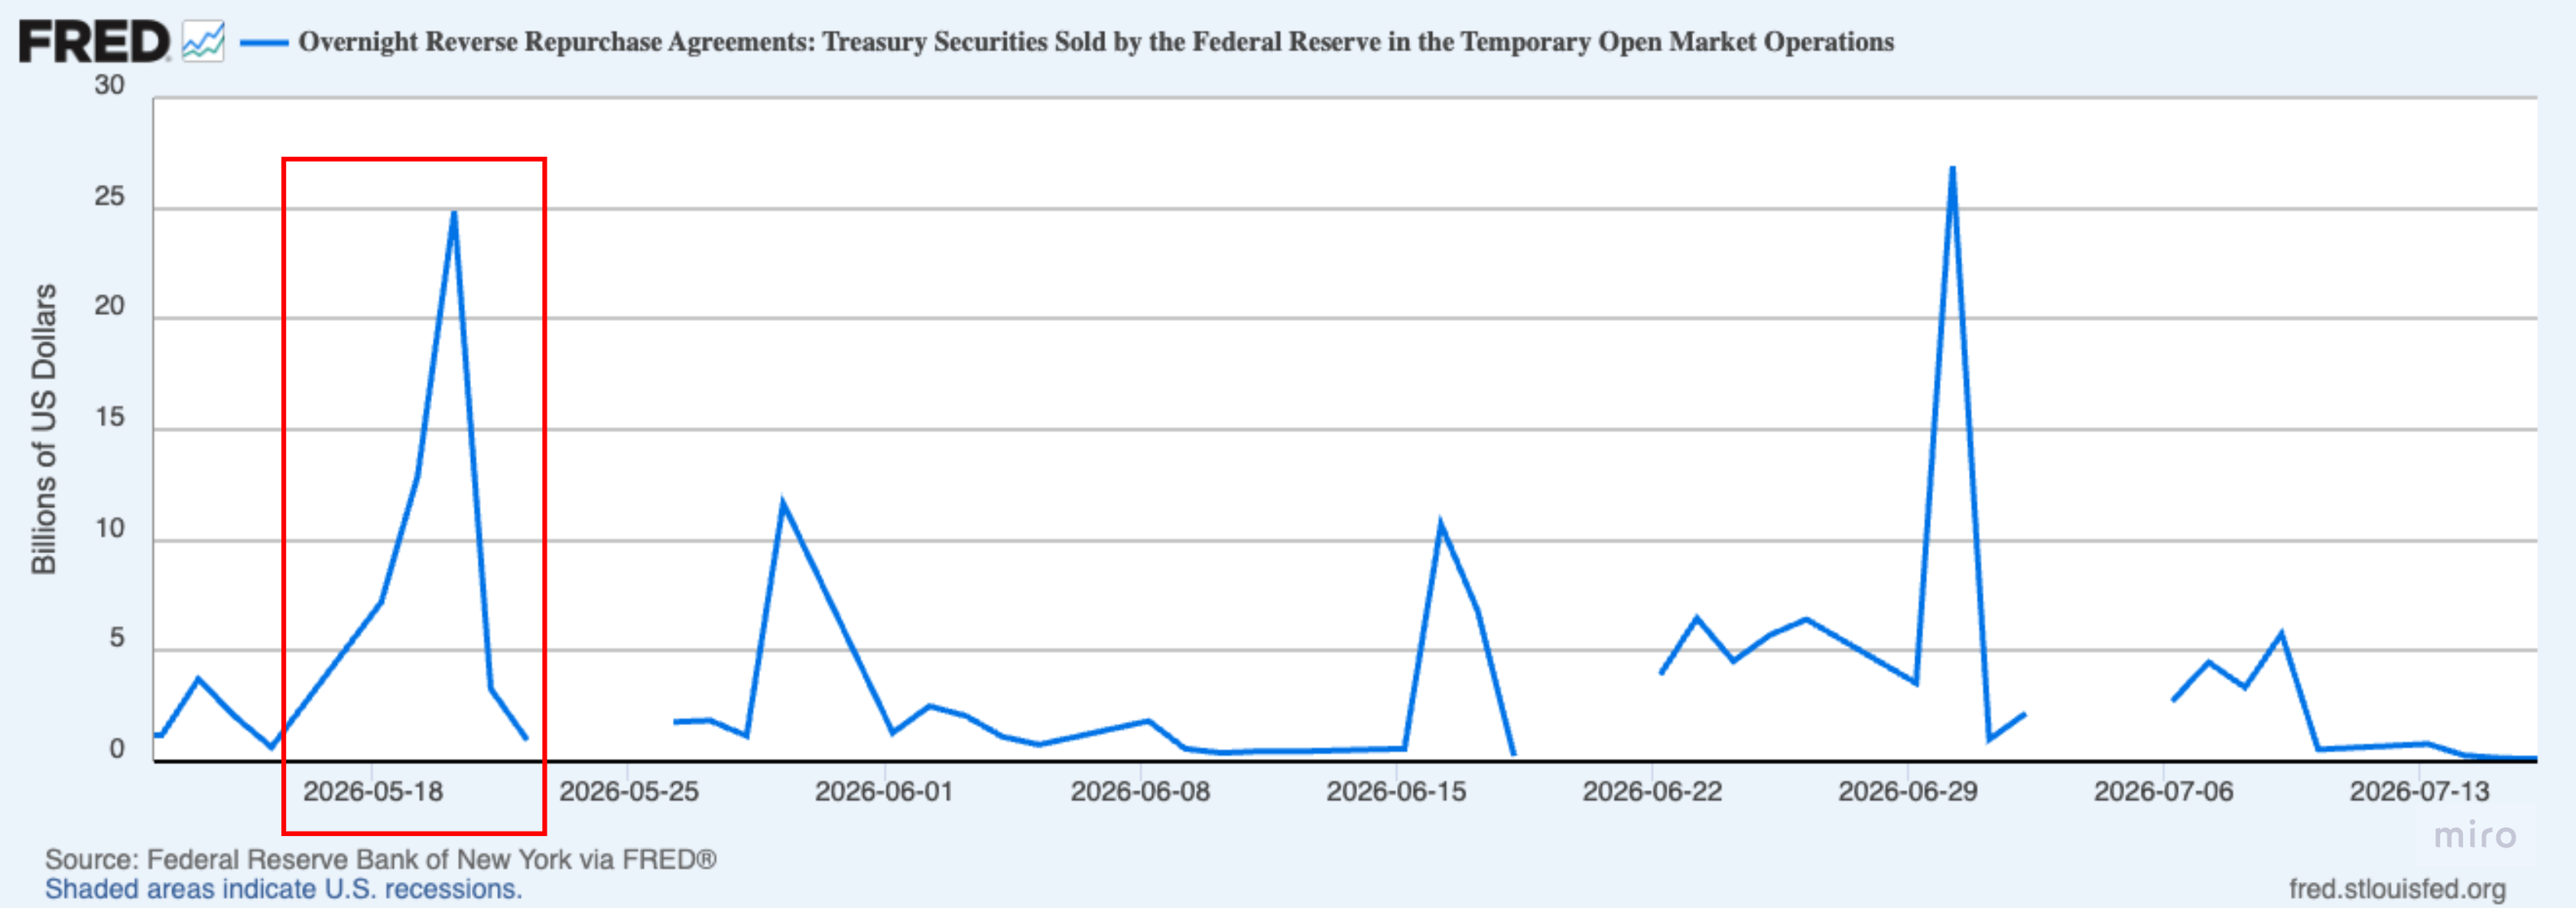
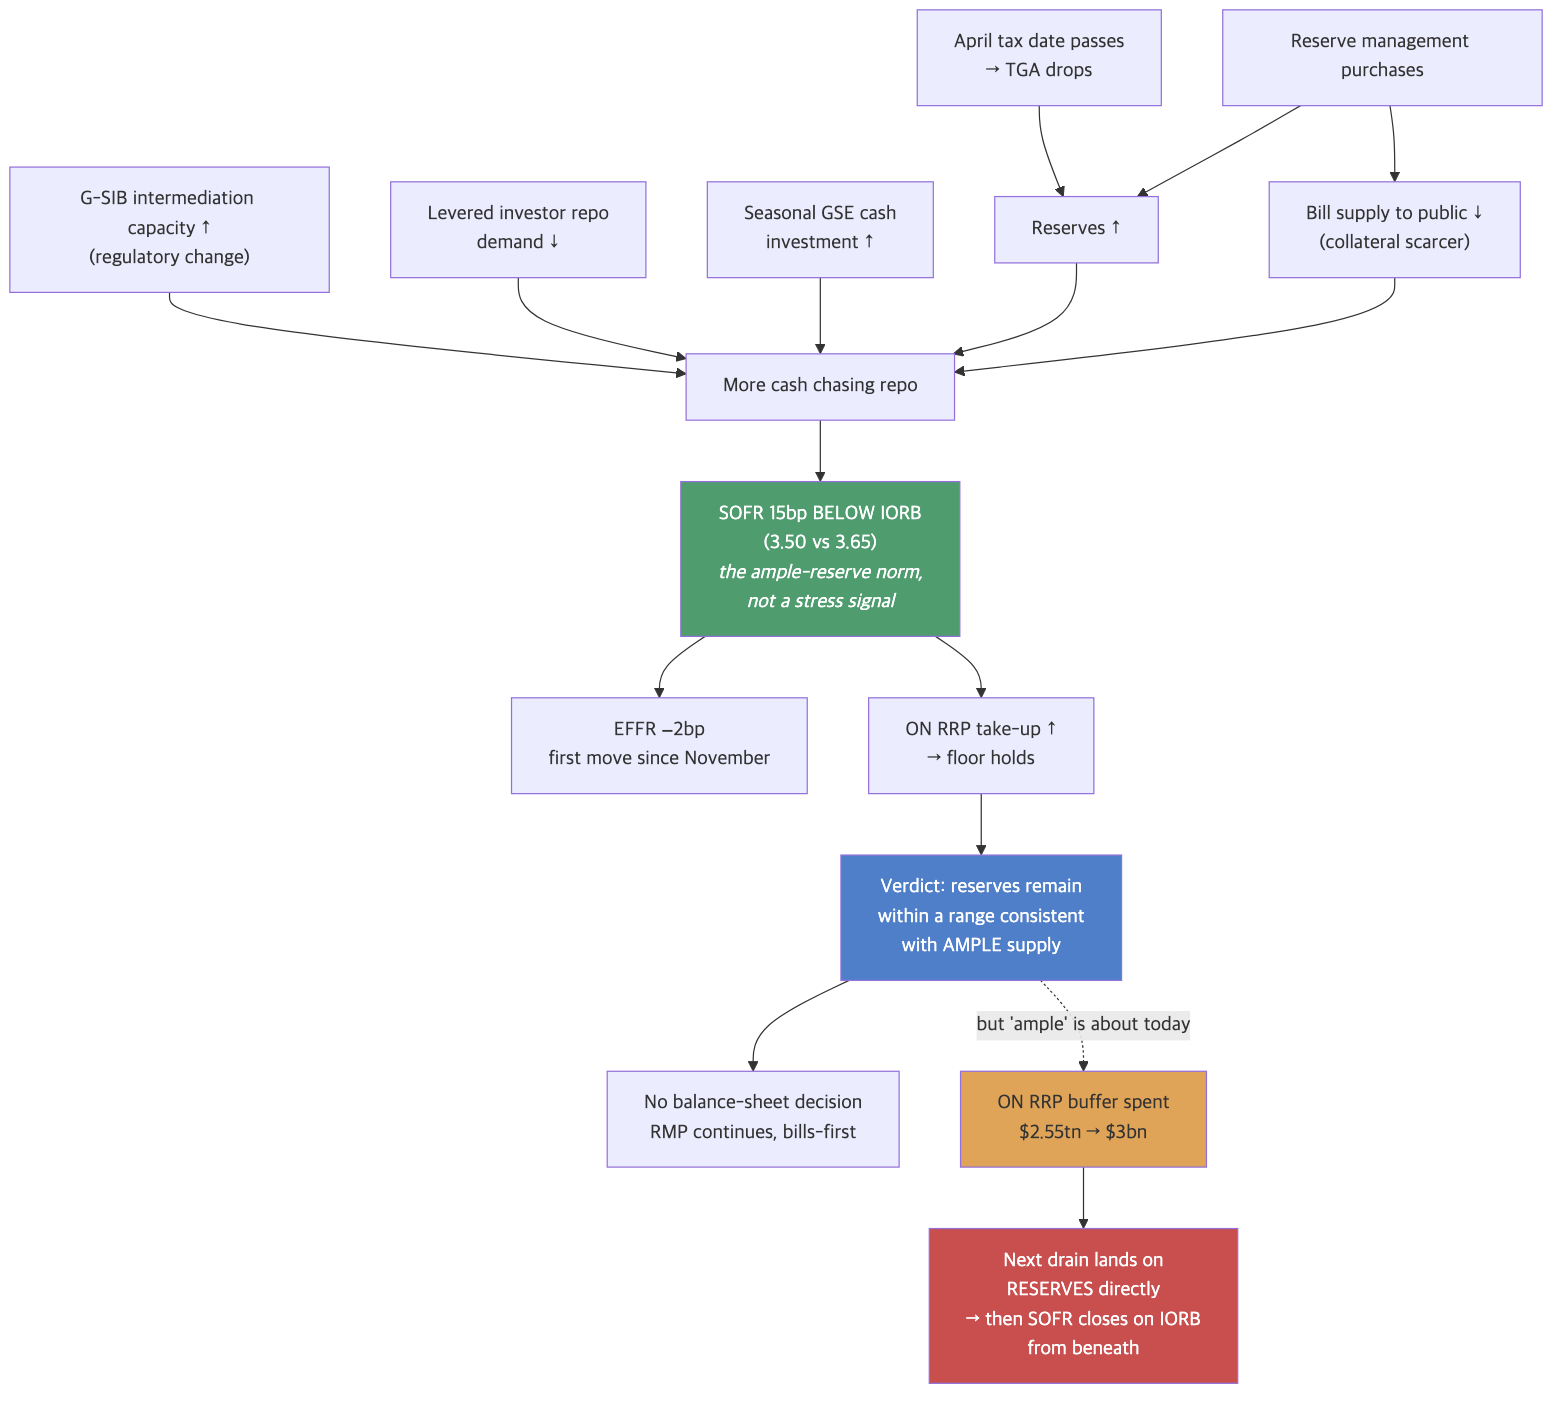
- In mid-May, SOFR fell to as much as 15 basis points below the interest rate on reserve balances (IORB). With IORB at 3.65 percent, SOFR formed near 3.50 percent, bottoming at 3.50 percent on May 20, 2026.
- There was modest take-up of the Fed's overnight reverse repurchase agreement (ON RRP) operations on days when repo rates were especially low, "confirming that those operations were effective in firming the floor under money market rates."

- SOFR below IORB is what an ample-reserve system looks like. Cash competes for collateral, so repo clears under the rate banks earn on reserves.
- The alarm case is the mirror image — SOFR above IORB, as in September 2019, when cash was scarce and collateral was not.
- Two months of SOFR under IORB, and the July 9 print at 3.53 percent, therefore say reserves remain ample.
- What is notable is the persistence, not the sign. The manager — the SOMA manager at the New York Fed, who executes the Committee's open market operations and briefs each meeting — pinned part of the initial softness on April tax-date seasonality.
6.2 The five causes
- Reserves increased following the seasonal low around the April tax date, as the Treasury General Account dropped.
- Reserve management purchases (RMP) added reserves and reduced the bill supply available to the public.
- U.S. G-SIBs likely increased intermediation capacity in response to regulatory changes earlier in the year.
- Demand for repo financing on the part of levered investors declined.
- Seasonal increases in cash investments of government-sponsored enterprises coincided with the lowest rates of the period.
Causes 1, 4, and 5 are transitory and calendar-driven. Causes 2 and 3 are structural and policy-made.
- RMP adds reserves on the asset side while withdrawing bills — a double squeeze on SOFR, since it raises the cash and shrinks the collateral.
- Expanded G-SIB balance-sheet capacity does the same from the private side.
Cause 1 — TGA drain = reserve build.
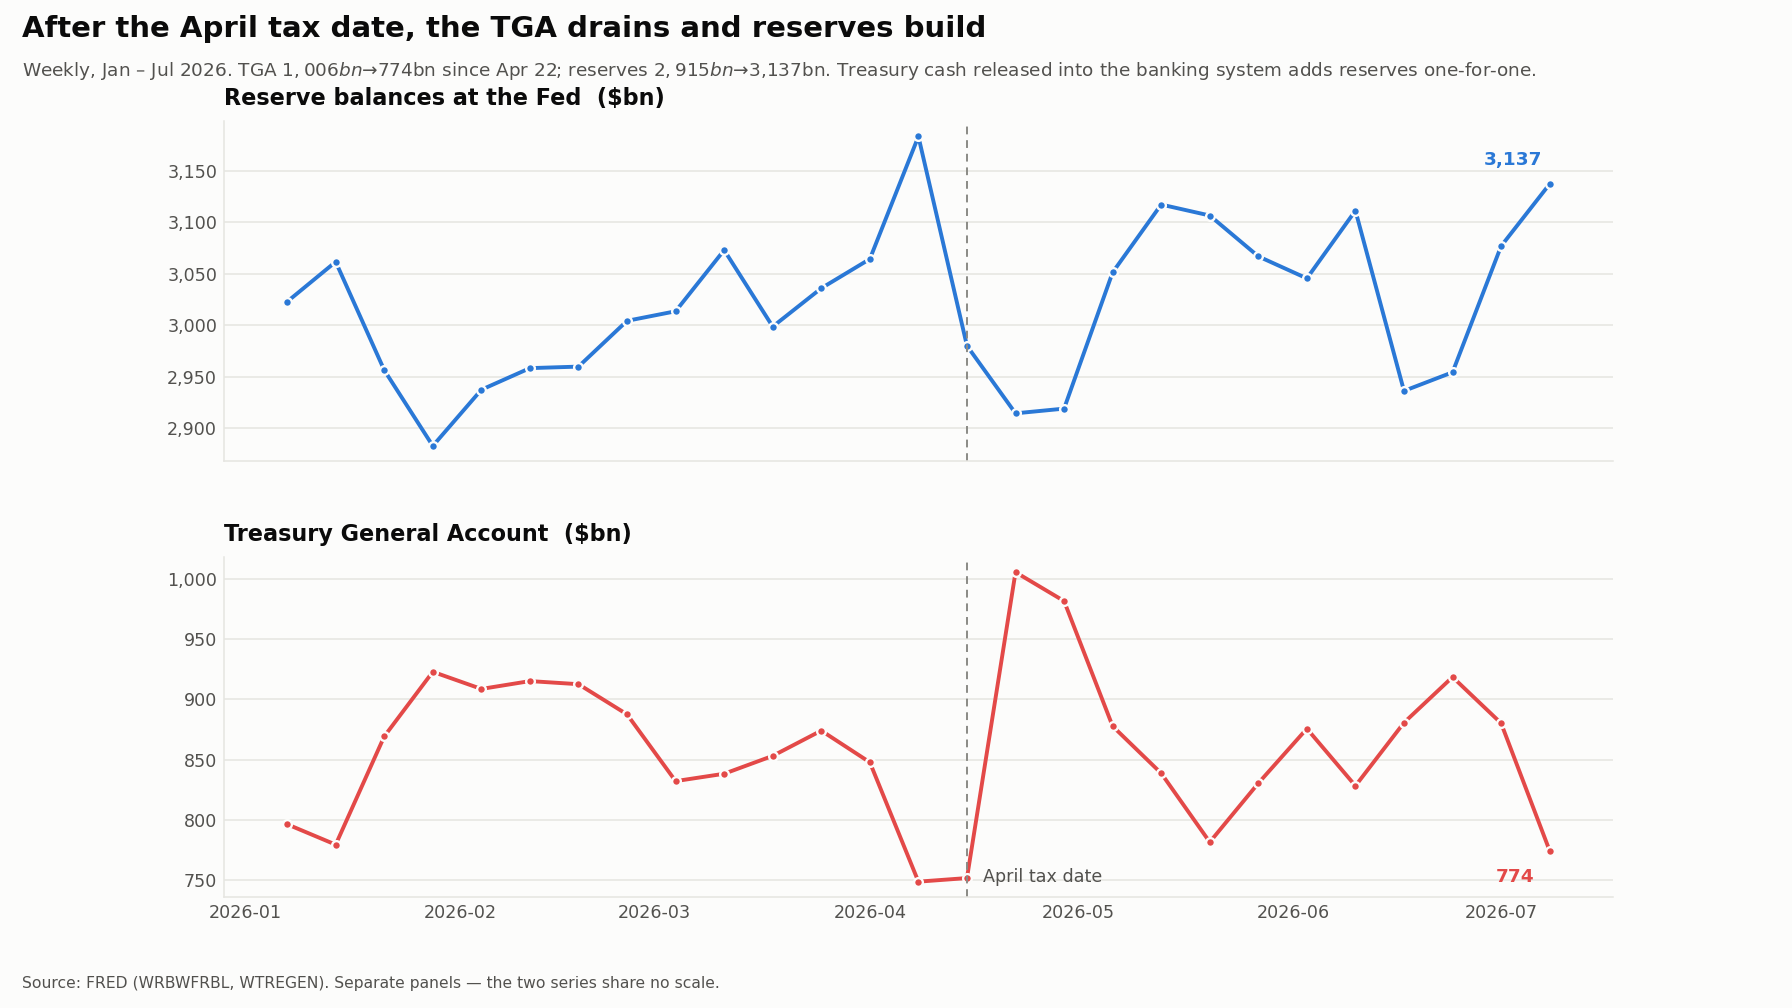
- Both series turn on the same week: April 22.
- Since then: reserves +$223bn, TGA −$232bn.
- Near one-for-one, because Treasury spending down its Fed account credits bank reserves directly.
Cause 2 — RMP purchases, 2026.
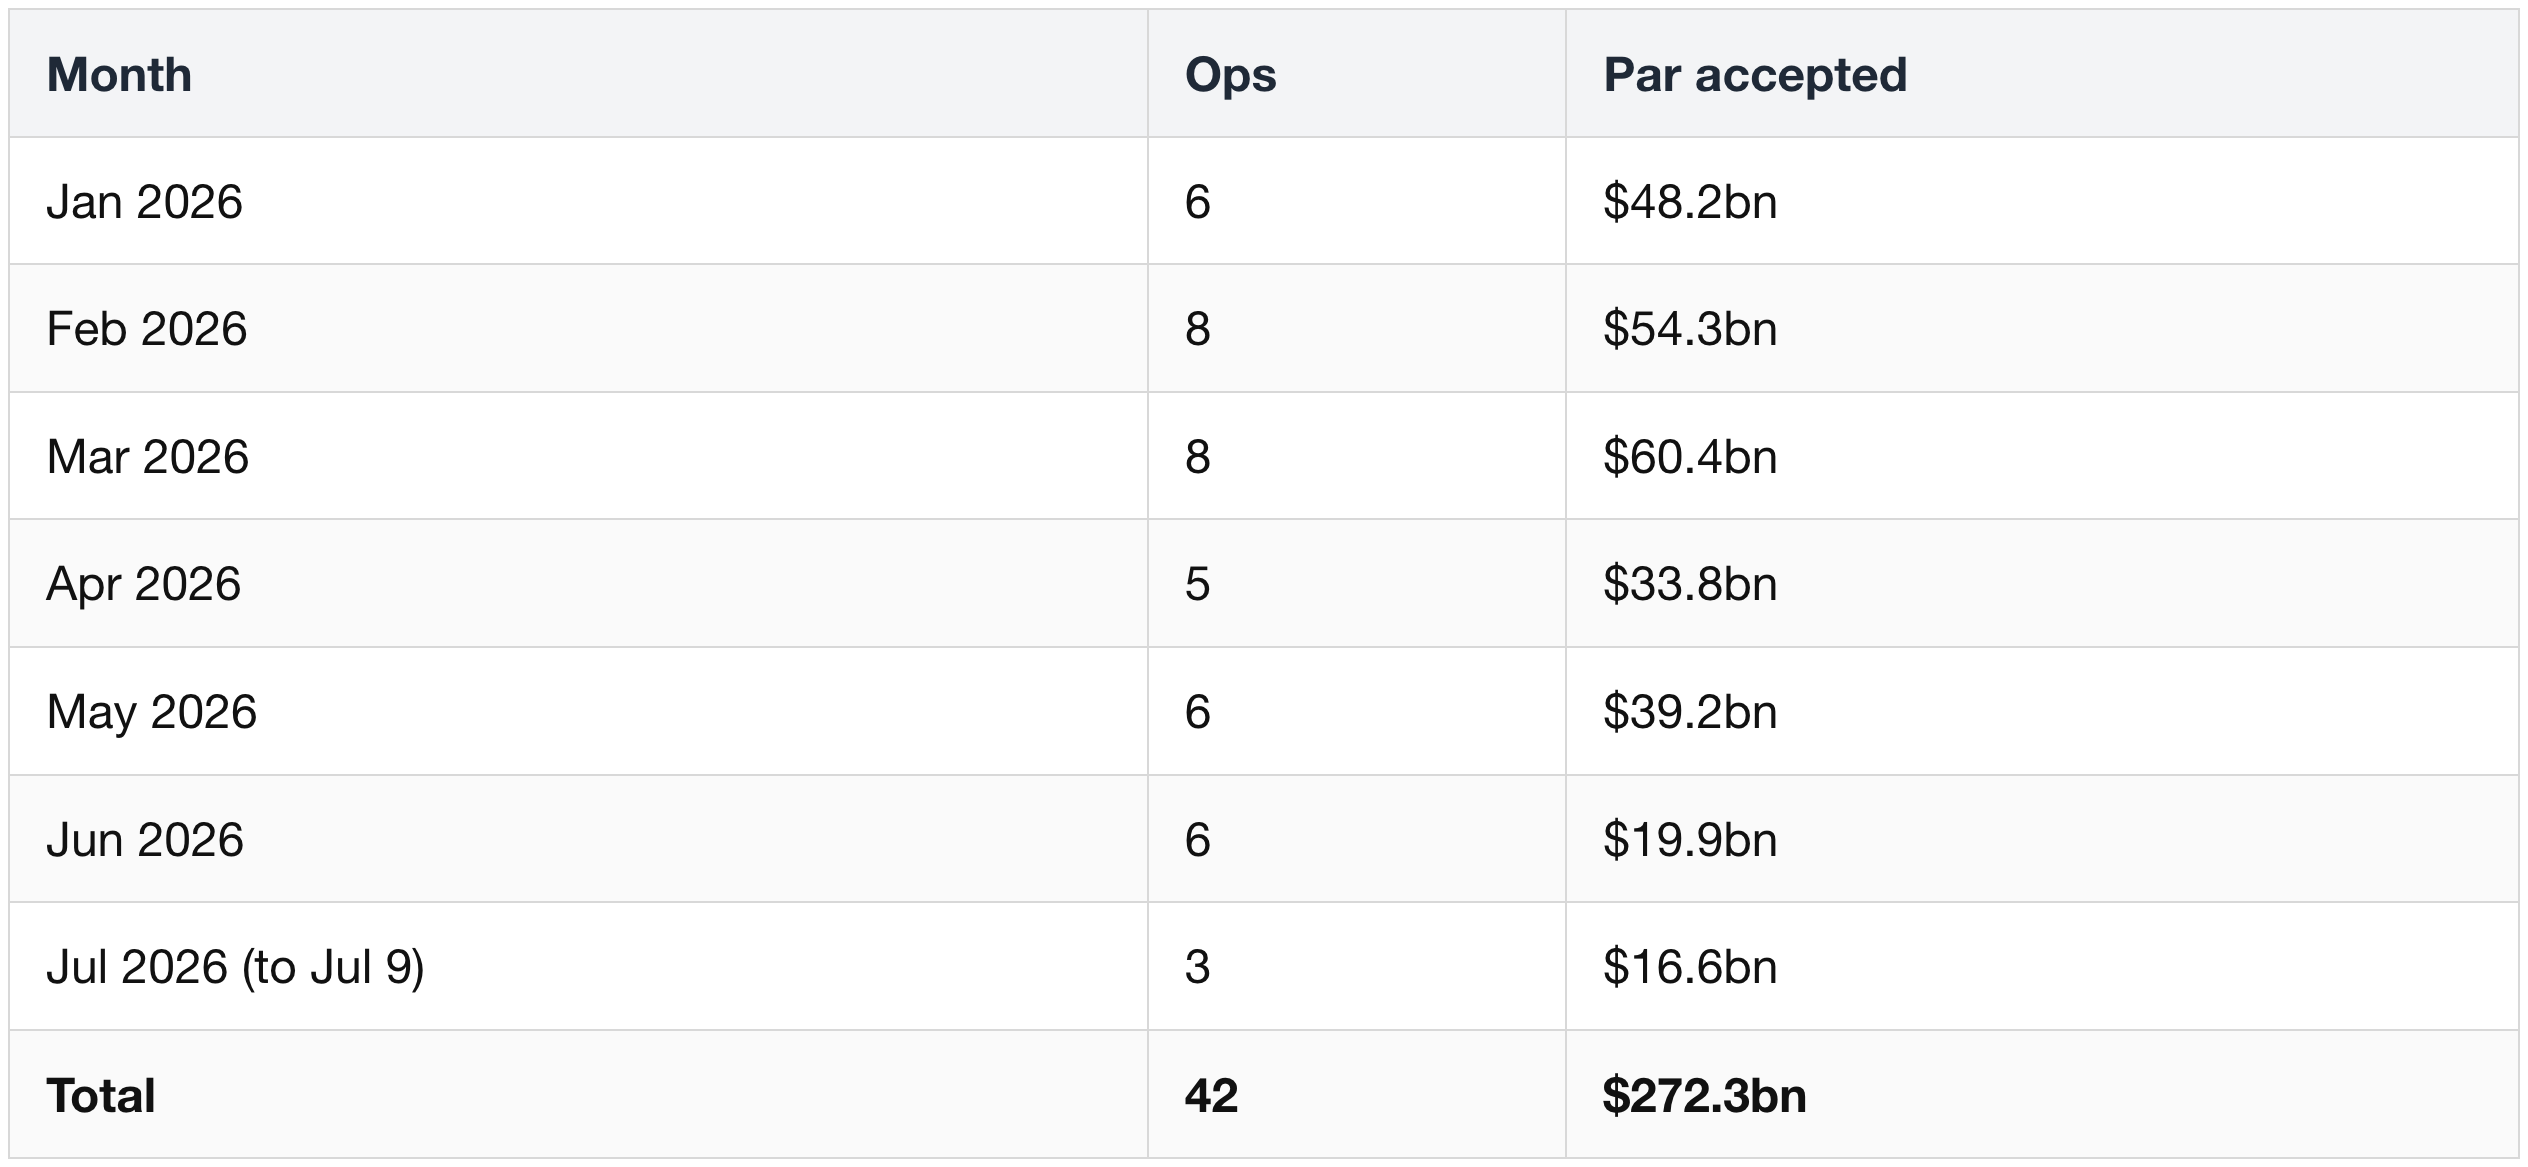
- Almost all bill purchases: $272bn pulled out of the public float in six months.
- Cover ratios of 5–9× — dealers are eager to sell.
- Collateral is the scarce asset, not cash. And the scarcity is deliberate policy.
The floor versus the ceiling — SRF and ON RRP, 2026. Both overnight, so the metric is average daily balance, not a monthly sum.
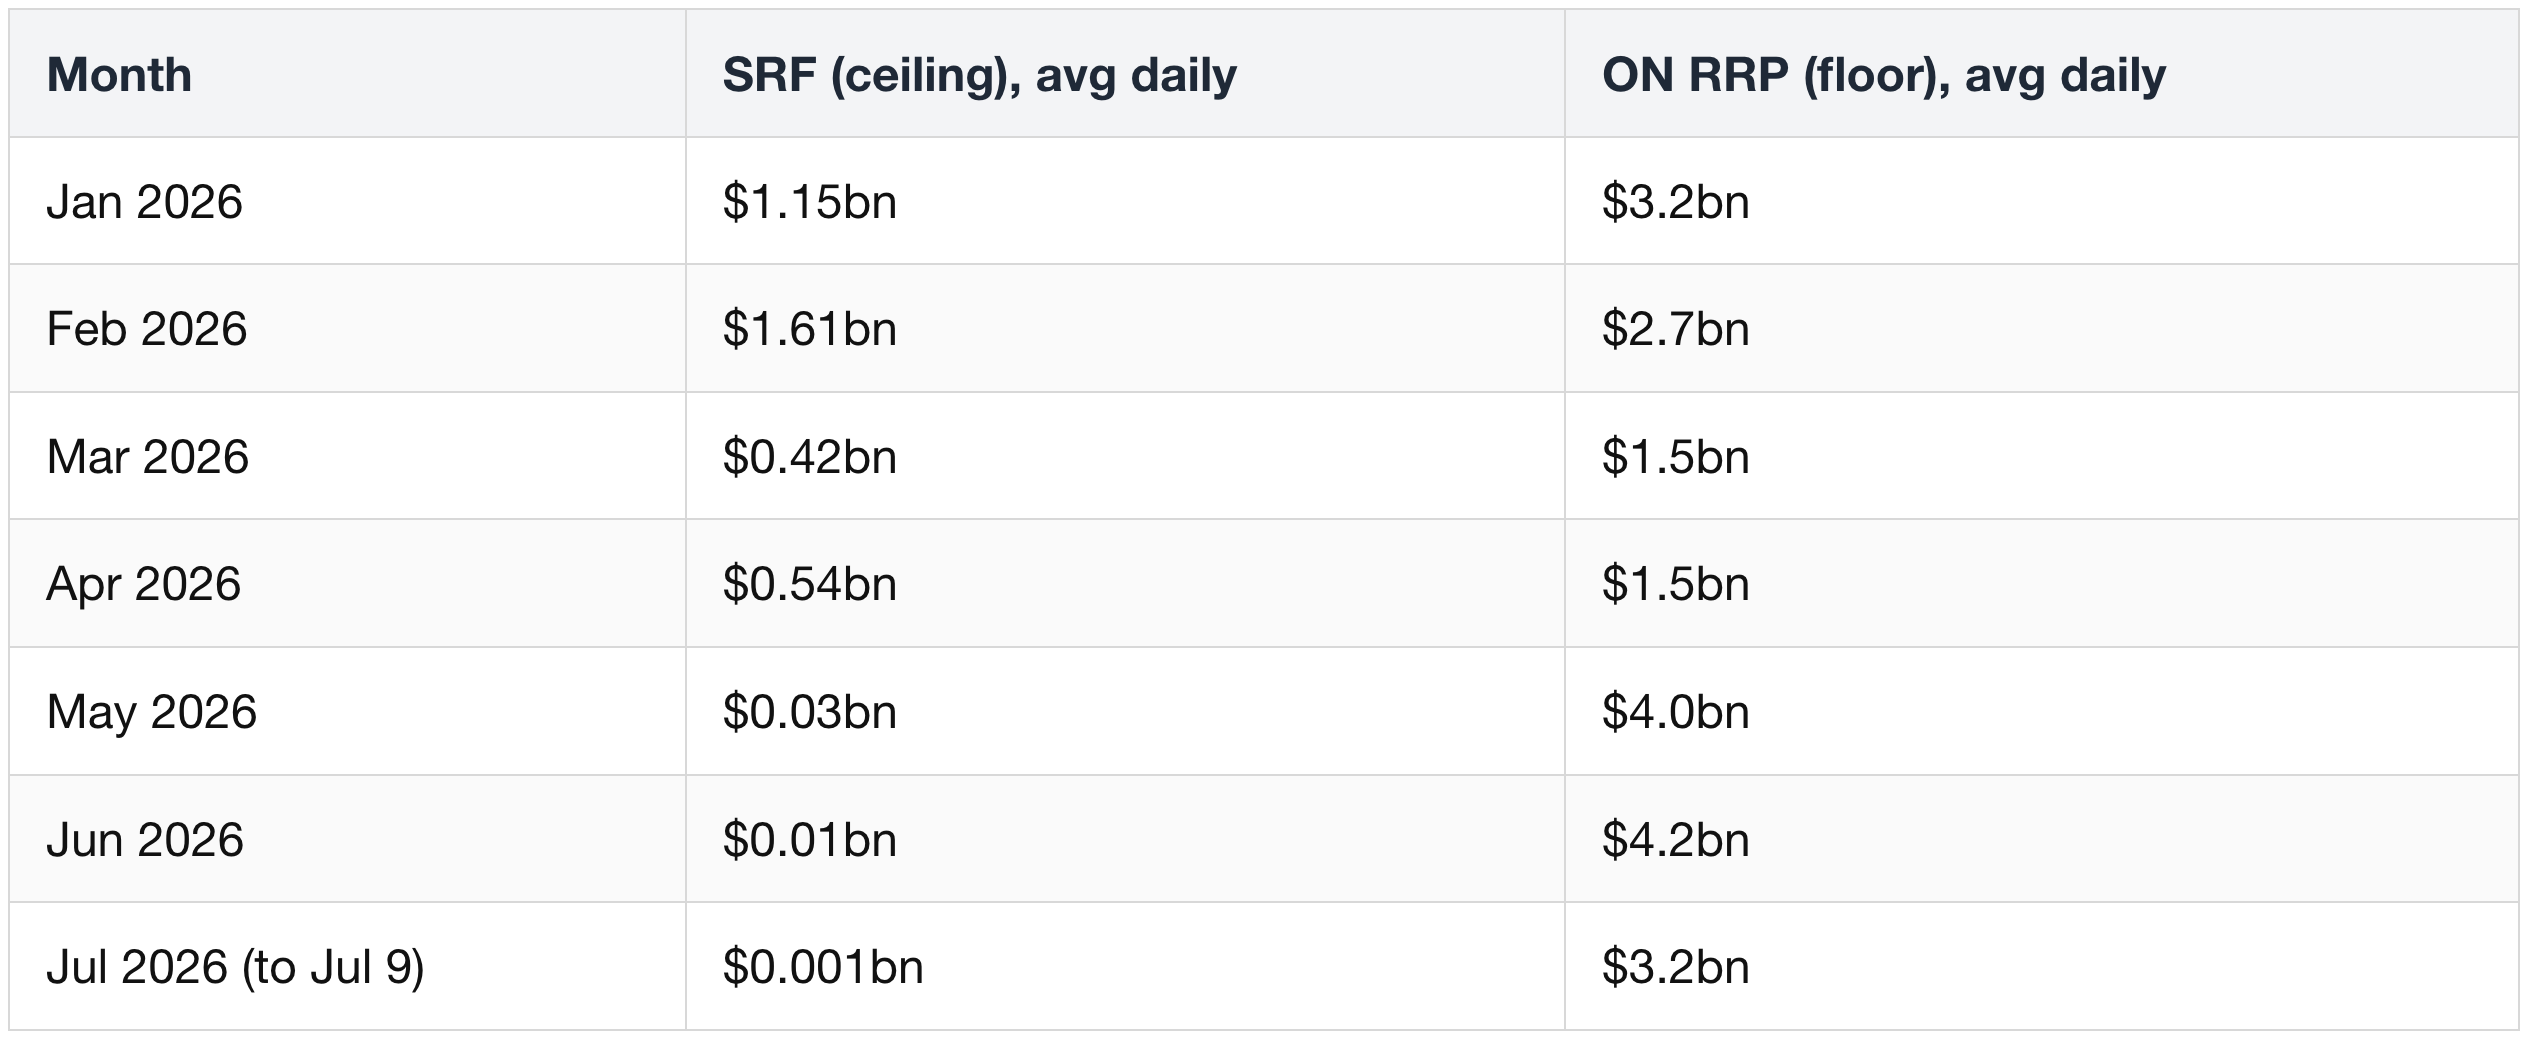

ON RRP balance is near empty.
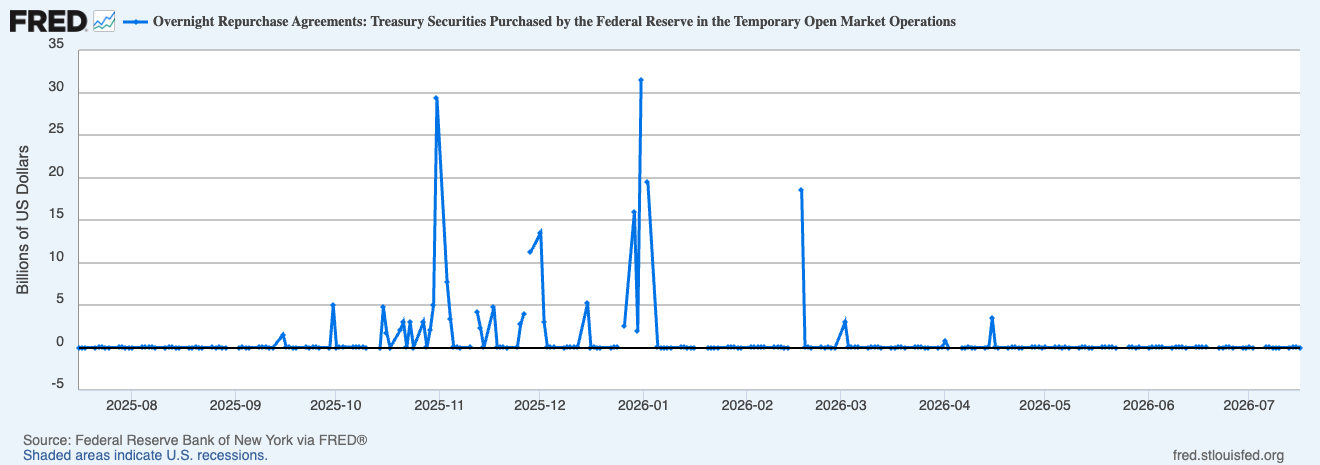
The SRF has drawn essentially nothing since May.
ON RRP has been drained to nothing over four years.
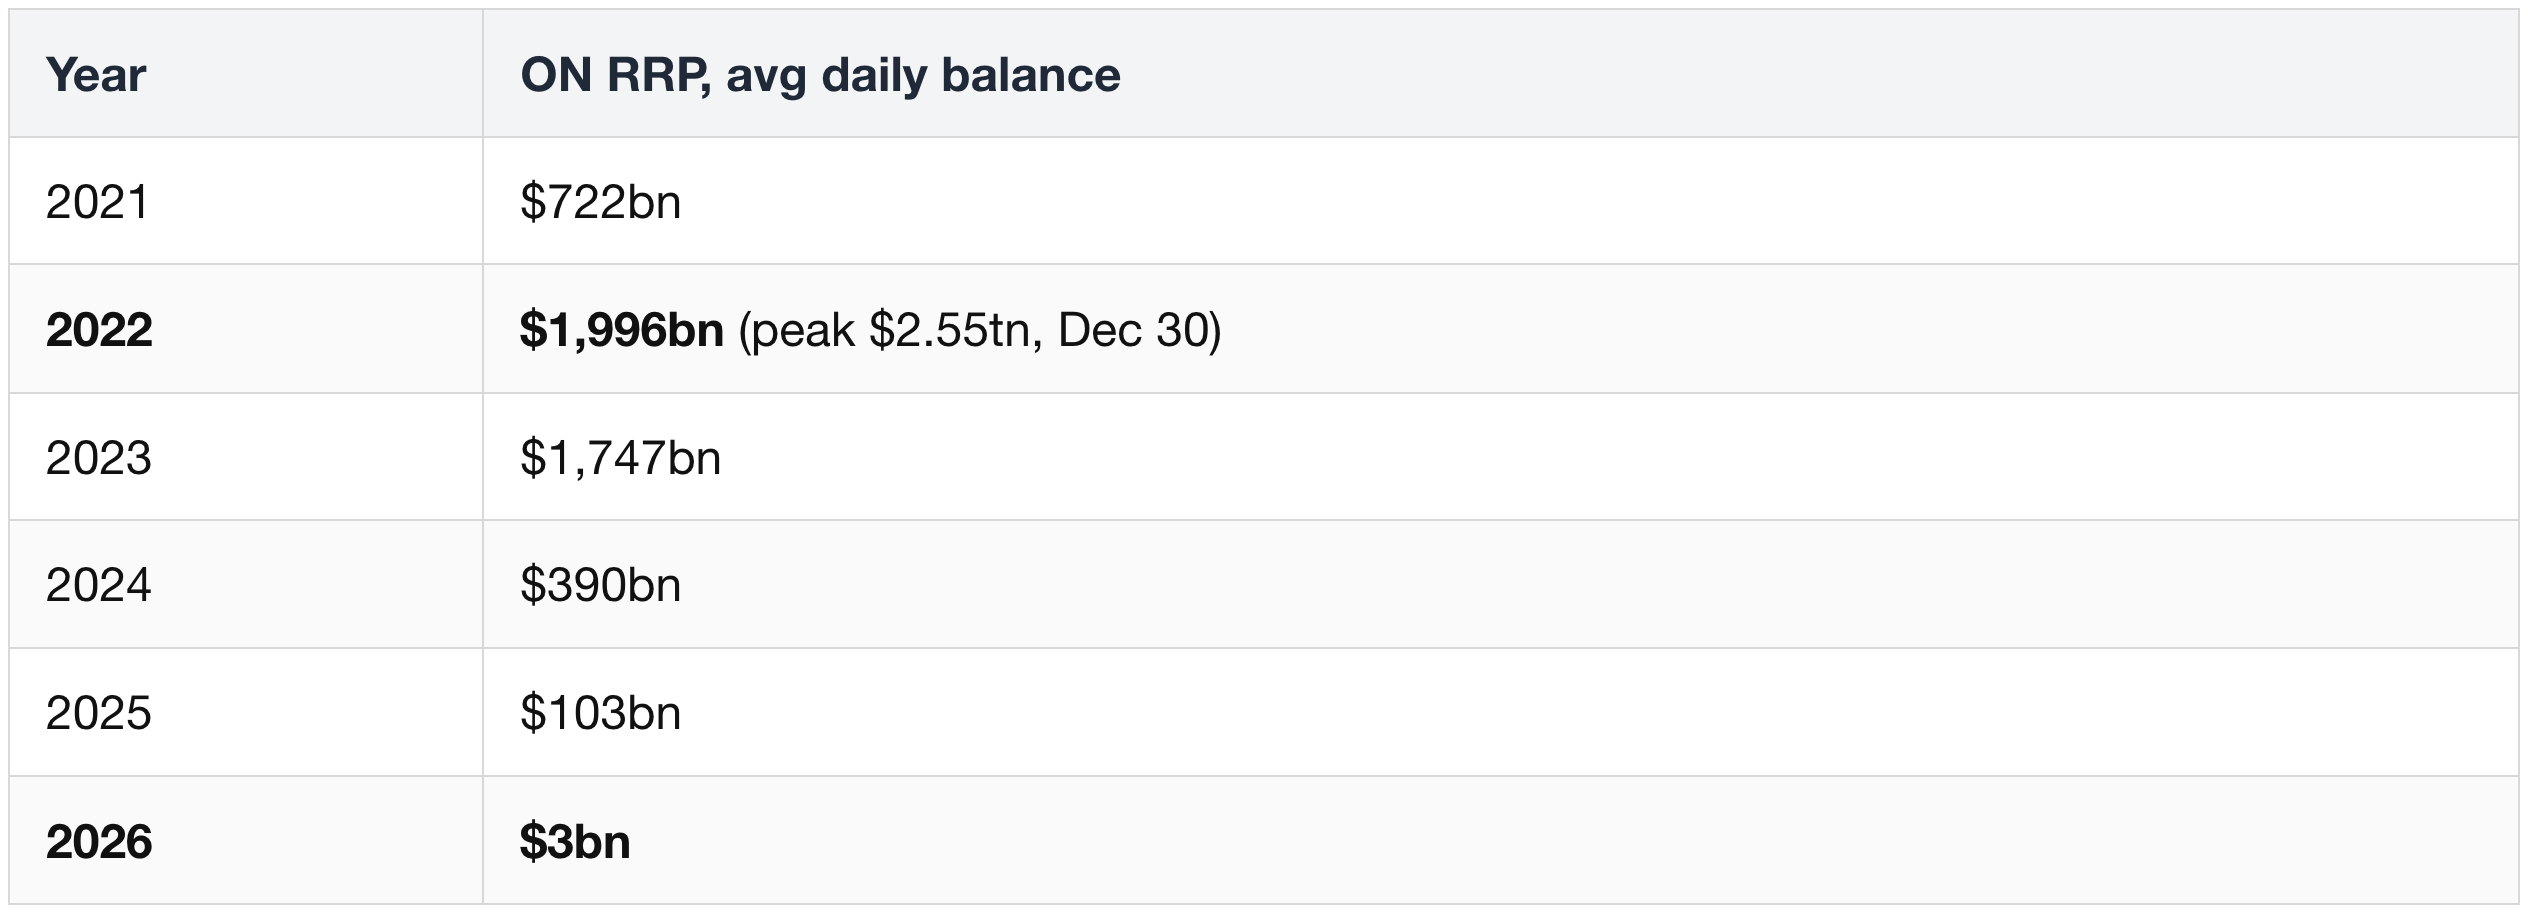
- The $2 trillion did not disappear. It left the facility looking for higher returns — Treasury bills, repo, and other risk assets.
- Money-market funds gave up a risk-free 3.50 percent for anything paying more.
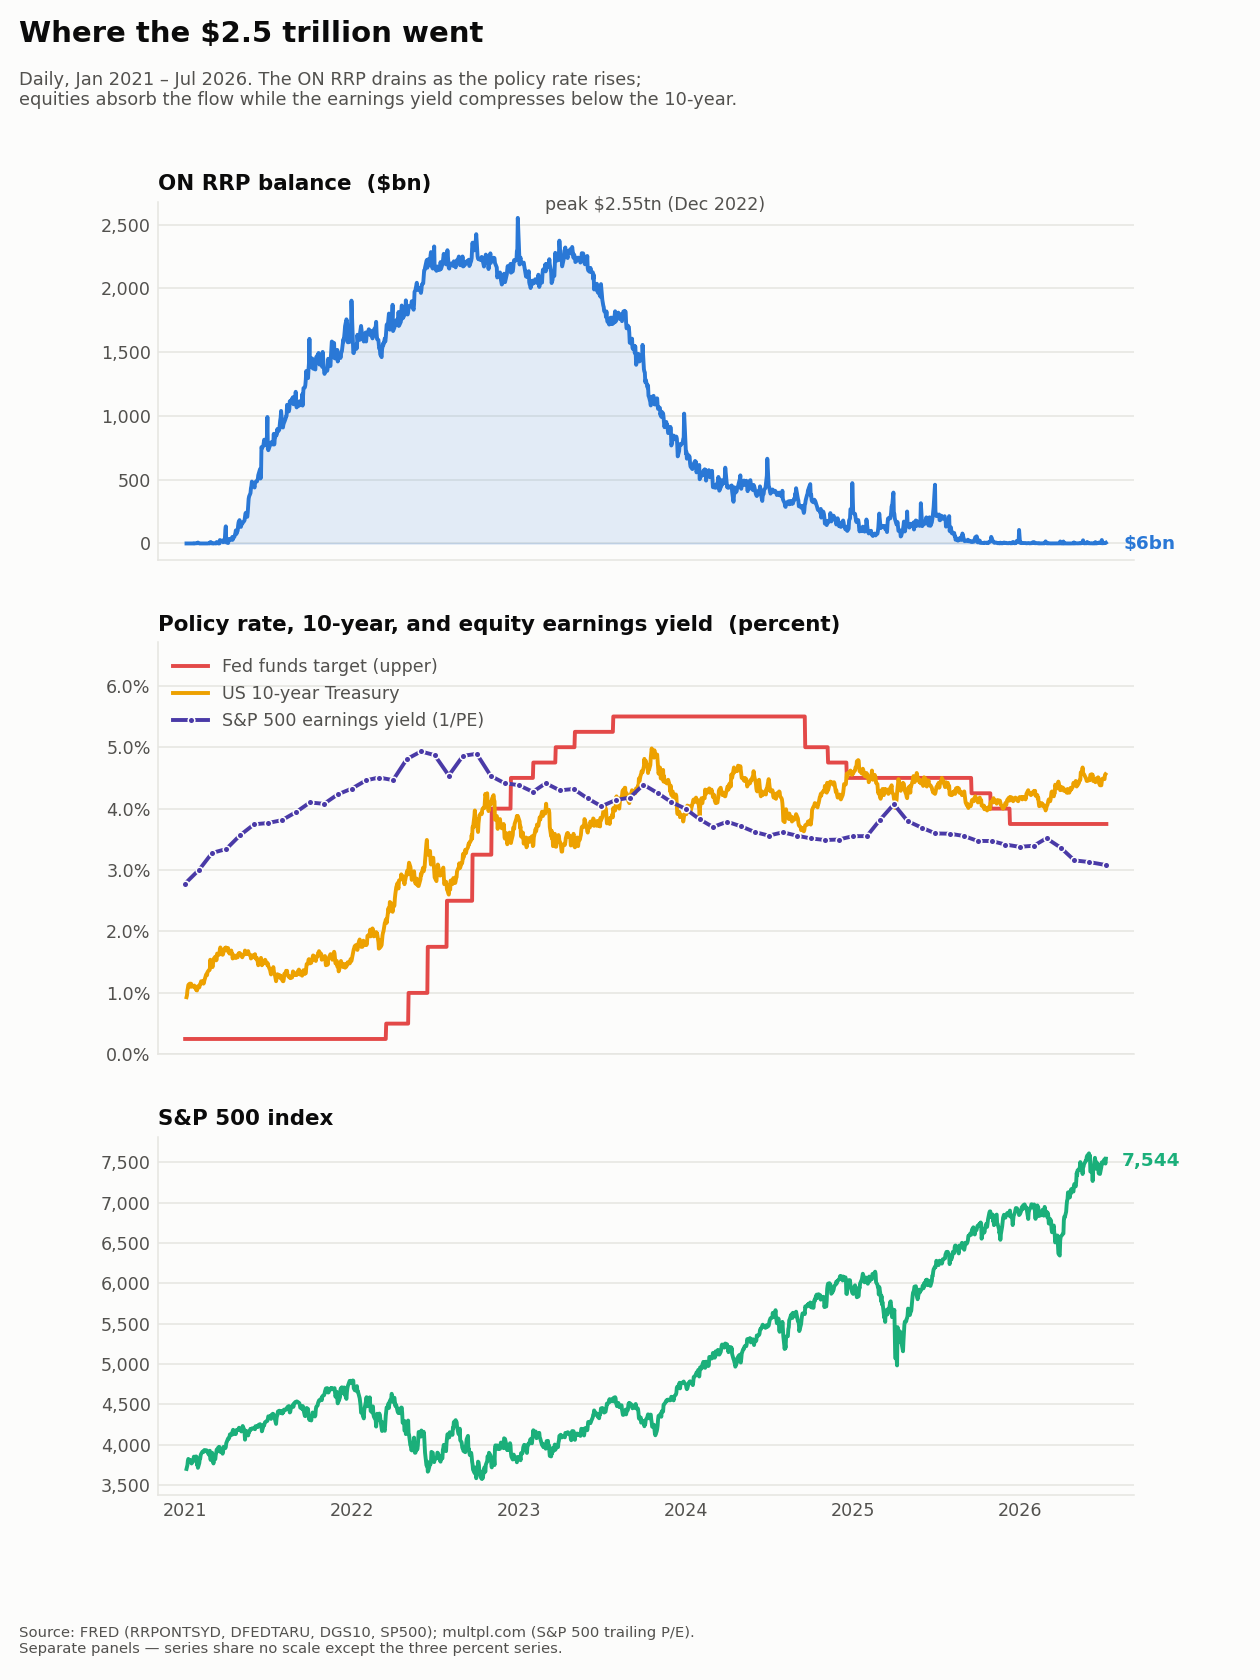
- ON RRP fills through 2021–22, peaks at $2.55tn (Dec 2022), drains steadily after.
- Over the same span the S&P 500 roughly doubles.
- The earnings yield — what an equity buyer is paid for the risk — falls 4.93% (Jun 2022) → 3.08%, crossing below the 10-year on the way.
- Equity risk premium (earnings yield − 10-year): +1.99 pp (mid-2022) → −1.48 pp today.
- Investors now accept 1.5 points less than the risk-free rate to own equities. Cash that sat at 3.50 percent risk-free is now in assets yielding 3.08 percent with full drawdown exposure.
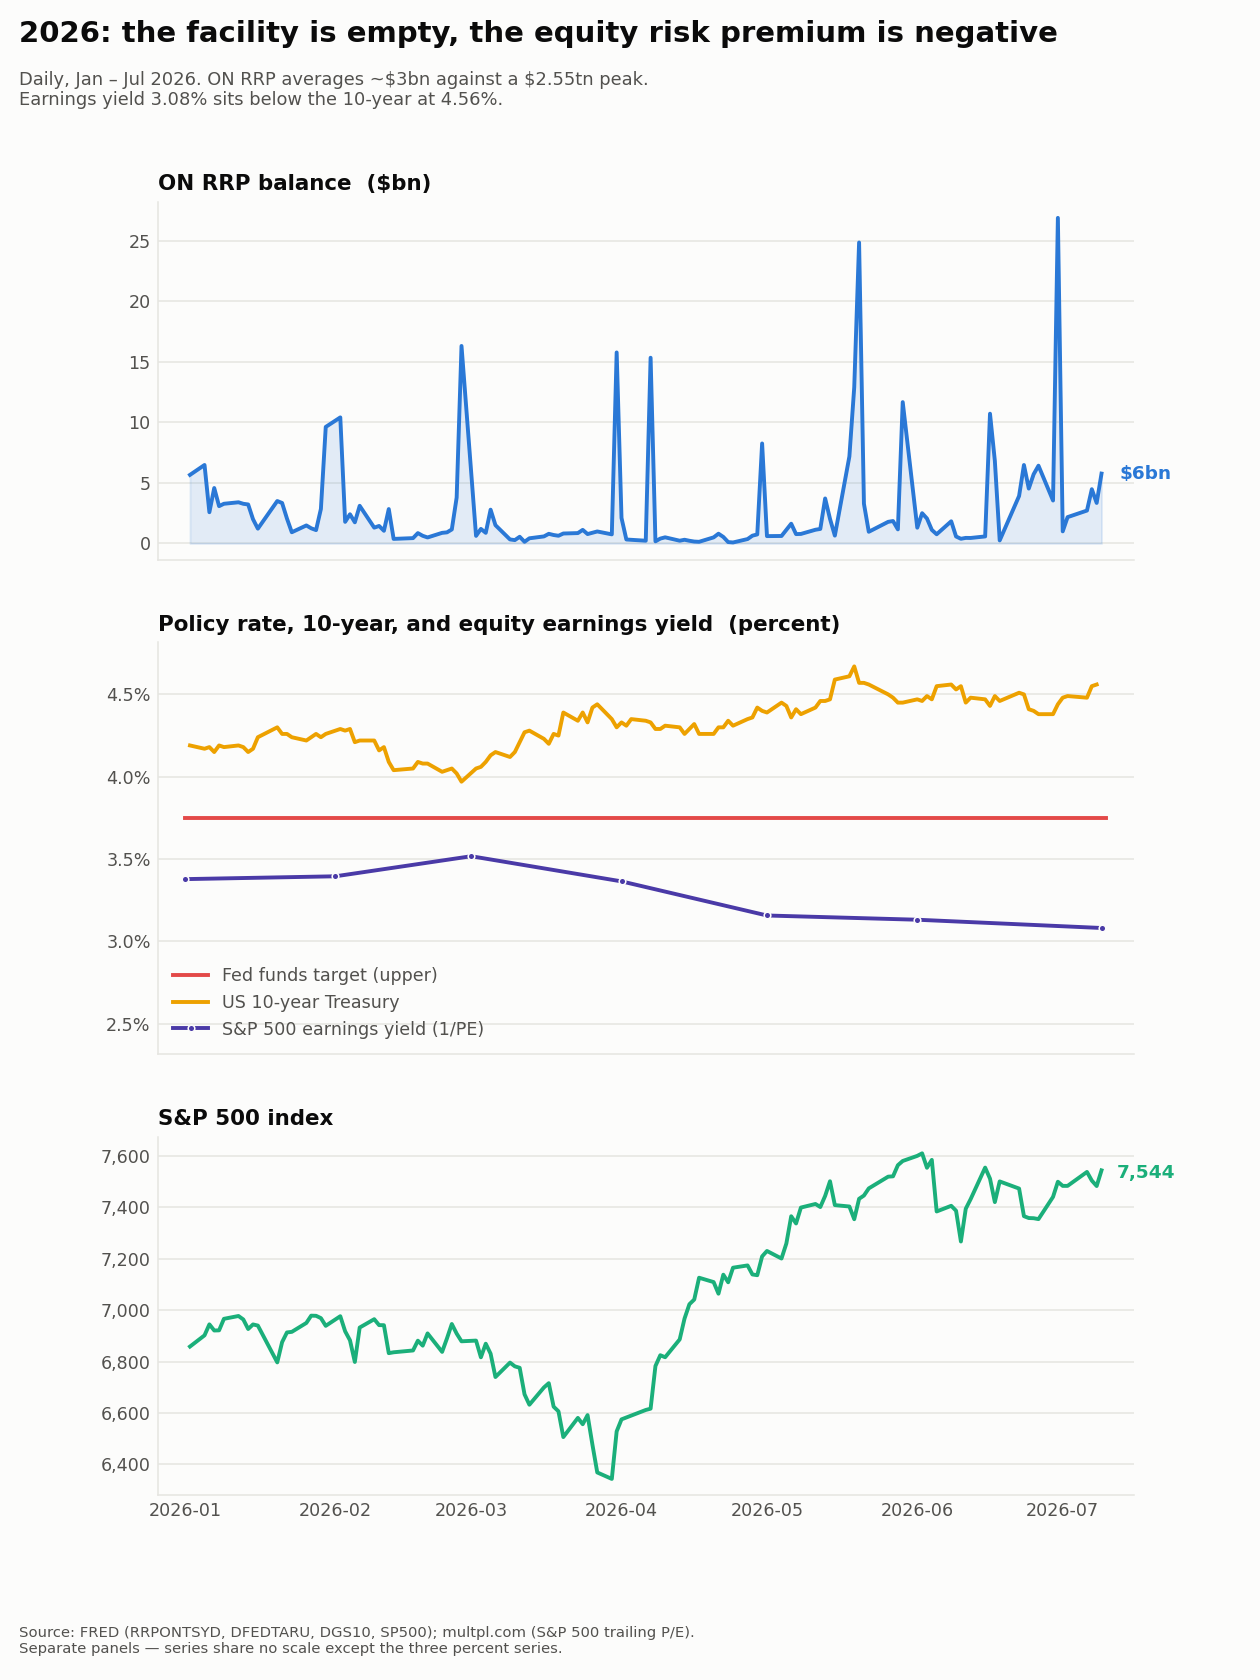
- 2026 ON RRP never clears $27bn on its best day; averages $3bn.
- 10-year climbs to 4.56%; earnings yield slides to 3.08%; S&P 500 makes new highs at 7,544.
- The gap between the two percent lines is the negative risk premium, widening.
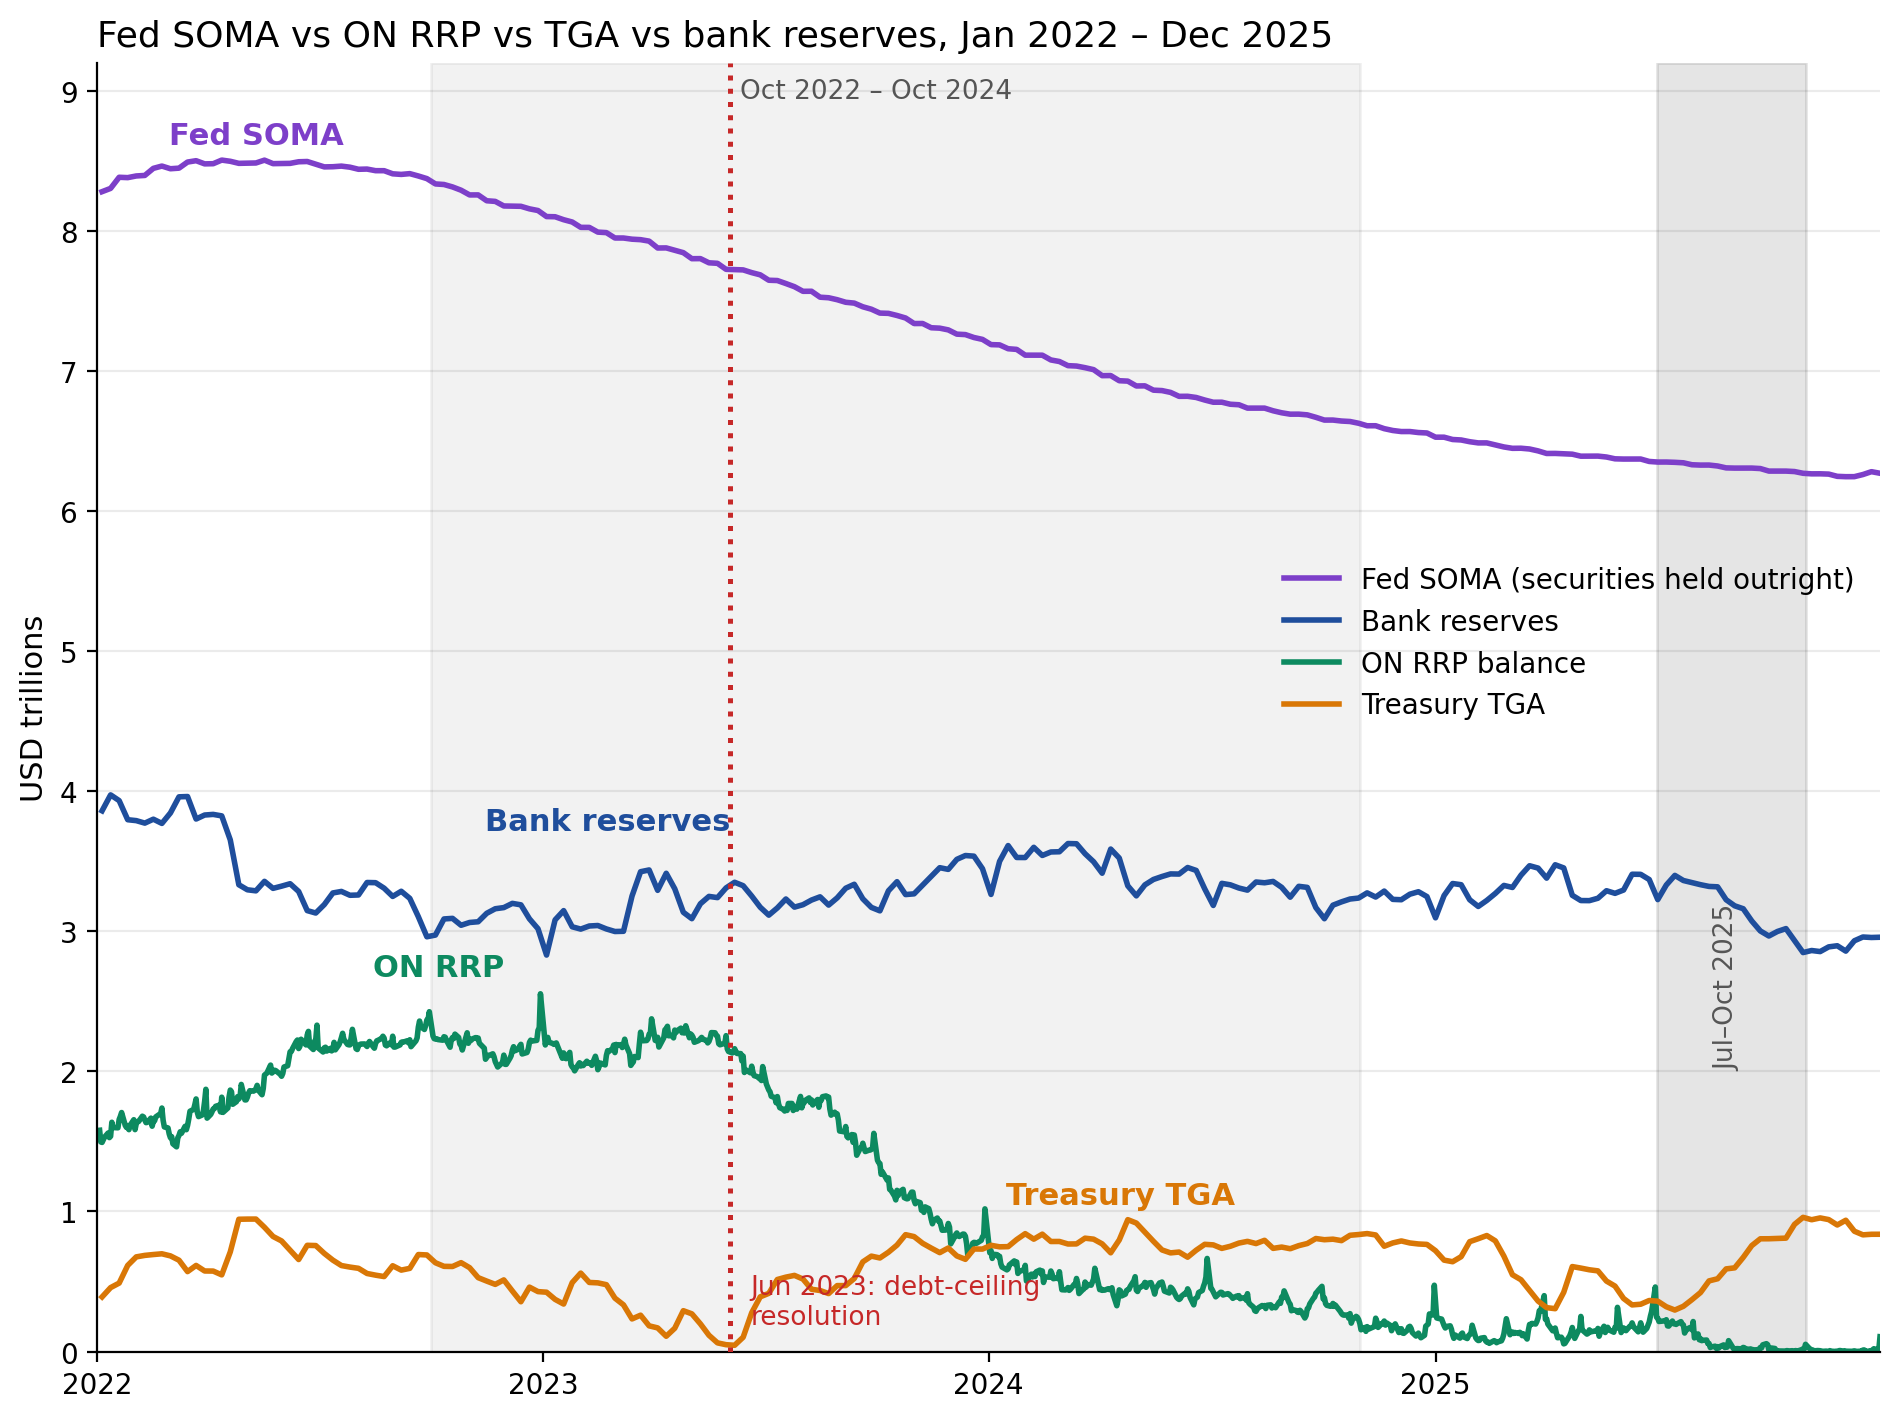
Two main consequences:
- The buffer is spent.
- Oct 2022 – Oct 2024 ↓↓ΔSOMA account = ↑Δreserves + ΔTreasury TGA + ↓↓Δreverse-repo accounts − Δlending facilities
- Bill supply was scarce from 2022 through H1 2023 — Treasury was paying down bills through 2022, then the debt ceiling capped net issuance from January 2023.
- With bill yields below the ON RRP rate, money funds parked at the facility even as QT ran. The facility grew toward its $2.55tn peak while reserves fell from roughly $4.2tn (late 2021) to $3.0tn (early 2023).
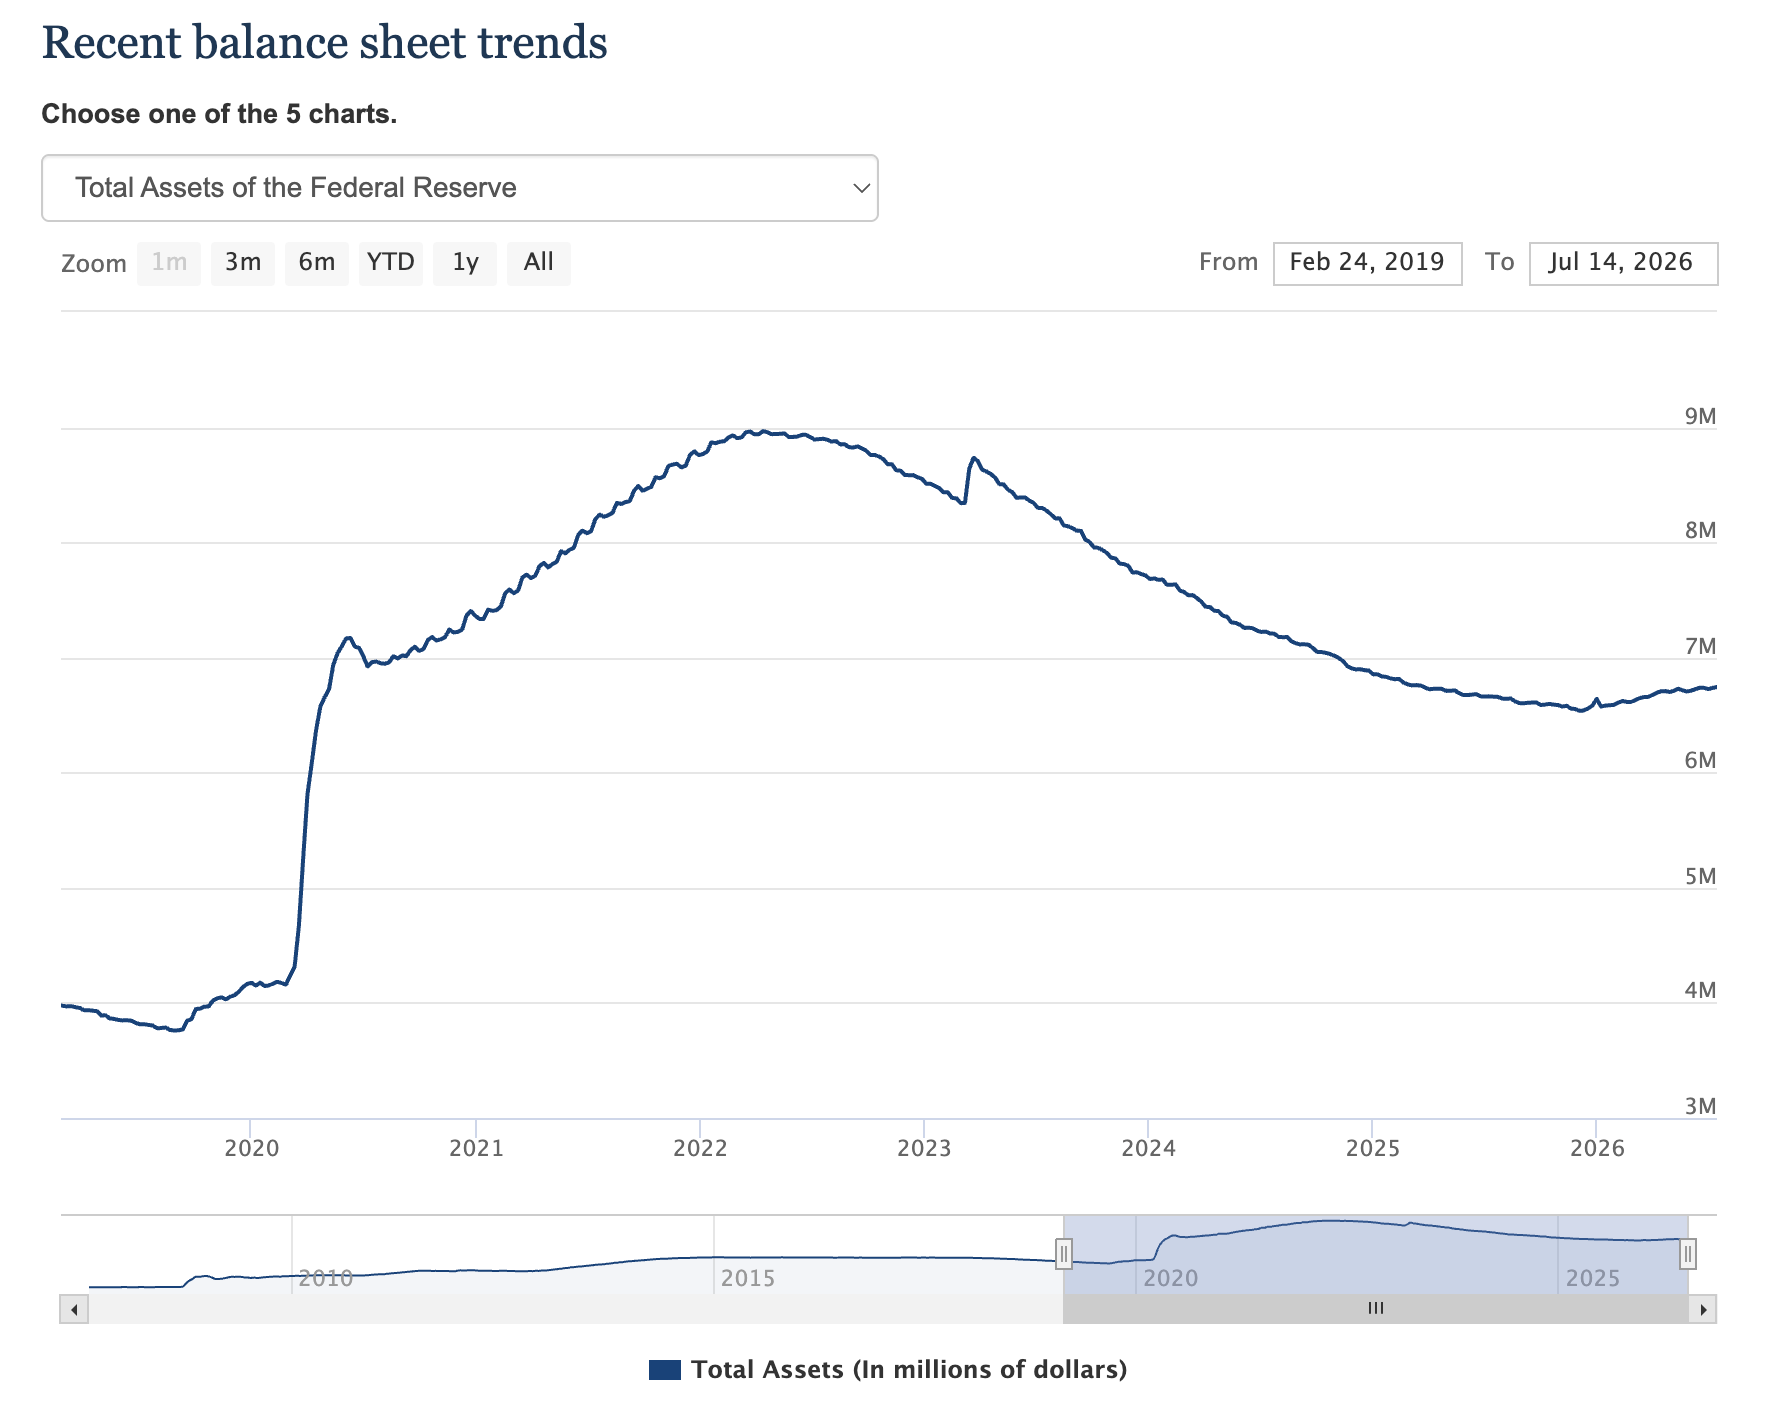
- Netting this phase against the post-Jun-2023 flip below gives the window's headline: the balance sheet shrank $1.7tn while bank reserves rose $142bn.
- From Jun 2023 ↑ΔTreasury TGA = ↓ΔSOMA account + Δlending facilities − Δreserves − ↓↓Δreverse-repo accounts
- The dynamic flipped with the June 2023 debt-ceiling resolution: Treasury's bill deluge pulled money funds out of the facility.
- From then on the ON RRP drain funded the new bills and absorbed the ongoing runoff, while reserves stabilized and climbed back toward $3.5tn.
- Jul – Oct 2025 ↓Δreserves = ΔSOMA account + Δlending facilities − ↑ΔTreasury TGA − ↓Δreverse-repo accounts
- The moment the buffer emptied, the regime flipped again: ON RRP drained from $197bn to $11bn — and reserves dropped $380bn in one quarter.
- With the facility at $3bn, any further drain — runoff, a TGA rebuild, currency growth — now lands on reserves one-for-one.
- Oct 2022 – Oct 2024 ↓↓ΔSOMA account = ↑Δreserves + ΔTreasury TGA + ↓↓Δreverse-repo accounts − Δlending facilities
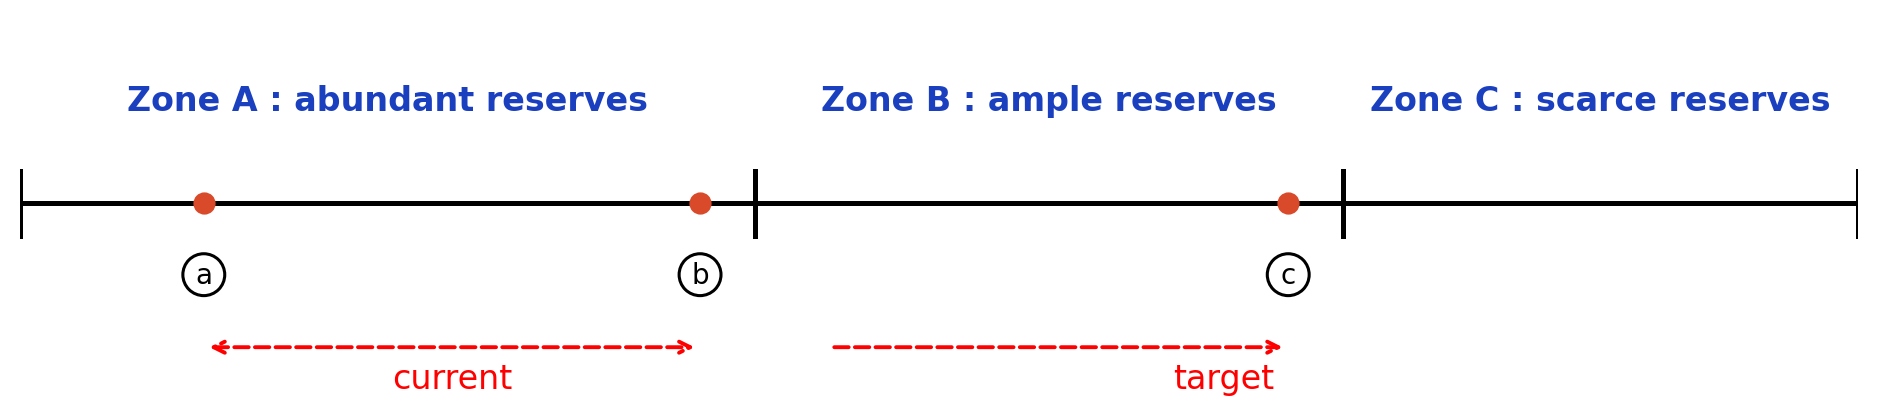
- "Ample" is a statement about today.
- Reserves at $3.14tn look comfortable precisely because $2tn migrated out of ON RRP and into the system.
- Scarcity is not a preordained path — RMP is the device built to prevent it, and the balance sheet is edging up again.
- But staying ample now depends on the Fed calibrating those purchases correctly. The $2tn pool of slack that absorbed any miscalibration for free is no longer there.
6.3 The verdict
"The manager noted that, these developments notwithstanding, the level of reserves in the system appeared to remain within a range consistent with an ample supply."
Reserves stood at $3,137bn on July 8 — about 9.8 percent of GDP.
- No balance-sheet decision was taken;
- the Committee reaffirmed ample reserves and left the machinery unchanged: SRF at 3.75 percent (ceiling), ON RRP at 3.50 percent (floor), continued bill purchases, full reinvestment.
The points to watch from here:
- ON RRP take-up rose when repo rates fell — the floor working as designed under ample reserves. As SOFR approaches the ON RRP rate at the very bottom of the target range, money funds' excess liquidity can move to the (relatively higher) ON RRP rate rather than lend at SOFR, blocking any further fall in SOFR.
- That system, though, rests on the Fed calibrating RMP correctly. With the buffer (the ON RRP balance) gone, whether the same machinery works when reserves turn scarce is untested.
- SOFR below IORB is the norm. With reserves ample, cash competes for collateral and repo prints under the rate banks earn on reserves. The stress signal is the inverse — SOFR pushing above IORB, as in September 2019, which says cash has become scarce relative to collateral. That SOFR has sat below IORB for two straight months is evidence reserves are still comfortable.
- The live question is therefore not the level of SOFR but how much room is left below it. The ON RRP buffer that absorbed the runoff since mid-2023 is spent; the next drain lands on reserves directly, and SOFR would begin closing on IORB from beneath. A break above IORB, as in 2019, would then be the signal that cash has turned scarce relative to collateral.
7. Assessment
7.1 Inflation
- The staff called inflation a salient risk even as the energy shock that caused it was already fading.
- Some of the inflation is not from tariffs and not from energy. The Committee cannot say what is causing it, so it cannot say when it will stop.
- Core PCE has risen every month since bottoming in February, even though housing costs — normally the part that pulls inflation down — were falling the whole time.
- The four rising categories (transportation, airfares, petrochemicals, farm inputs) might just be the energy shock arriving late (Reading A), or might be broad demand (Reading B). The minutes alone cannot tell which.
7.2 AI
- Every way AI pushes inflation up is happening now, and most participants agree on it (Most 6/6, Many 4/6).
- AI's deflationary effect arrives on a lag, and only some participants cite it (Some 2/6).
- AI raises demand today. The productivity that would lower prices comes later, in an amount and on a date nobody will estimate.
- This is why the Committee holds two opposite scenarios at once — it cannot tell which effect wins, or when.
7.3 Labor
- The Committee judged that downside risks to maximum employment had moderated. It said this using April and May payroll numbers that were later revised down by a combined 74,000 jobs.
- It said this sixteen days before a report showing prime-age workers (25–54) left the workforce at the fastest rate since April 2020 (−0.6 pp).
- Prime-age employment fell 688,000 while employment of those 55 and over rose 172,000. So this is not people retiring.
- Unemployment fell to 4.2% only because people left the workforce faster than they lost jobs. Had they stayed, it would have been 4.6%.
- A minority of participants (Several 3/6) had warned that it was getting harder to find a job. They were right.
- The best explanation is that people stopped looking for work because they could not find it — but the June data does not confirm it: the "gave up looking" and "want a job" counts both fell, and the drop is too small to be statistically certain.
- One more month of the same distribution (the July report, out August 7) turns the hypothesis into a trend.
7.4 Reserves
- SOFR fell toward the Fed's floor, and the ON RRP facility took in the spare cash and held that floor.
- Bank reserves are still ample, about $3.14 trillion, roughly 9.8% of GDP.
- The Fed's own bill purchases (RMP) are part of why SOFR fell: they add cash and take away collateral at the same time.
- The problem has reversed since 2019. Then there were too few reserves; now there are so many that rates fall below the floor.
- The Fed made no change to the balance sheet, and did not need to.
- But the ON RRP buffer that absorbed the runoff since mid-2023 is spent. The next drain lands on reserves one-for-one, and staying "ample" now rests on the Fed calibrating RMP correctly.
7.5 Bottom line
- The Committee dropped its bias toward cutting, one participant wanted to hike (A few 1/6), and the rest were evenly split on where rates should be at year-end.
- The Committee shifted its focus from jobs to inflation — and the jobs report released after the June meeting undercut the reason for shifting.
- If July also points to labor weakness, the Committee keeps its view that inflation is the danger — but of the two firming conditions, (1) a stable labor market & (2) elevated inflation, it can no longer claim condition (1).
- Core inflation is 3.4% and rising, AI spending is running the economy hot, and prime-age workers are leaving the labor force at the same time.
- The June minutes contain no plan for that combination: high inflation and a weakening job market together.