Neoclouds Breakdown
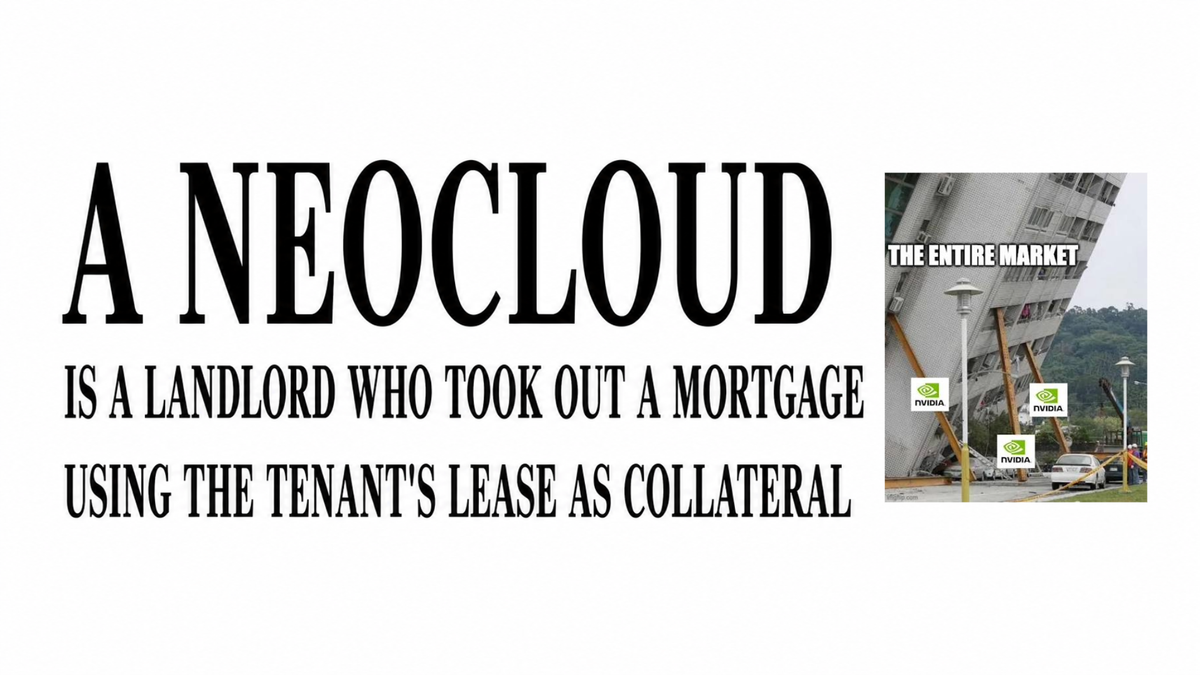
The master note on the neocloud landscape — why the business exists, who the players are, how they finance the fleet, what the compute deals prove, and why Nvidia keeps feeding the ecosystem.
1. Why Neoclouds?
(1) The structural gap they fill
- The CPU-cloud era was won on software: IaaS wrapped in hundreds of PaaS / SaaS services, customer lock-in, ecosystem depth.
- GPU clouds invert that. For bare-metal GPU service, even the virtualization layer stops mattering.
- The new success factors:
- (a) How much of the newest Nvidia silicon you can secure, on time.
- (b) How fast you can energize power and stand up high-efficiency clusters (PUE).
- (c) Cost of capital.
- Cloud competition became an infrastructure and capital game, not a software game.
- Demand side: Tier 1 AI Labs (OpenAI, Anthropic) run a CAPEX-to-OPEX strategy.
- They need GW-scale, single-tenant AI factories.
- But they push the balance-sheet risk onto someone else and pay for compute as a monthly operating cost.
- That someone else is the neocloud.
- Time-to-compute is the actual product. In a shortage, delivered-on-schedule compute commands a premium over any feature set.
(2) The AI infrastructure tier map
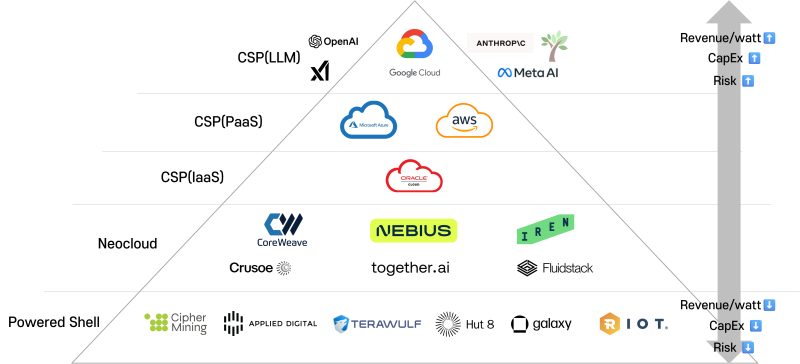
- Revenue per watt rises as you climb the stack; capex burden and execution risk rise with it.
- Money flows top-down — AI Labs' ARR growth is the TAM for everything below.
- Powered Shell (Cipher, Applied Digital, TeraWulf, Hut 8...): space + power at ~$1M per MW, 10–15 year contracts.
- Neoclouds (CoreWeave, Nebius, IREN, Crusoe, Together, Fluidstack): own the compute, sell at ~$10M per MW, 5–6 year contracts.
- Tenors deliberately matched to GPU economic life.
- ARR steps up with each GPU generation instead of drifting with escalators.
- Hyperscalers sit above as customers and competitors.
- Microsoft is simultaneously CoreWeave's largest customer, Nebius' anchor tenant, and IREN's anchor tenant.
- Google rents SpaceX capacity as explicit "bridge capacity."
- Renting from a neocloud is faster than building, and keeps the capex off their own P&L cadence.
(3) Unit economics — is the business real?
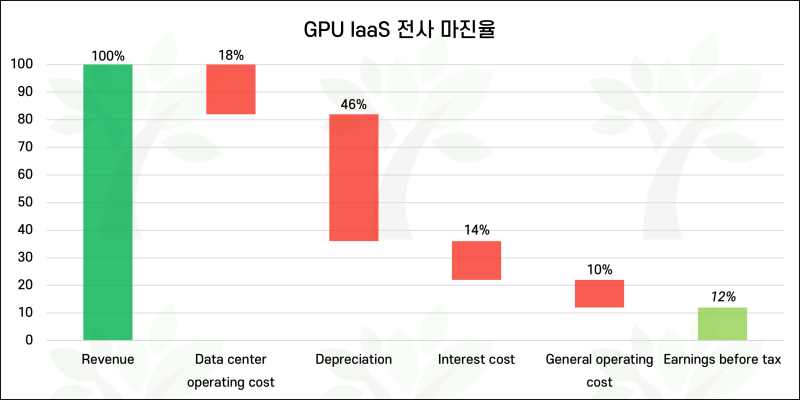
- The cleanest disclosed P&L template: IREN's Microsoft deal guidance (CY 3Q25 call, 2025-11-07).
- Revenue 100% → data-center opex −18% → depreciation −46% → interest −14% → G&A −10% → ~12% EBT per data center.
- Morgan Stanley models ~15% FCF margin per DC.
- Unlevered IRR (Internal Rate of Return) low-teens on a zero-residual-value assumption,
- Levered IRR 25–30% at ~$2.5B debt,
- 35–50% if GPU residual value is 20% instead of zero.
- Depreciation is the entire swing factor.
- The same contract moves from ~10% to ~20–25% contribution margin depending on whether a 5-year-old GPU is worth 0% or 20% of cost.
- Hence §2 (5) tracks each company's depreciation policy explicitly.
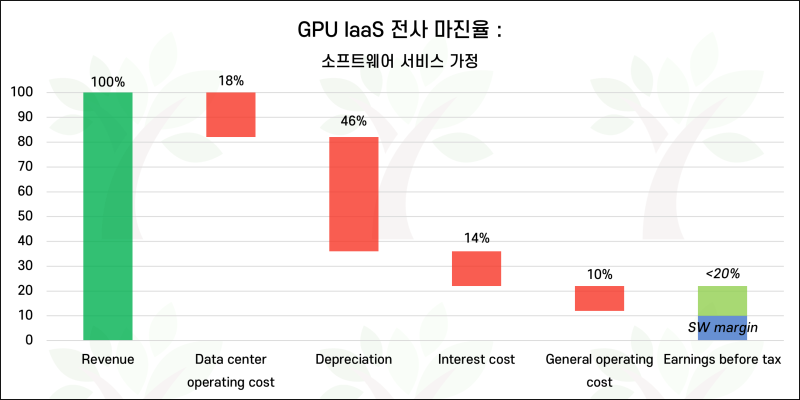
- The long-term bull case stacks software on top: ~80% contribution-margin PaaS / SaaS revenue lifting company OPM from ~12% to high-teens / 20%+.
- CoreWeave: W&B, OpenPipe, Monolith, Marimo acquisitions; storage / software / CPU / networking each crossing $100M ARR by end-2026.
- Nebius: Token Factory, Tavily, Eigen AI, Clarifai.
- Both are running the 2010s-cloud playbook — infrastructure first, stack later.
- For how this translates into value — the capitalized spread (ROIC − WACC) on all deployable capital, the two-stage runway model, the NBIS vs CRWV comparison — see the Valuation section below.
2. The Players
(1) Landscape snapshot (mid-2026)
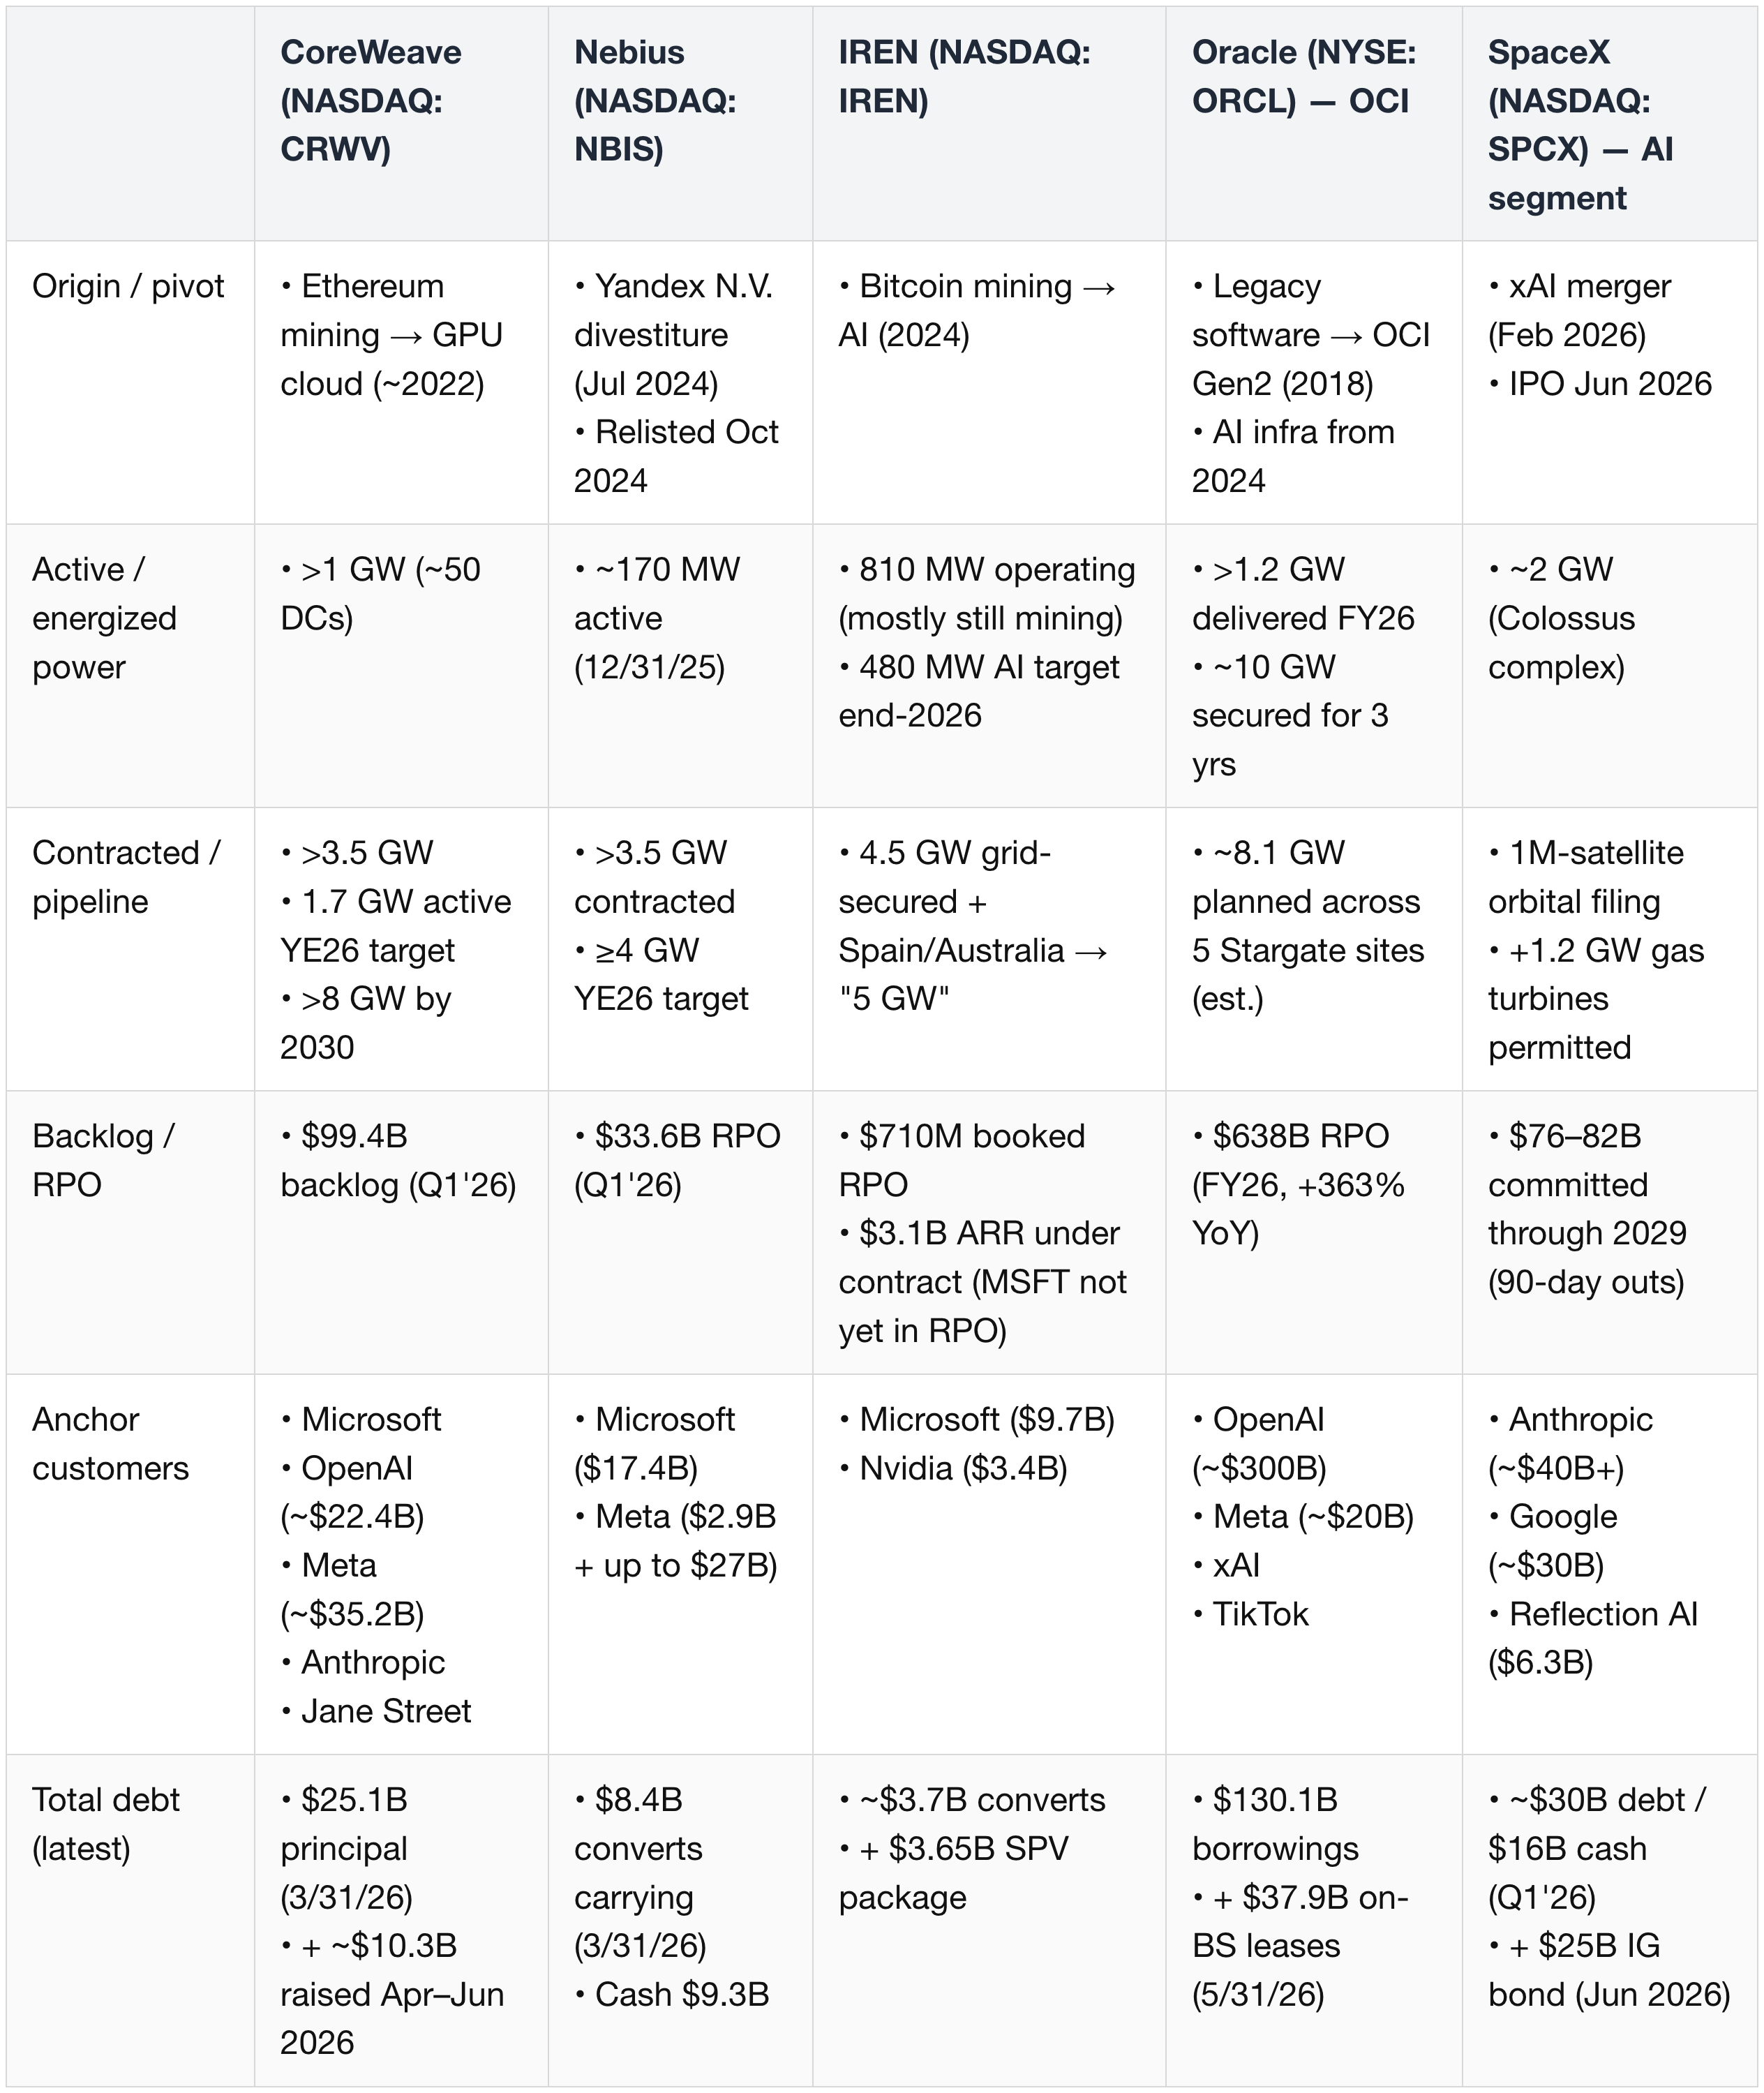
(2) Compute & power ledger — per company
CoreWeave
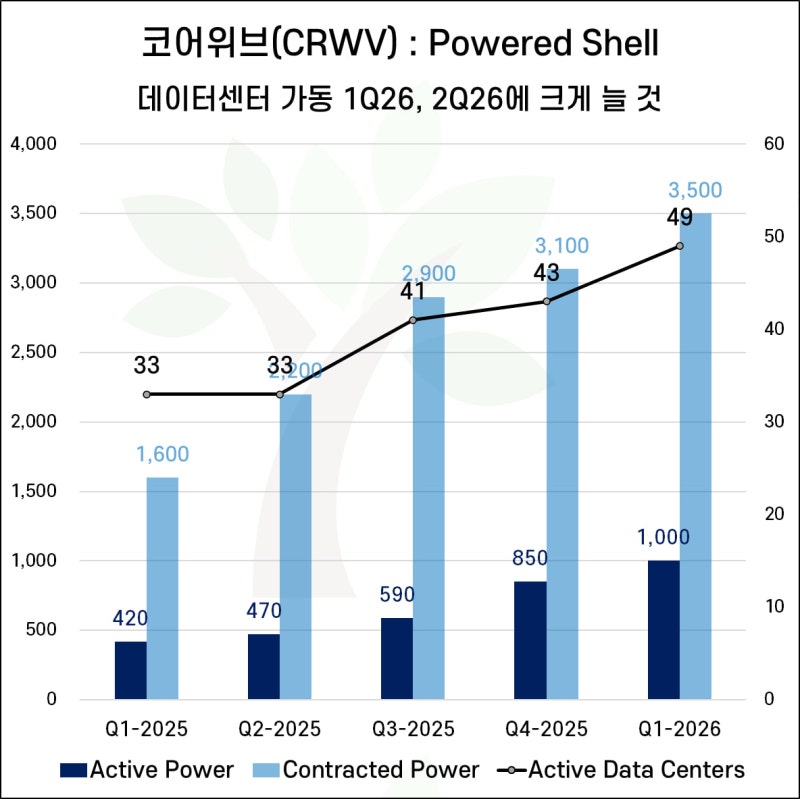
- Active power: ~70 MW (2023) → ~360 MW (2024) → >850 MW (2025) → >1 GW (3/31/26), across ~50 data centers.
- Contracted power:
- ~1.3 GW (2024) → 3.1 GW (2025) → >3.5 GW (CY 1Q26)
- substantial majority online by end-2027
- ~1.4 GW contracted but not yet allocated to a customer
- Targets:
- ≥1.7 GW active YE26
- more than 8 GW by 2030
- Nvidia partnership to accelerate >5 GW of AI factories by 2030 (Jan 2026)
- GPU fleet — units no longer disclosed post-IPO:
- Last official count >250,000 GPUs across 32 DCs (12/31/24 S-1); ~600,000 at end-2025 per estimate (The Next Platform, Apr 2026).
- GB200: >50,000 to a single customer (CY 4Q25 call); first GB300 NVL72 cloud deployment Jul 2025 (Dell).
- VR200: world-first NVL72 rack delivered 2026-05-31, validated in <6.5 hours; scale integration 2H CY26; Meta's $21B expansion includes initial Vera Rubin.
- 100% Nvidia — customer contracts specify Nvidia GPUs (10-K).
- Old-gen defense:
- A100 / H100 / H200 / L40S average pricing all rose QoQ in CY 1Q26
- 10,000+ H100 contracts re-signed within 5% of prior terms two quarters before expiry (CY 3Q25 call)
How the sites sum to the online GW — for CoreWeave, they mostly don't, by design.
- Owns almost no real estate: it leases powered shells and installs GPUs, so per-site energized MW is undisclosed.
- CoreWeave does not itemize its ~50 leased shells — the sites listed below are only the ones the company has publicly mentioned (named for headline investment size or a public developer/tenant partner), not a full or representative inventory of where the online GW sits.
- Nearly all of them are forward capacity (ramping or 2027+ online), not current energized power.
- So the named sites reconcile where the contracted 3.5 GW book lands next, not the online GW — which sits almost entirely in the ~50 undisclosed shells.
The company-mentioned sites:
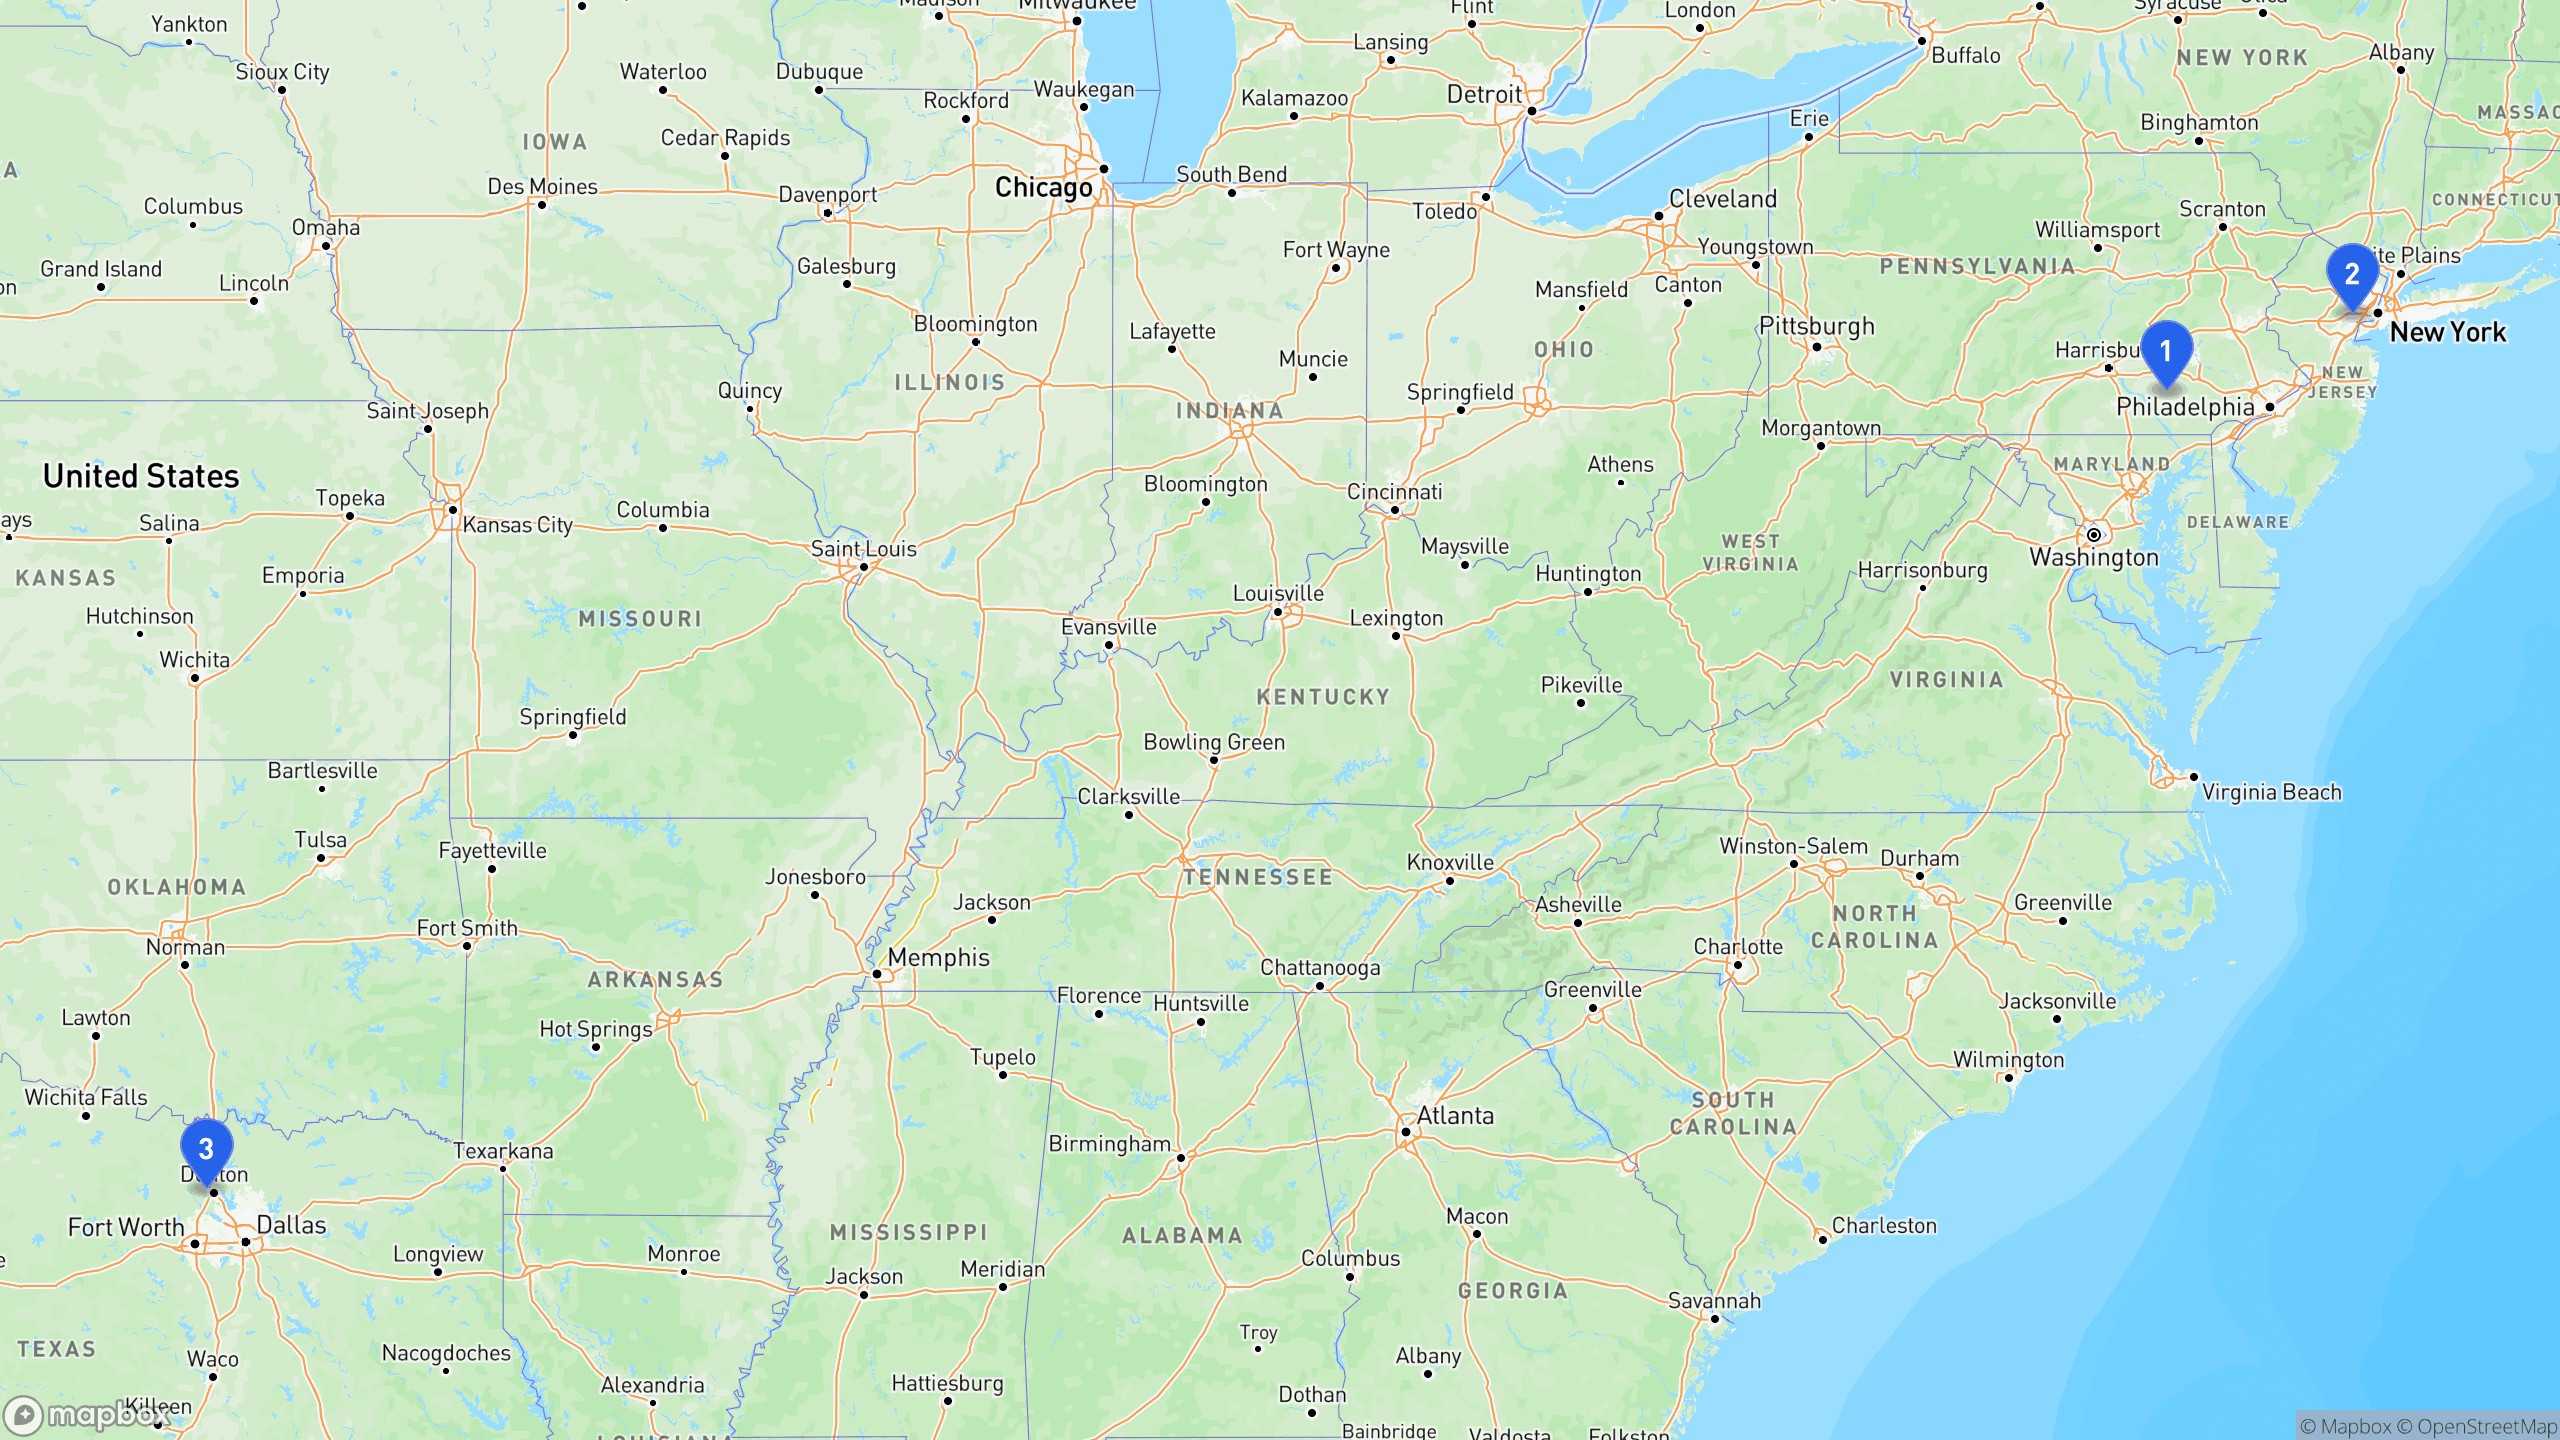
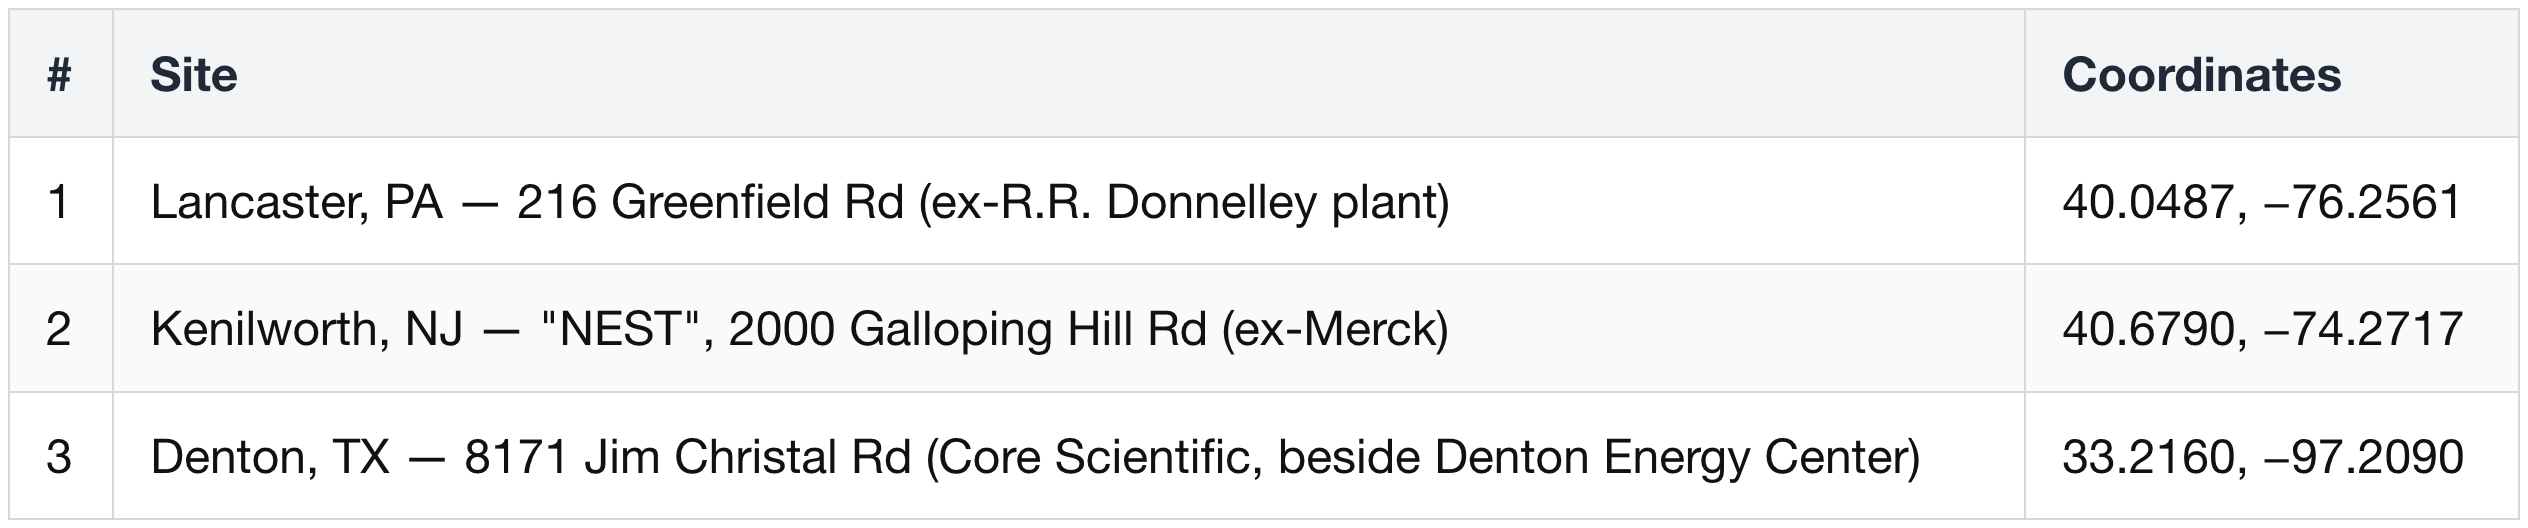
- Company-mentioned sites only — the ~50 leased shells that carry the online GW are undisclosed.
- Coordinates are site-level (verified street addresses via datacentermap / local filings).
- Lancaster has a second parcel: 1375 Harrisburg Pike (40.0582, −76.3330).
Lancaster, PA
- Partners: sole-tenant lease (developer undisclosed).
- Capacity: 100 MW → 300 MW.
- Investment: up to $6B; announced Jul 2025.
- Status: pipeline — no energized date disclosed, so it sits in the contracted 3.5 GW, not the online >1 GW.
Kenilworth, NJ — "NEST" (ex-Merck campus)
- Partners: conversion of a former Merck R&D campus.
- Investment: ~$1.8B.
- Online: early 2027.
Denton, TX
- Partners: Core Scientific — CoreWeave is the HPC tenant.
- Note: CRWV's $9B all-stock bid for Core Scientific was rejected by CORZ shareholders Oct 30, 2025 and terminated; CRWV stays a tenant, incl. the $1.2B Denton expansion. The ~1.3 GW CORZ portfolio never entered CRWV's own power totals.
Self-build & pipeline
- First CoreWeave self-built site expected online later in 2026 — a step away from pure leasing.
- Project Horizon (Poolside JV, 2 GW West Texas) was mutually terminated April 2026; CRWV cited DDTL 4.0 flexibility.
- Third-party developer delays have periodically pushed CRWV deliveries (CY 3Q25 call).
Nebius
- Active power: ~170 MW (12/31/25).
- Contracted power:
- 2 GW (Feb 2026) → >3.5 GW (May 2026)
- targets ≥4 GW contracted and 800 MW–1 GW connected by YE26
- >75% of contracted power owned, not colo (colocation).
- GPU fleet — no aggregate count disclosed (flag):
- Spans GB300 NVL72 / GB200 NVL72 / HGX B300 / B200 / H200 / H100.
- Nvidia Exemplar Cloud status on GB300 training.
- Among the first Nvidia Cloud Partners to offer VR200 NVL72 in the US and Europe from 2H CY26 (CES, 2026-01-06).
- VR200 priority is the revenue-density edge: NBIS ~$1,160M vs IREN ~$970M ARR per 100 MW on their respective Microsoft deals — a ~20% premium for the newer chip.
How the sites sum to the online power — Nebius is traceable, unlike CoreWeave.
- It owns >75% of its contracted power and discloses each site's nameplate + delivery tranches, so the ~170 MW online (12/31/25) maps to named live sites rather than an opaque shell pool.
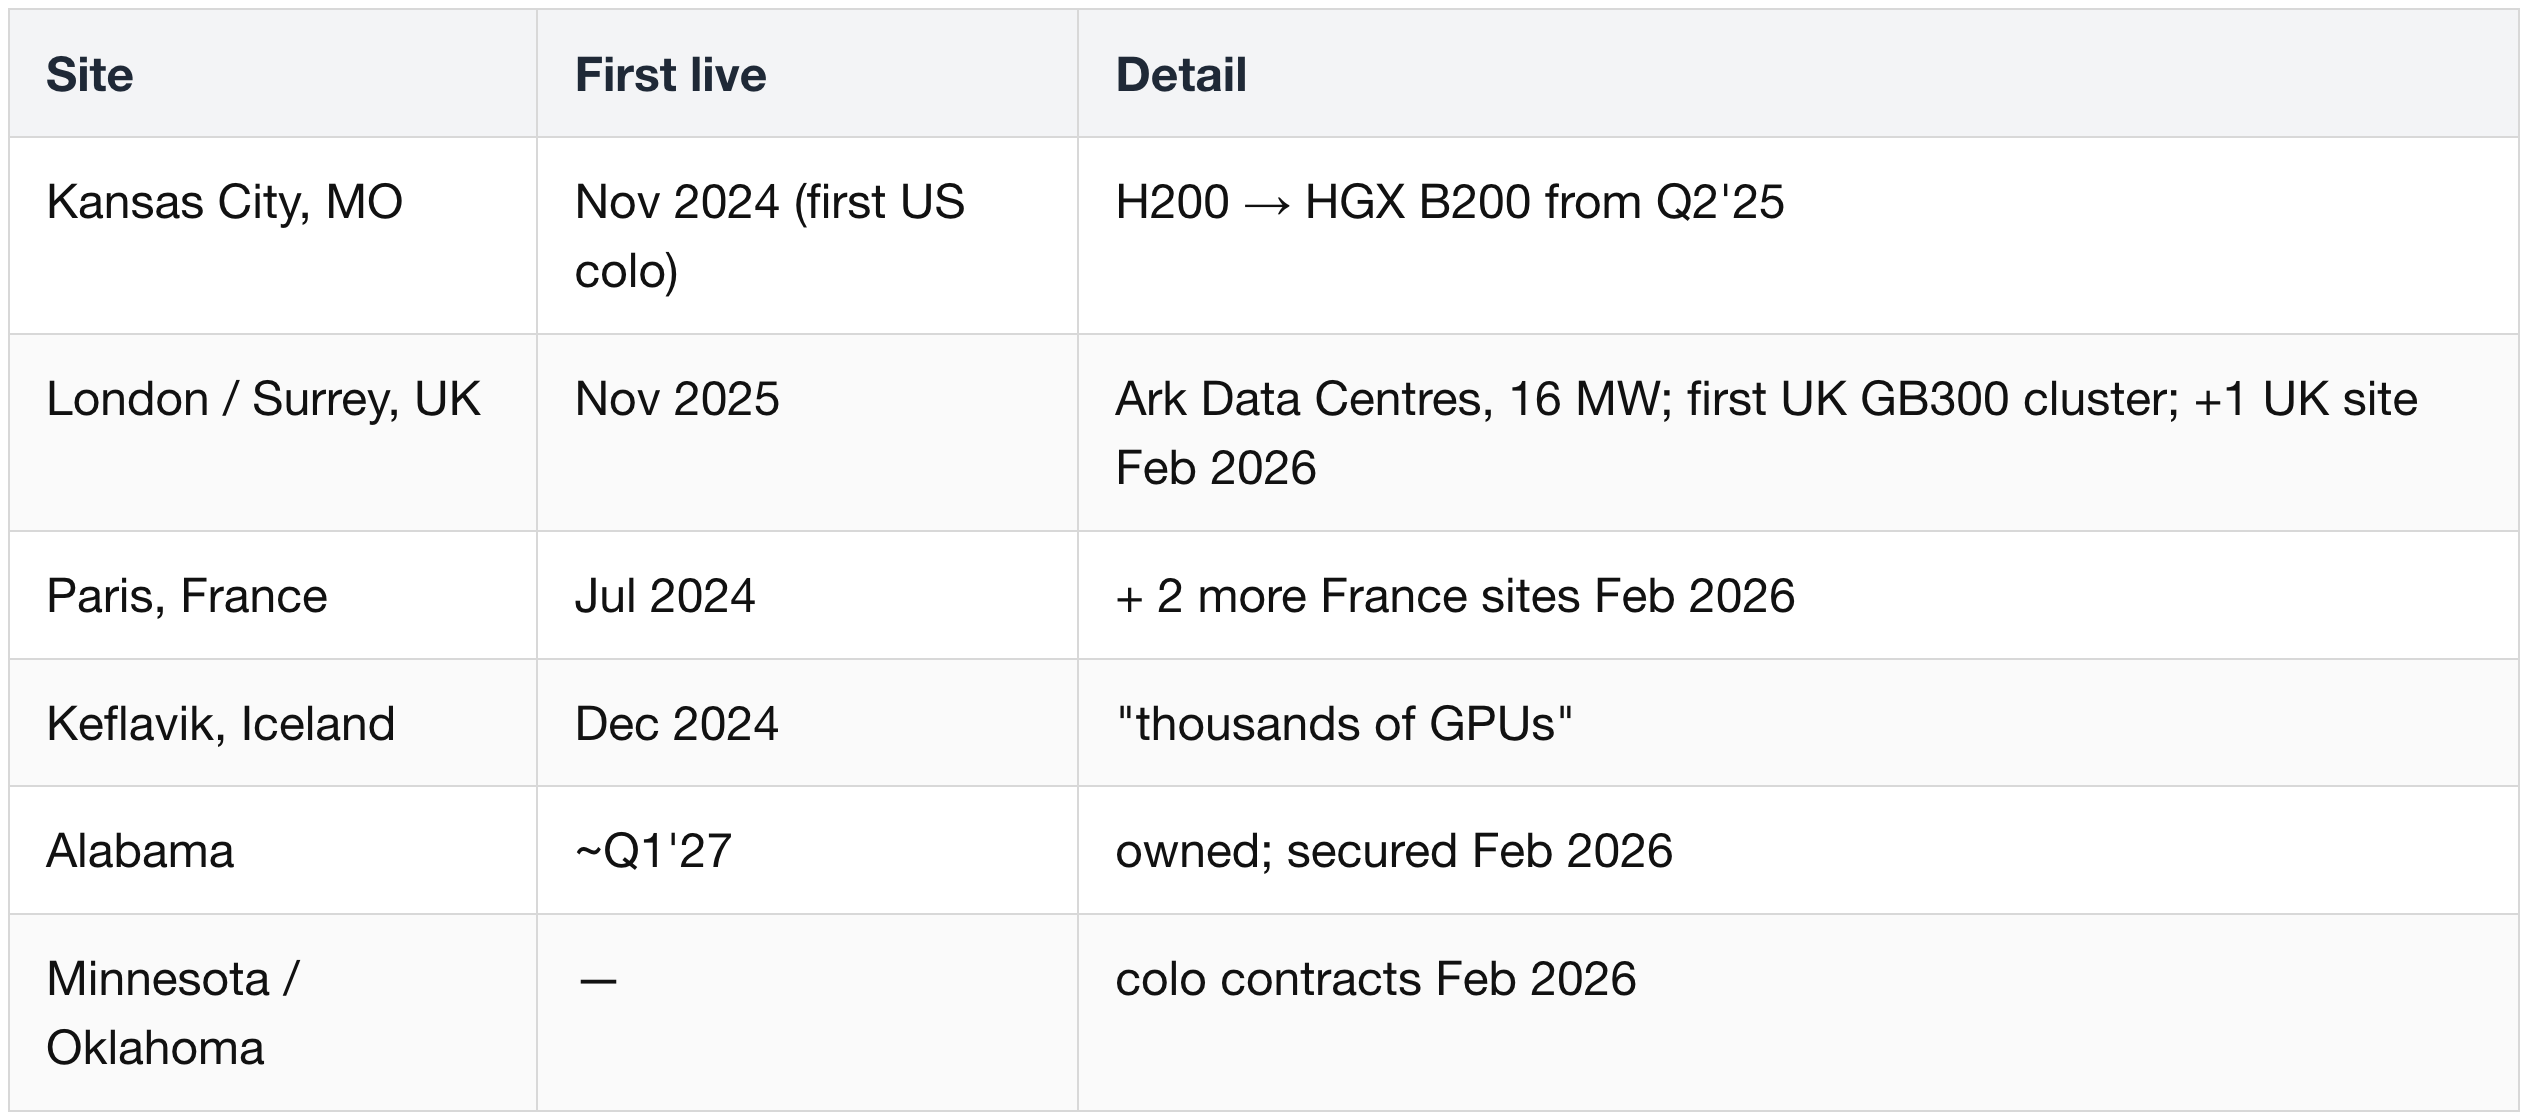
- The online 170 MW is spread across the legacy/colo footprint plus Vineland's first tranche, no single site dominating — Mäntsälä (~25 MW legacy base, ramping to 75), Vineland tranches 1–2 (a slice of its 300 MW), the Israel colos, and the small European/US colos (Kansas City, London 16 MW, Paris, Iceland).
- The GW campuses contribute nothing yet: Independence (first ~CY 1Q27), Pennsylvania (end-2027), Alabama (~CY 1Q27) are the >3.5 GW contracted book, not online power.
- Caveat: at the ramping sites energized MW sits below nameplate (Vineland is 2 of 9 tranches; Mäntsälä mid-triple), so the 170 MW is the live fraction of these sites, not their capacities summed.
The sites:
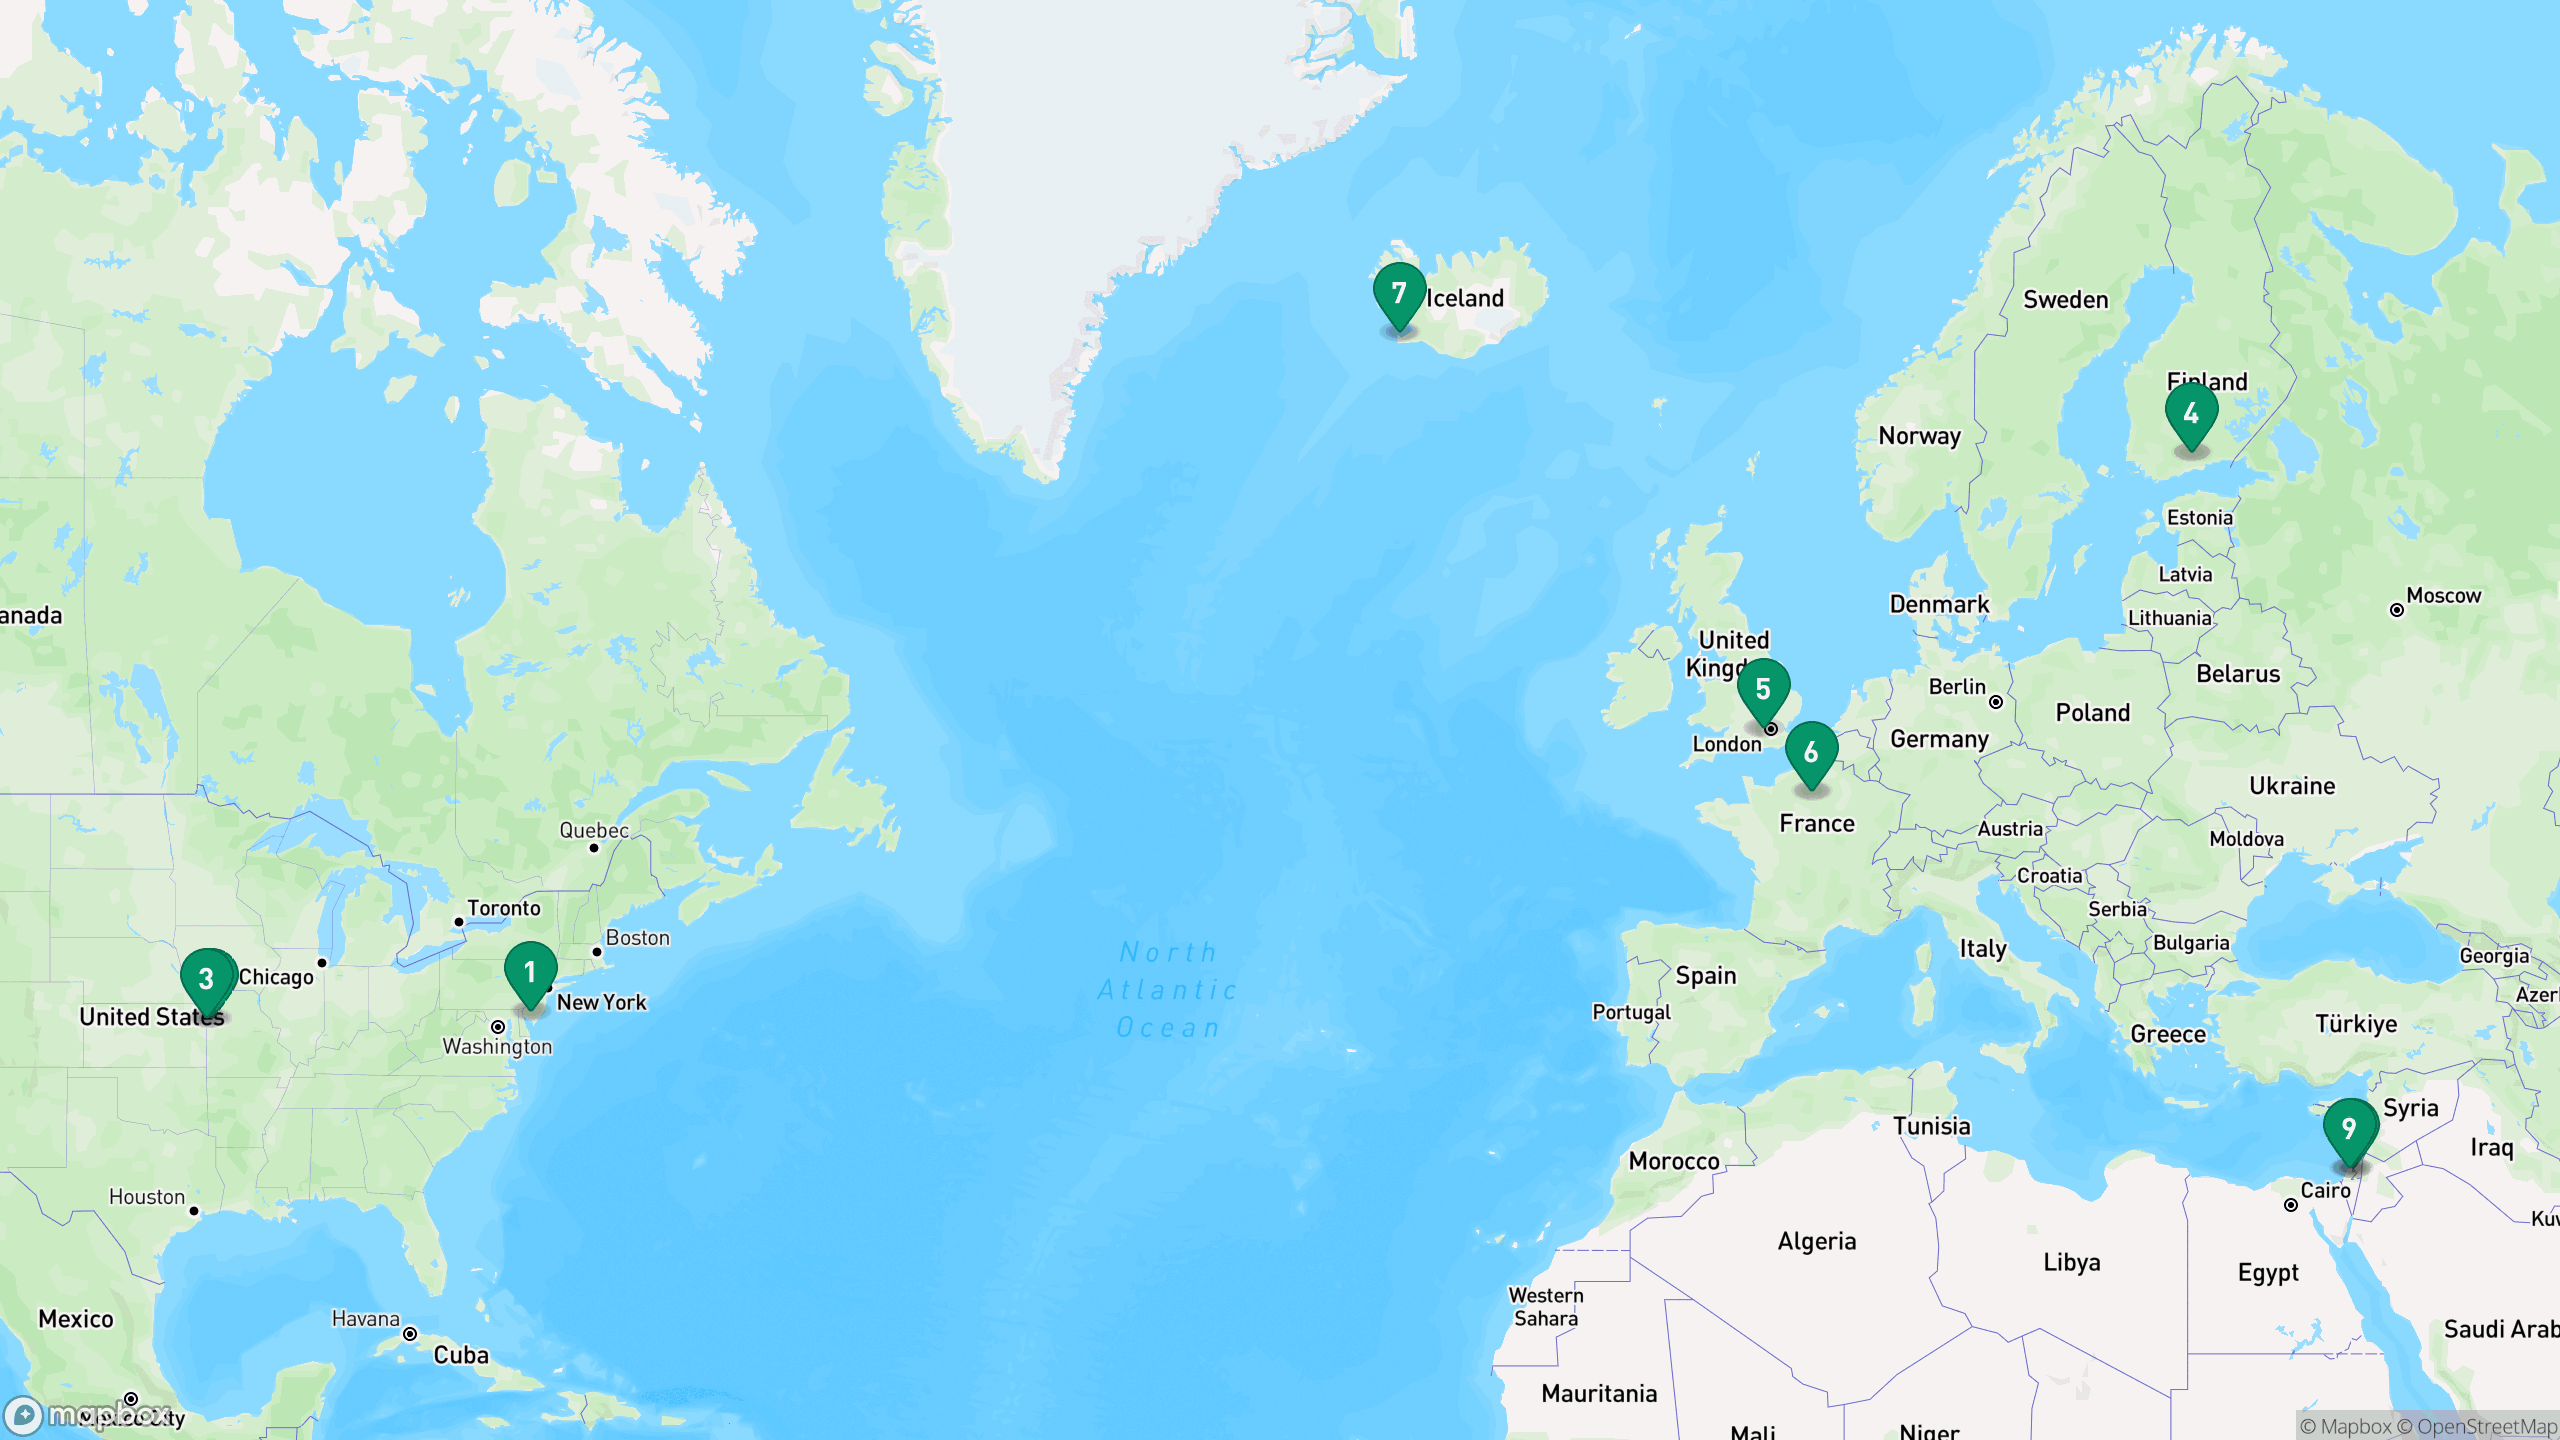
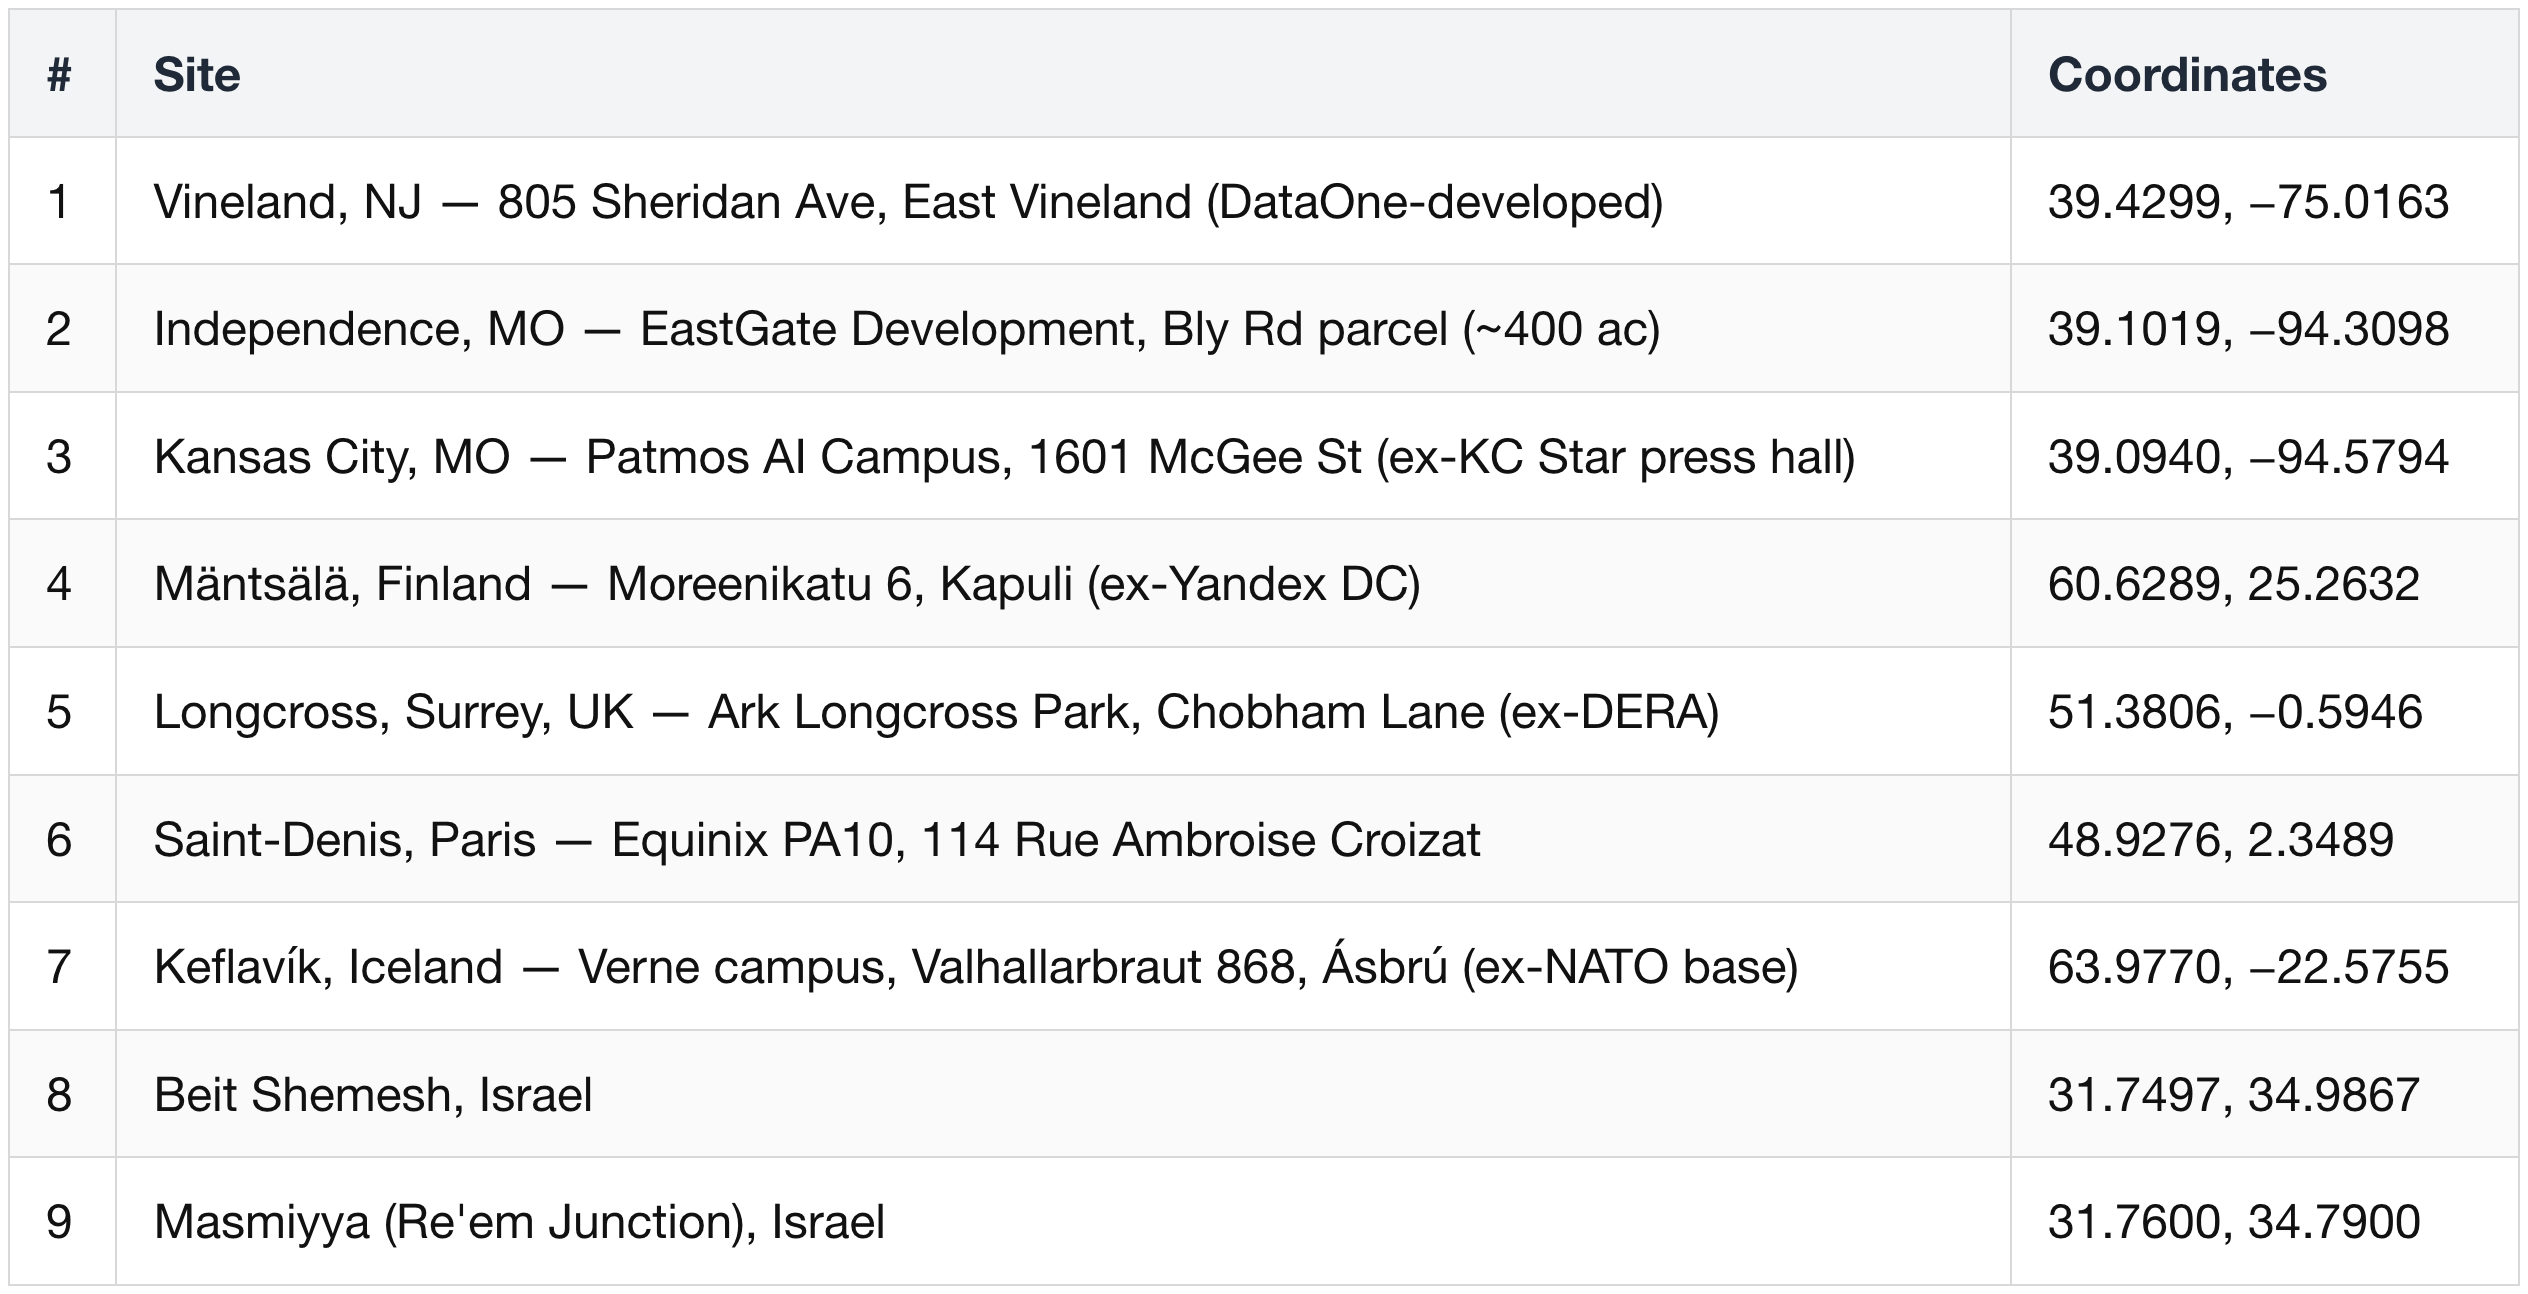
- Coordinates are site-level (datacentermap / operator PRs / local press).
- Approximate: Israel (junction-area) and Independence (parcel centroid ±500 m).
- Pennsylvania, Alabama, Minnesota, Oklahoma — announced but not yet located, so unmapped.
Vineland, NJ — the Microsoft factory
- Online contribution: partial — tranches 1–2 of 9 energized, a fraction of the 300 MW nameplate.
- Partners: Nebius-built (built-to-suit); anchor tenant Microsoft.
- Capacity: ~300 MW initial + ~400 MW expansion potential.
- Chips: Blackwell-only (GB200 / GB300), across 9 delivery tranches in 2025–26.
- Status: tranche 1 delivered Nov 2025, tranche 2 Feb 2026; media flagged delays, but management said on the CY 1Q26 call all capacity commitments were met and tranches stay on schedule through YE26.
Independence, Missouri
- Partners: Nebius-owned campus.
- Capacity: 1.2 GW.
- Status: broke ground May 12, 2026; first capacity ~CY 1Q27.
- Online now: 0 — forward, sits in the >3.5 GW contracted book.
Pennsylvania
- Partners: Nebius-owned "AI factory" — its second US GW-scale owned site.
- Capacity: up to 1.2 GW.
- Online: lights up end-2027 at ~250–300 MW, then +~300 MW/yr to full 1.2 GW by early 2030.
Mäntsälä, Finland
- Partners: Nebius-owned greenfield (the legacy flagship site).
- Capacity: tripling to 75 MW (so a ~25 MW base → 75 MW target) / up to ~60,000 GPUs.
- Chips: H100 / H200 core.
- Online now: ~25 MW legacy base live, expansion to 75 MW in progress
Israel
- Partners: Mega Or (landlord lease) across Masmiyya & Beit Shemesh; plus a $140M government-part-funded national supercomputer.
- Capacity: ~80 MW leased.
- Status: first colo secured Oct 2025; +2 sites Feb 2026.
Other colocation sites
IREN
- Grid pipeline:
- ~5 GW secured power (FY 3Q26 call, 2026-05-07) — up from 4,510 MW / 7 sites (10-Q 3/31/26) after Spain's 490 MW folded in
- new sites added across Europe + APAC
- Operating vs AI-cloud power — the headline figures don't mean the same thing:
- 810 MW operating is mostly still Bitcoin mining, not AI compute
- AI-cloud target is 480 MW by end-CY26
- 1,210 MW in build for 2027
- GPU fleet:
- 816 H100 (Feb 2024, the pivot) → 1,896 H100+H200 (Sep 2024) → ~10.9k incl. B200 / B300 / GB300 (end-2025) → ~150,000 installed or on order (3/31/26)
- ~140k deployed by end-CY26 target
- all GPU supply via Dell
- VR200: no order disclosed — only the VR-ready Sweetwater design and Nvidia investment rights vesting on deliveries of up to 600,000 GPUs through 2031 (a ceiling, not an order).
- The conversion cost:
- mining hashrate 50 → 38 EH/s as ASICs come offline
- $172M impairments booked + ~$520M more estimated for the full Childress transition
- a revenue air-pocket while mining winds down before GPUs bill (FY 3Q26 revenue $144.8M, net loss $247.8M)
How the sites sum to the online AI power — barely any of the headline MW is AI yet.
- IREN's big numbers describe three different things: ~5 GW secured (grid pipeline), 810 MW operating (mostly mining), and the AI-cloud online power (tiny).
- The only live AI capacity is Prince George's 50 MW site — all air-cooled GPUs delivered, operating or commissioning across the 50 MW (FY 3Q26 call); it is the sole AI-cloud revenue location ($33.6M in FY 3Q26, up from $17.3M).
- Childress Horizon 1 (50 MW IT / 75 MW gross) is commissioning, not yet billing — Microsoft handoff scheduled CY 3Q26; Horizon 2–4 follow through end-CY26 toward the 480 MW target.
- Everything else is forward — Sweetwater (substation energized, first 200 MW IT under construction), Mackenzie (80 MW, GPU installs 2H CY26), Kiowa (2028), Spain / Australia (early-stage). The ~5 GW secured is where AI power will land, not where it is.
The sites:
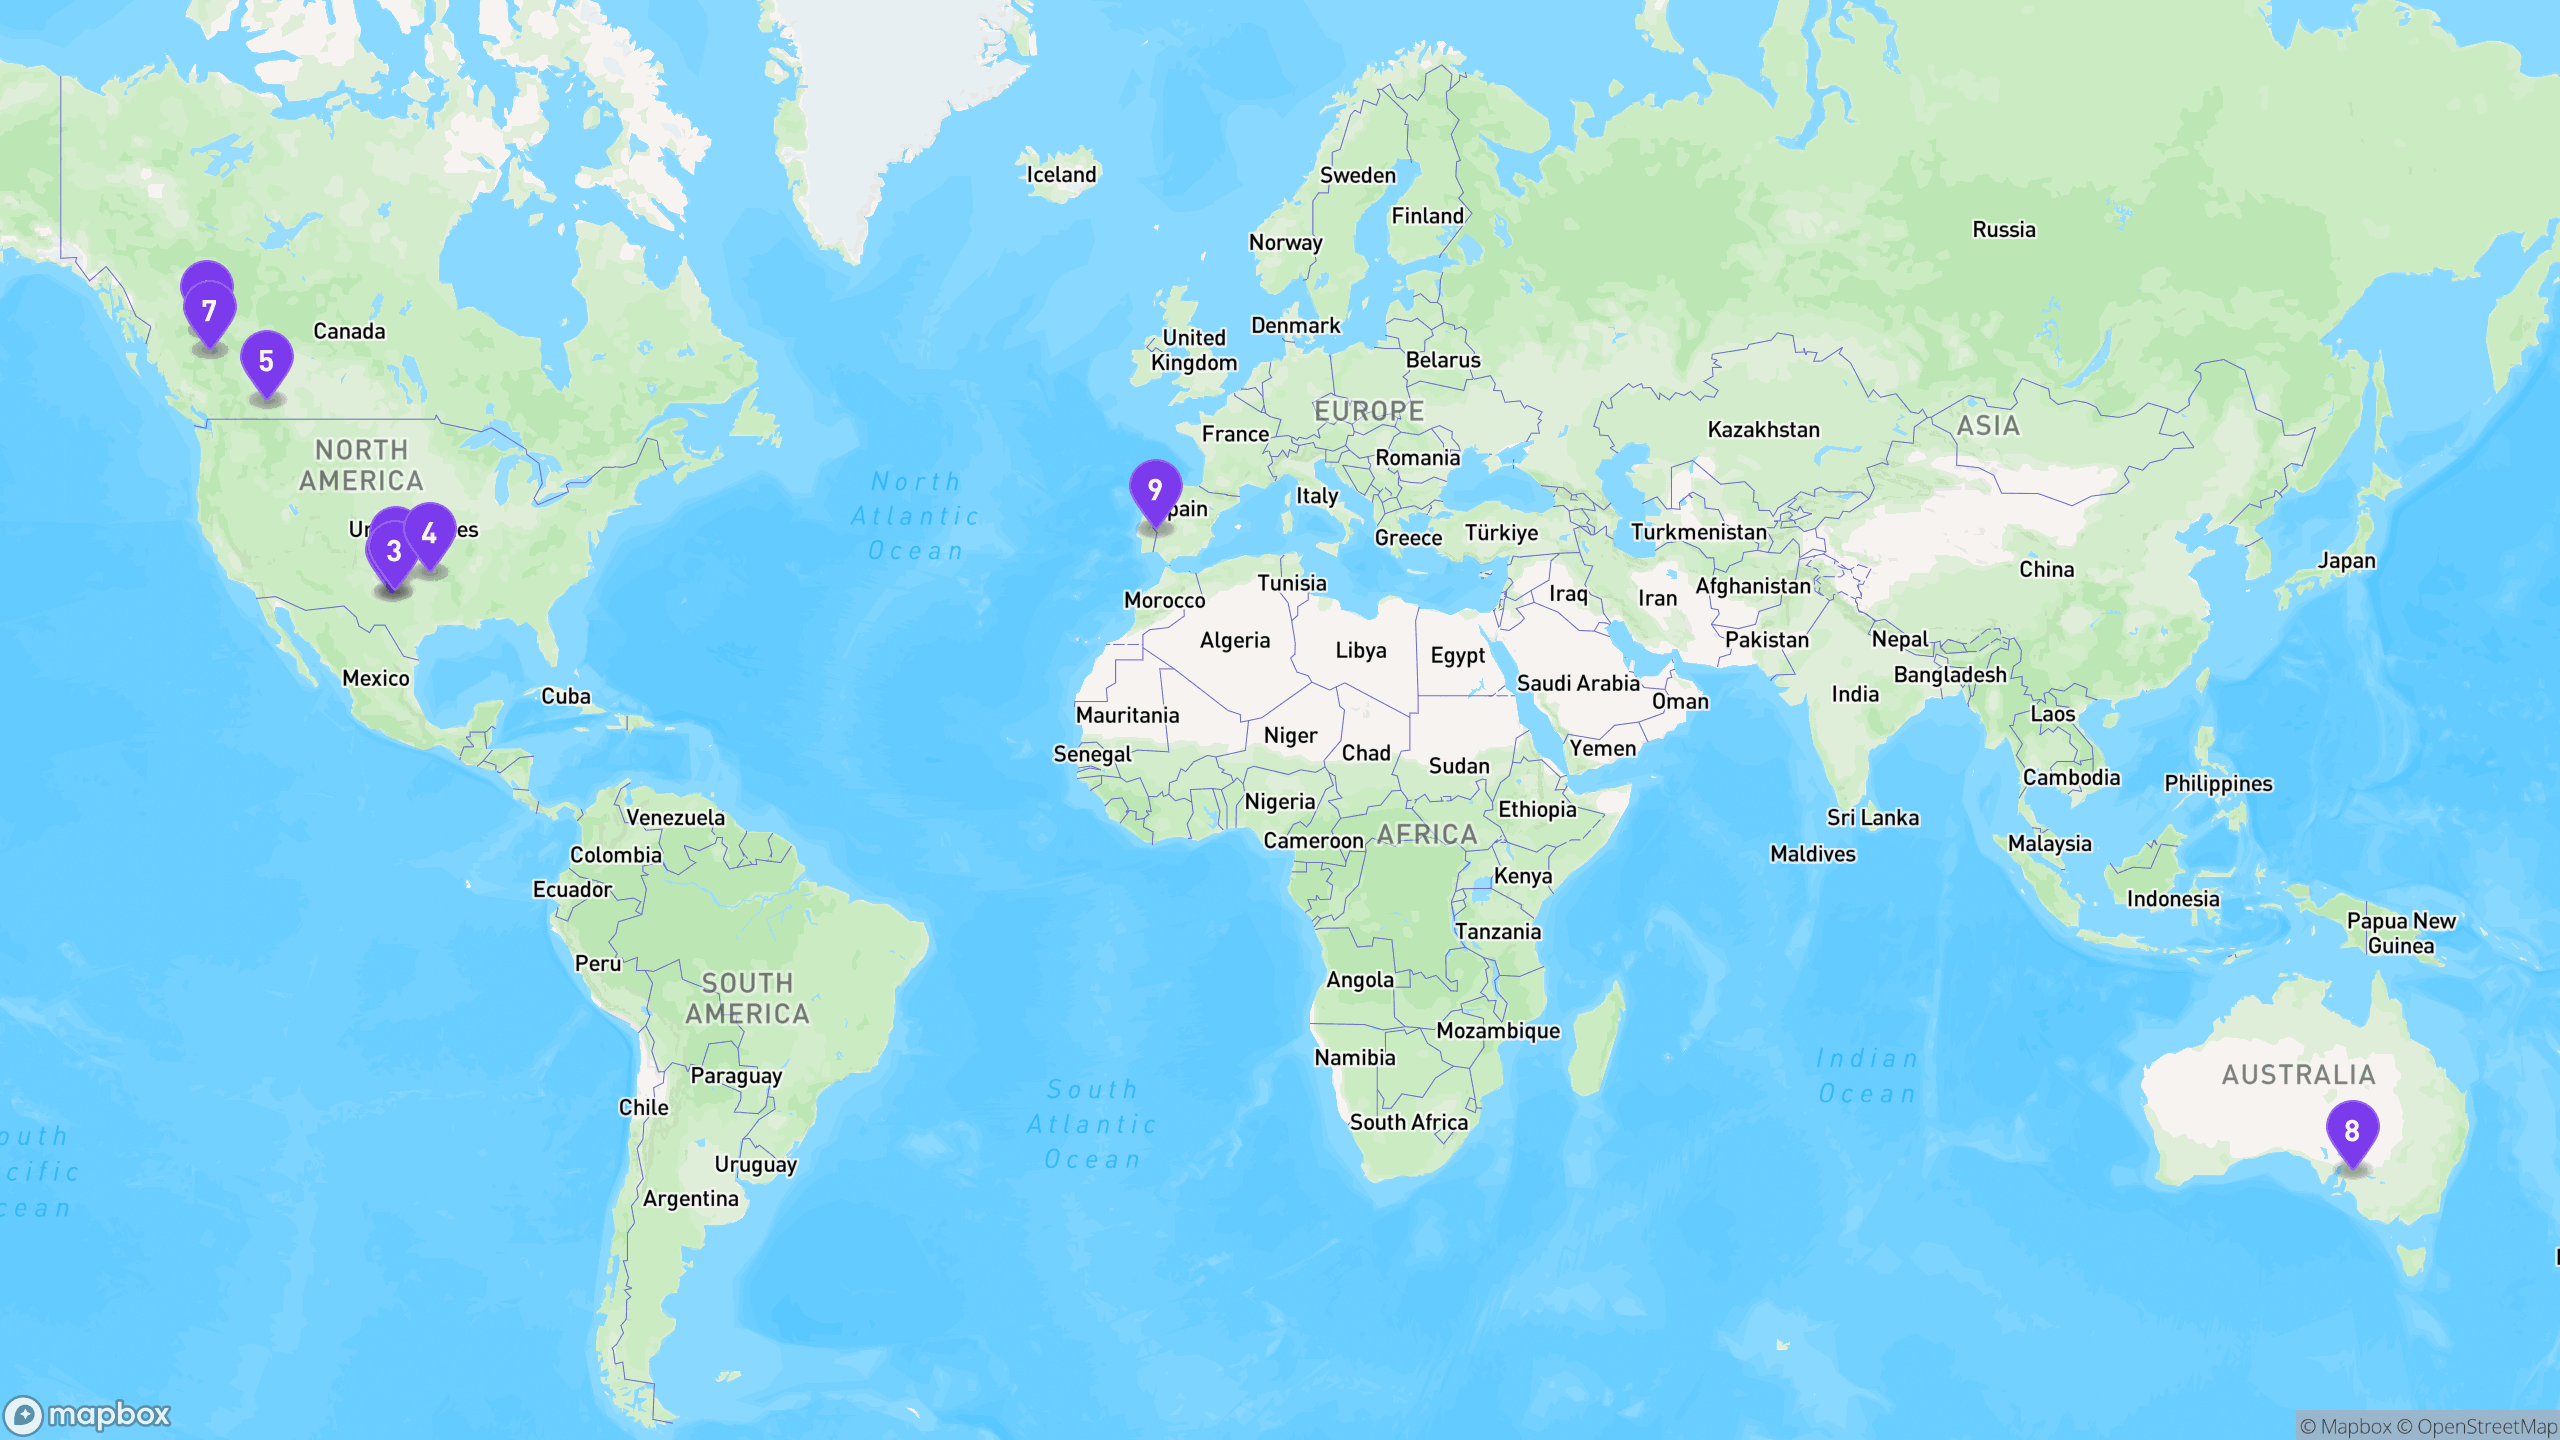
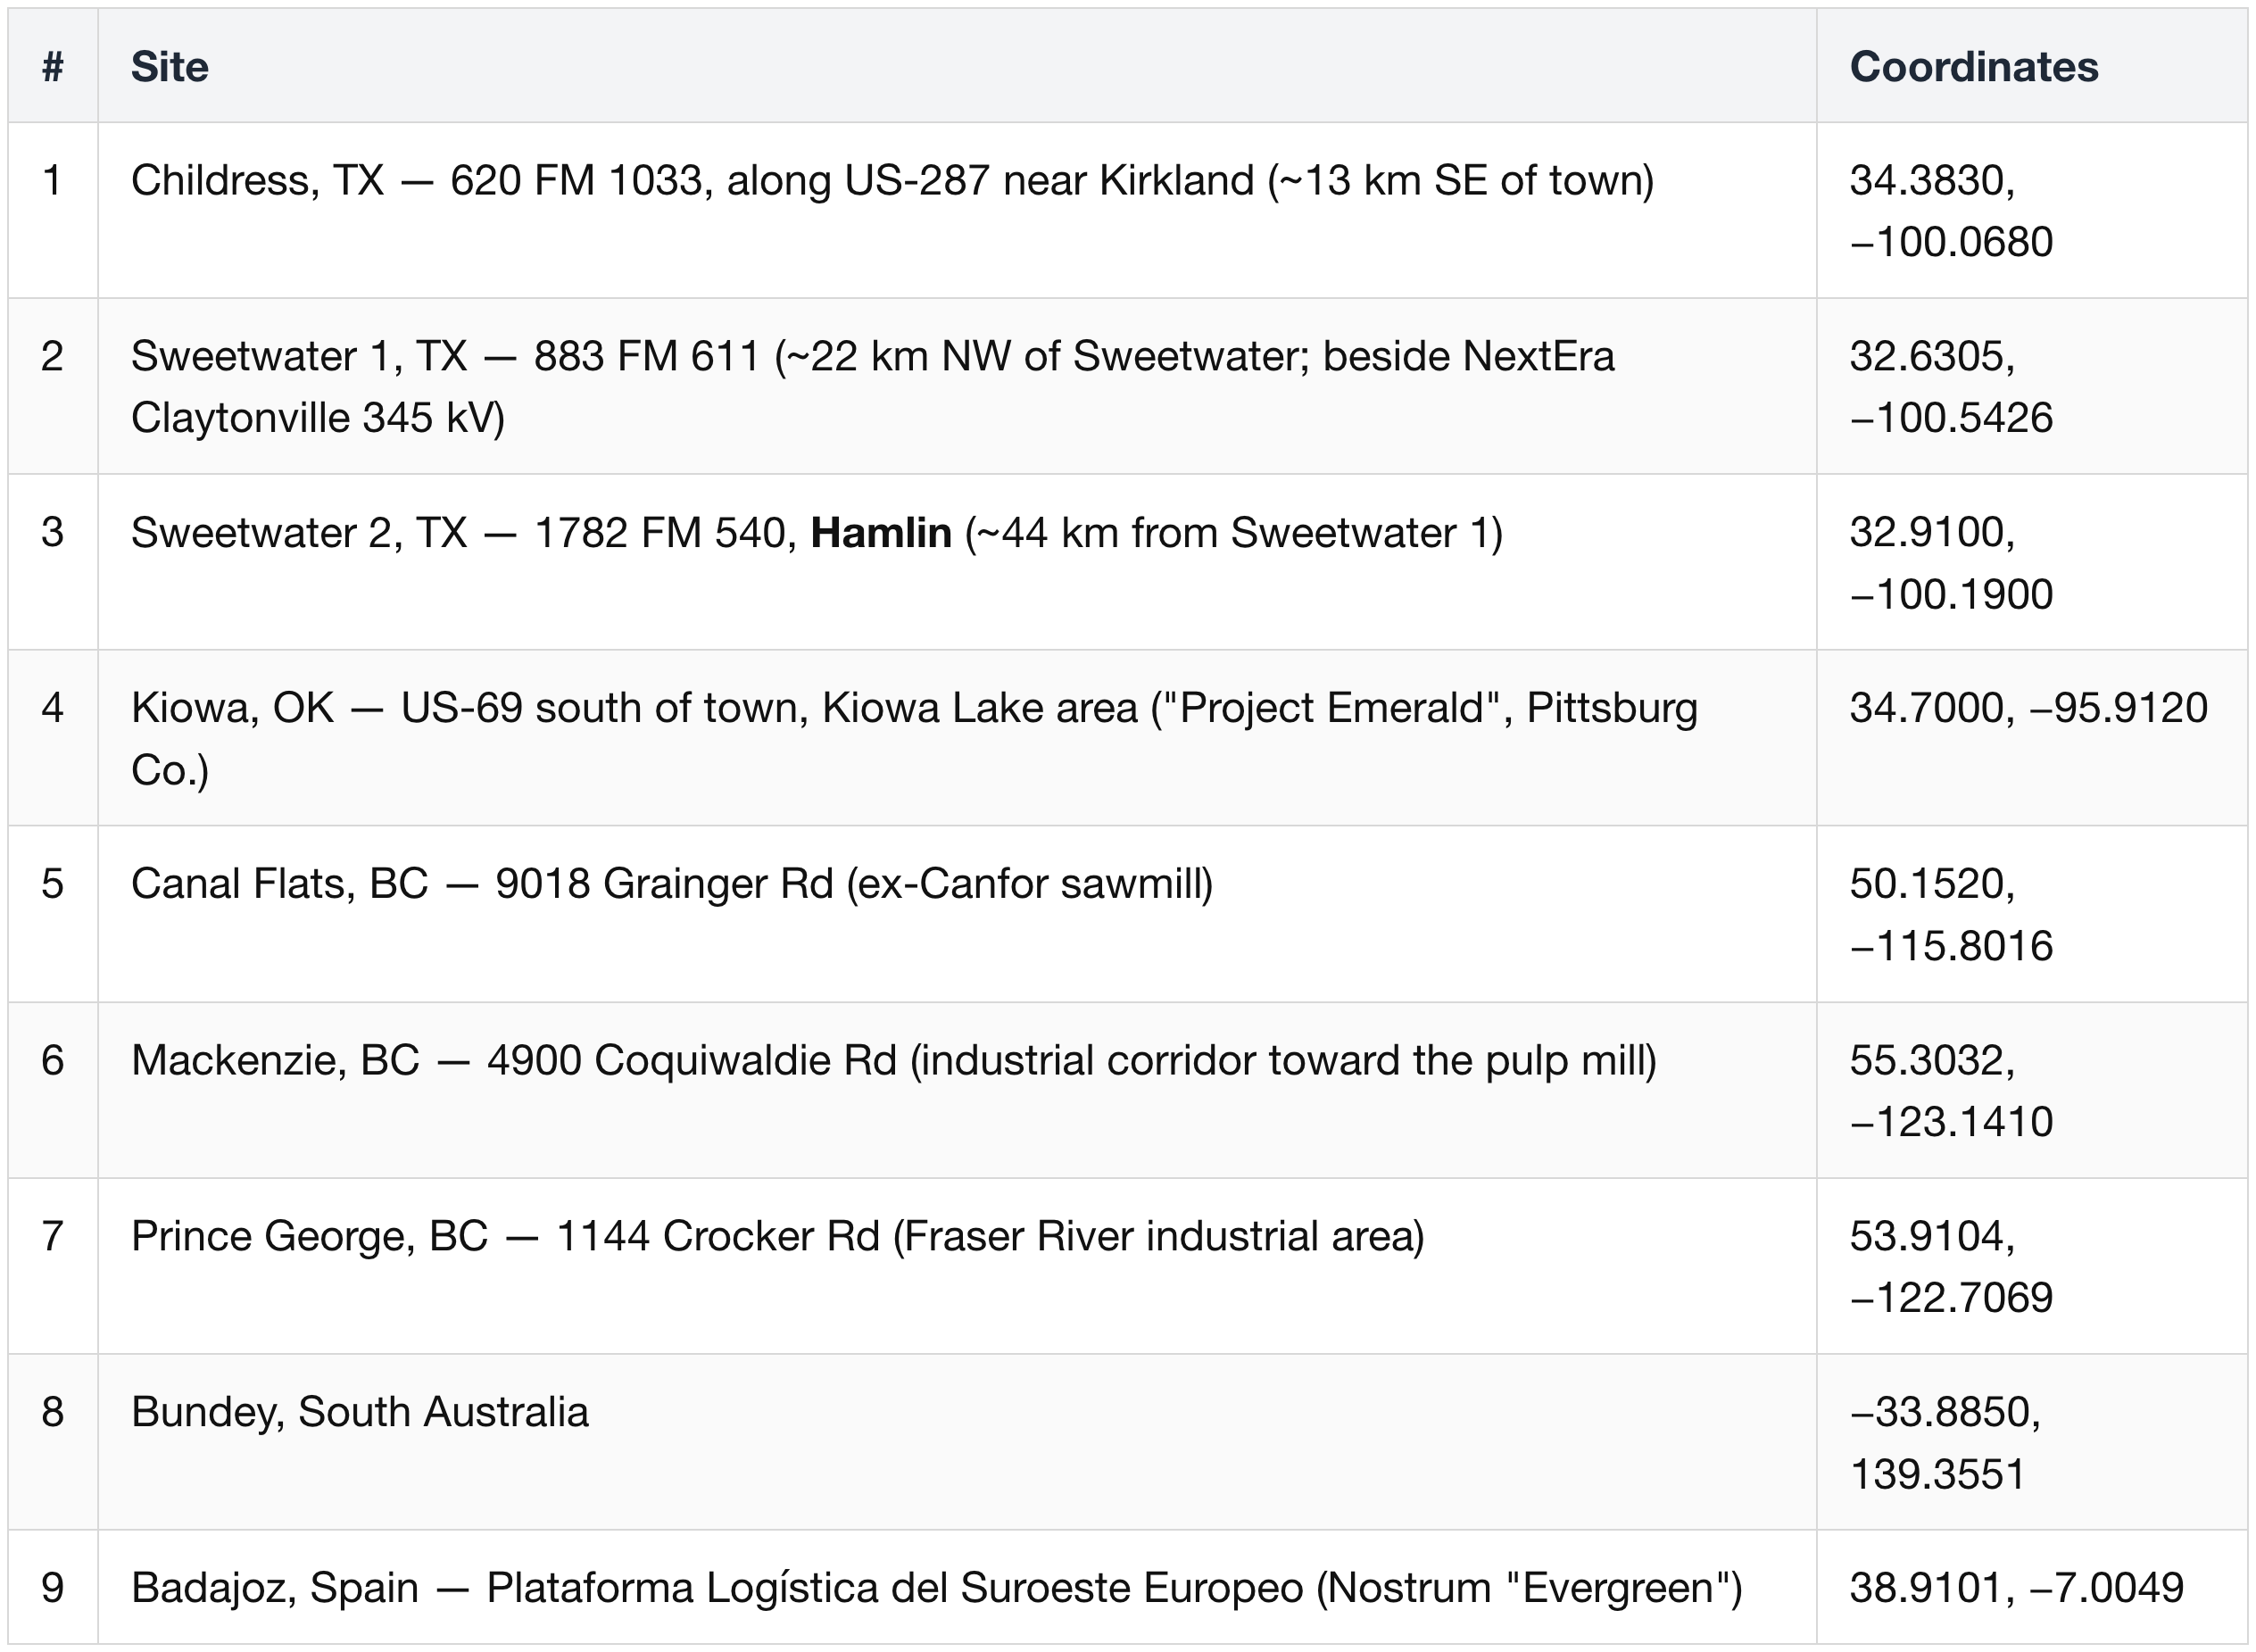
- Coordinates are site-level (datacentermap / baxtel pins, addresses, OSM substation geometry).
- Approximate: Kiowa (±1 km), Sweetwater 2 (road-level, FM 540), Bundey (locality-level).
- Sweetwater 1 and 2 are separate campuses ~44 km apart — S2 is near Hamlin, not Sweetwater.
- Nostrum's ~490 MW: Badajoz 214 MW (pinned, the "Evergreen" flagship) + Cáceres 214 + Guadalajara 29 + Pinto 21 + Zamudio 21.
Childress, TX — the Microsoft site
- Partners:
- IREN-owned brownfield (ex-mining)
- GPUs via Dell
- anchor tenants Microsoft (Horizon 1–4) and Nvidia ($3.4B, in an existing 60 MW).
- Capacity: 750 MW grid.
- Rollout: Horizon 1 (50 MW IT / 75 MW gross, liquid-cooled) energized CY 4Q25 → Horizon 2–4 (+150 MW IT, 200 MW IT total for Microsoft, GB300) through end-CY26 → Horizon 5–6 (+150 MW liquid-cooled) in 2027.
- Chips: GB300 (Microsoft); air-cooled Blackwell (Nvidia $3.4B, ramp early 2027).
- Online now: 0 revenue yet — Horizon 1 GPUs commissioning (FY 3Q26 call), Microsoft handoff scheduled CY 3Q26.
Sweetwater 1, TX
- Partners: IREN-owned.
- Capacity: 1,400 MW.
- Status: substation energized April 2026.
- Online: first 200 MW (liquid-cooled) in build for 2027, VR200-ready (designed for Vera Rubin).
- Online now: 0 AI load — substation energized, first GPUs not until 2027.
Sweetwater 2, TX
- Capacity: 600 MW (secured Mar 2025).
- Online: target late 2027; fiber-linked to Sweetwater 1 → a combined 2 GW hub.
Kiowa, Oklahoma
- Capacity: 1,600 MW (announced Feb 5, 2026; 2,000 acres).
- Online: power ramps from 2028.
British Columbia, Canada
- Sites: Canal Flats (30 MW), Mackenzie (80 MW), Prince George (50 MW) = 160 MW.
- Note: Prince George hosts IREN's entire current AI-cloud fleet — all AI-cloud revenue through FY 3Q26 is booked in Canada. Being converted from mining.
- Online now: IREN's only live AI site — all air-cooled GPUs across the 50 MW operating or commissioning (FY 3Q26 call); carries the entire AI-cloud fleet ($33.6M FY 3Q26 revenue).
International pipeline
- Nostrum, Spain ~490 MW (acquired May 7, 2026; EUR 165M).
- Bundey, South Australia ~800 MW (early-stage, June 2026).
Oracle (OCI)
- Secured / planned power:
- five Oracle-side Stargate sites ≈ 8.1 GW planned (est., no official total)
- company frame: "10 GW of power secured for the next three years"
- Delivery pace (FY 4Q26 call, 2026-06-10):
- >1.2 GW delivered to customers in FY26
- FY 1Q27 delivery approaching 1 GW — nearly the whole prior 4 quarters combined in a single quarter
- GPU fleet:
- Zettascale H200 superclusters (to 65,536)
- GB300 superclusters (to 131,072)
- Zettascale10 design to 800k GPUs
- AMD MI450 launch partner — initial 50,000 from CY 3Q26 (the one big non-Nvidia bet in this pool)
- VR200 launch cloud partner, order size undisclosed
- Demand proof:
- global GPU utilization 97.5% (first-ever disclosure, FY 4Q26 call)
- FY 4Q26 renewal cohort — 35k GPUs across 59 customers: 49% of customers renewed, covering 92% of GPU volume; non-renewals resold within the quarter
- Structure: Oracle owns little of this — it signs 15–19 year leases with developers who carry the project debt (see §2 (3)); Oracle brings the cluster-operations layer and the customer.
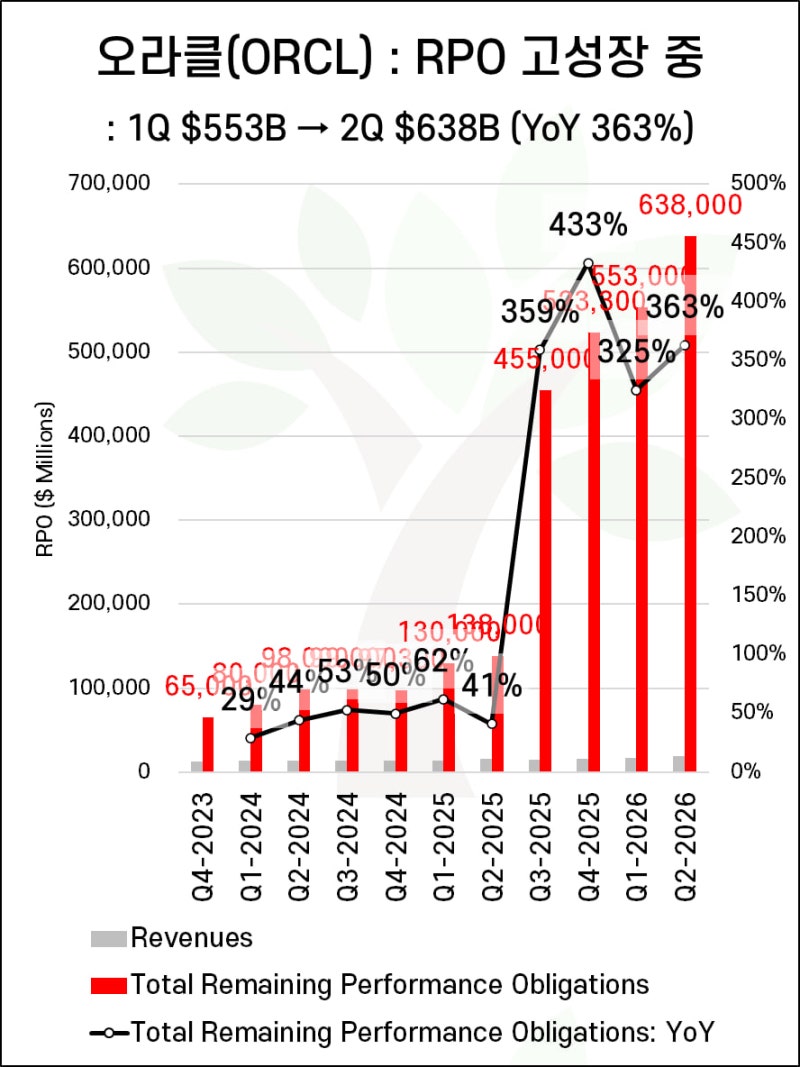
How the sites sum to the online power — the online 1.2 GW and the named sites are two different universes.
- Oracle runs two separate power footprints: its broad OCI cloud (dozens of existing regions worldwide) and the five Stargate mega-campuses (the 8.1 GW AI-factory pipeline).
- The >1.2 GW delivered to customers in FY26 (97.5% utilized) lives in the broad OCI footprint — mostly unlisted regions, the same way CoreWeave's online GW sits in unnamed shells. It is not the sum of the five named Stargate sites.
- The named Stargate sites are the forward 8.1 GW book, not today's online power — customer delivery begins CY27. Only two slivers are energized so far: Abilene ~0.3 GW and Frontier 115 MW.
- "Delivered" ≠ "energized": Oracle reports Abilene "42% delivered," but third-party Epoch AI counted only ~0.3 GW energized IT load (4 of 8 buildings, Apr 2026) — the "delivered" metric runs ahead of live power.
- Oracle owns none of it — every site sits on a developer's balance sheet under a 15–19 yr lease; Oracle supplies the cluster-operations layer and the customer, not the real estate.
The sites:
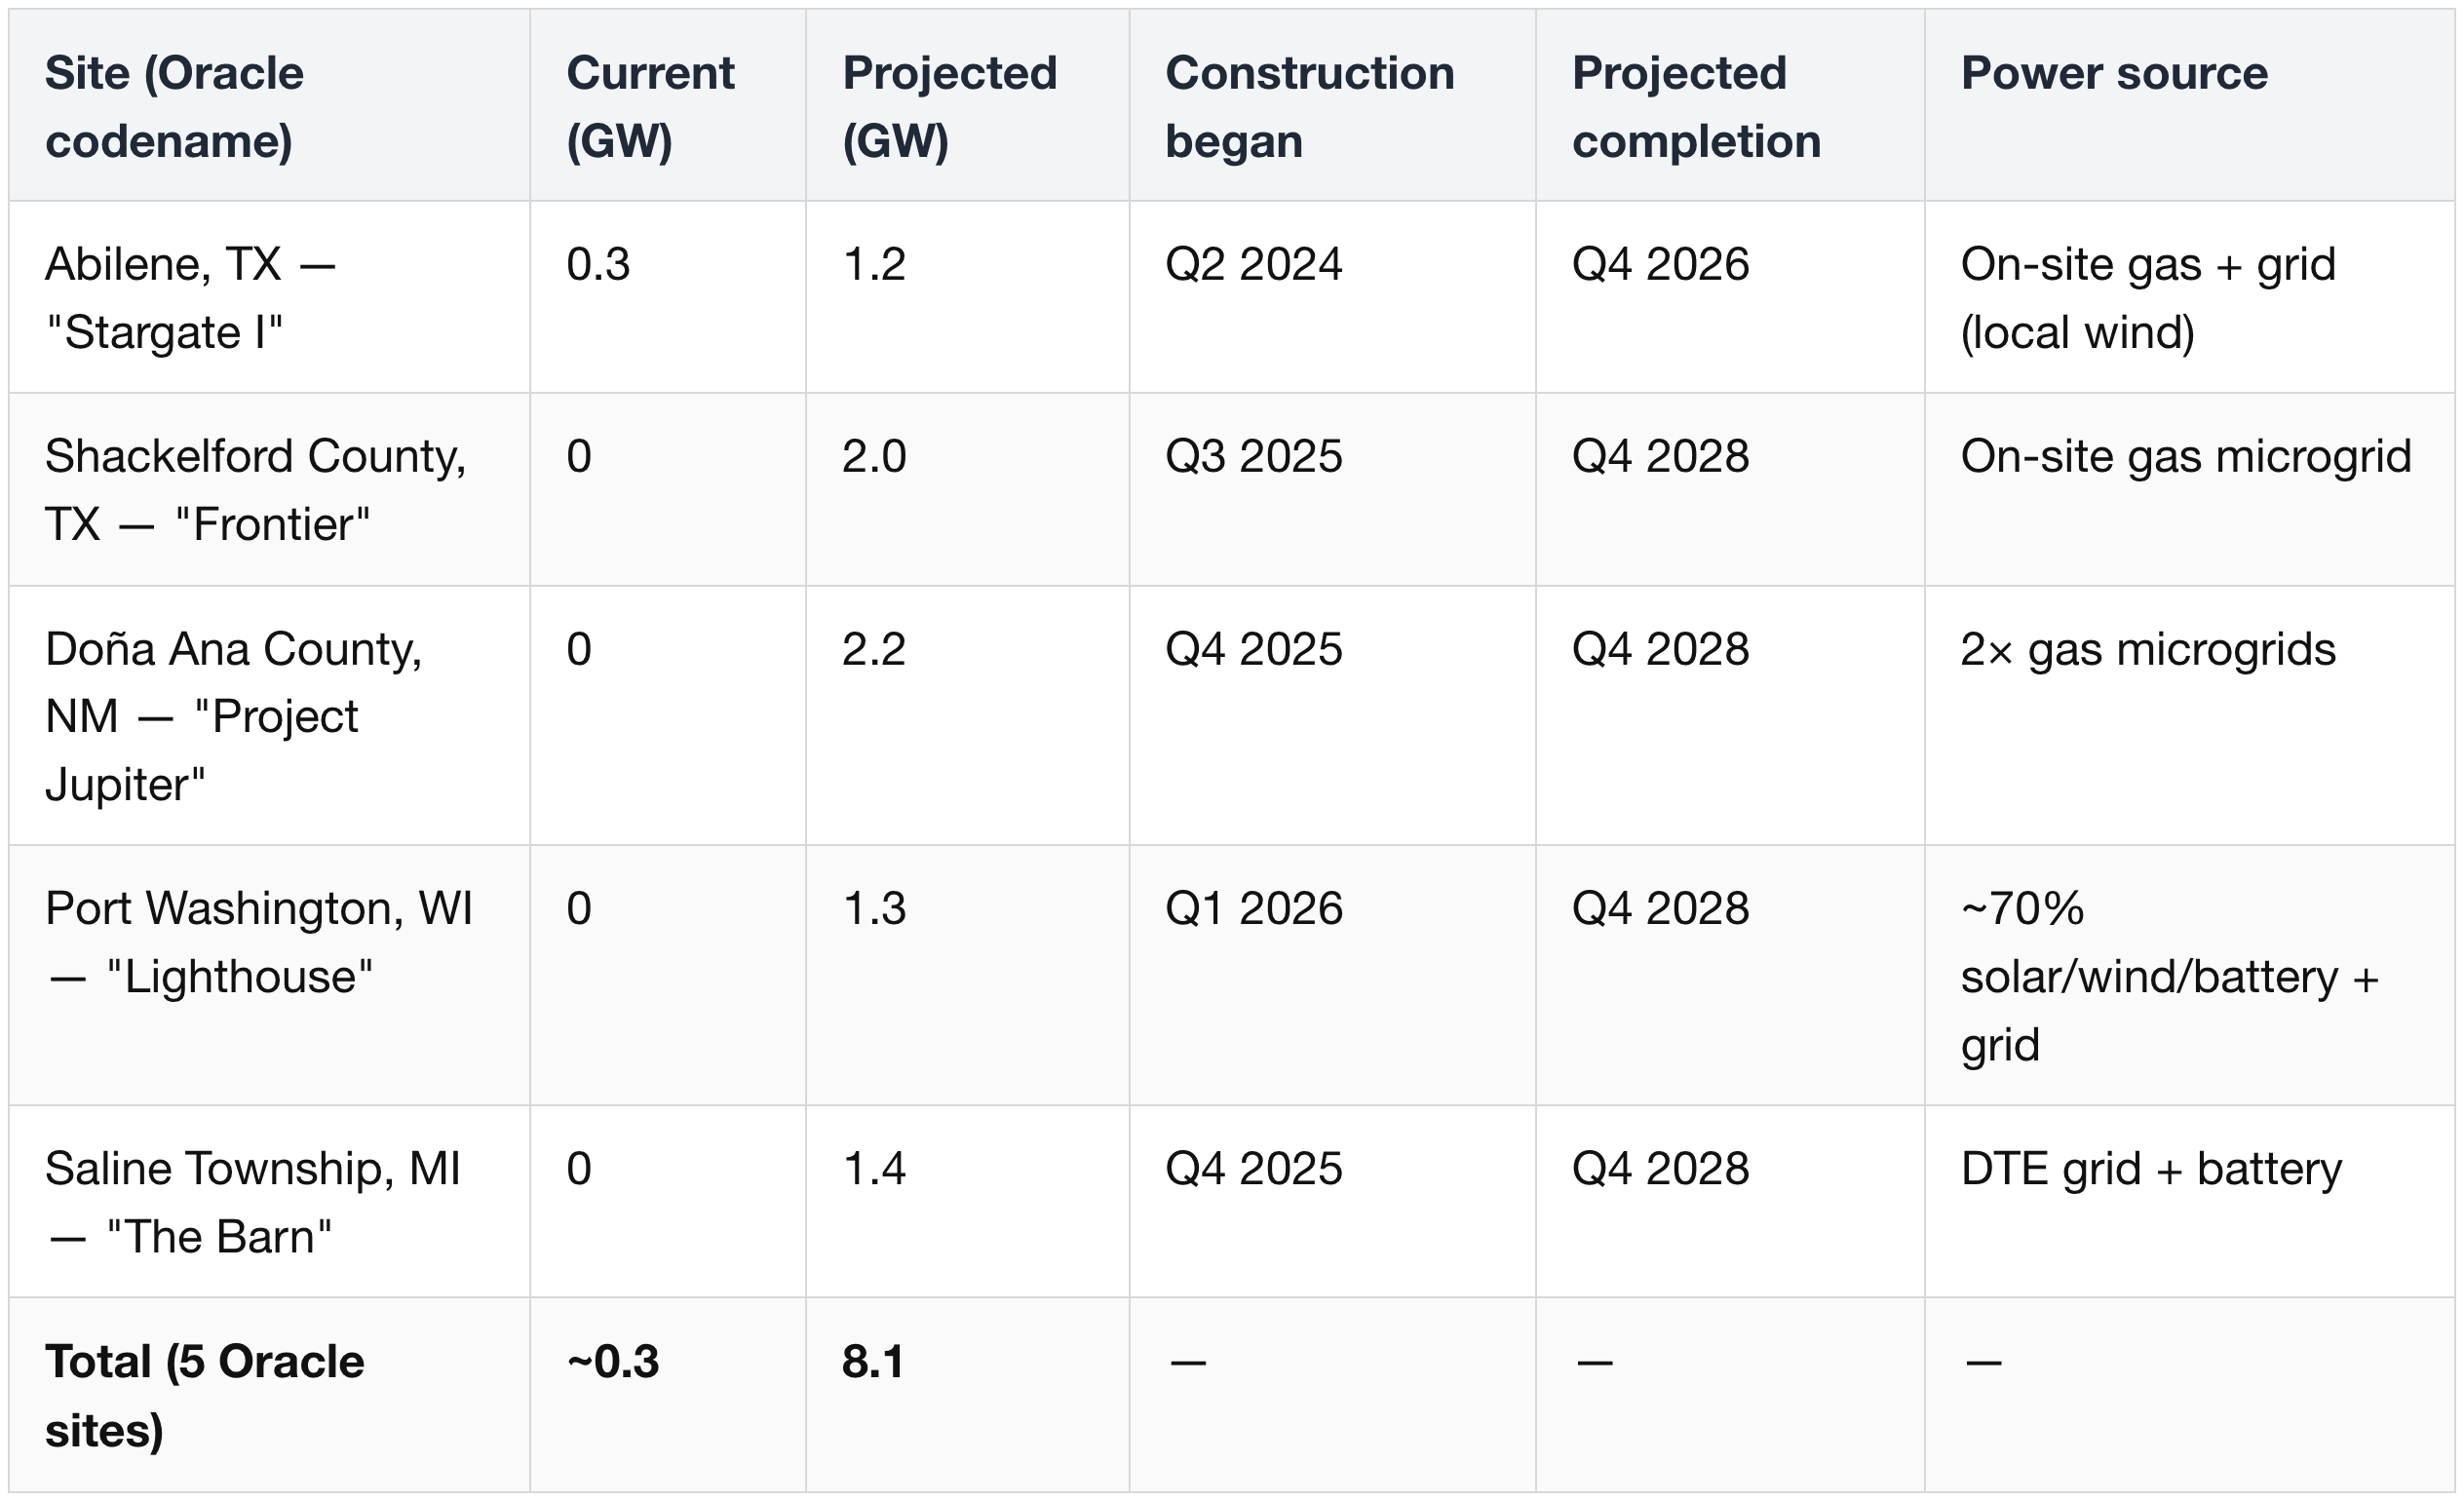
- The Current column is the reconciliation: only Abilene's 0.3 GW is energized (4 of 8 buildings, Blackwell); the other four read 0 — the whole 8.1 GW is forward, most completing CY 4Q28.
- Frontier's 115 MW of live power rounds below 0.1 GW in this snapshot, so it shows as 0.
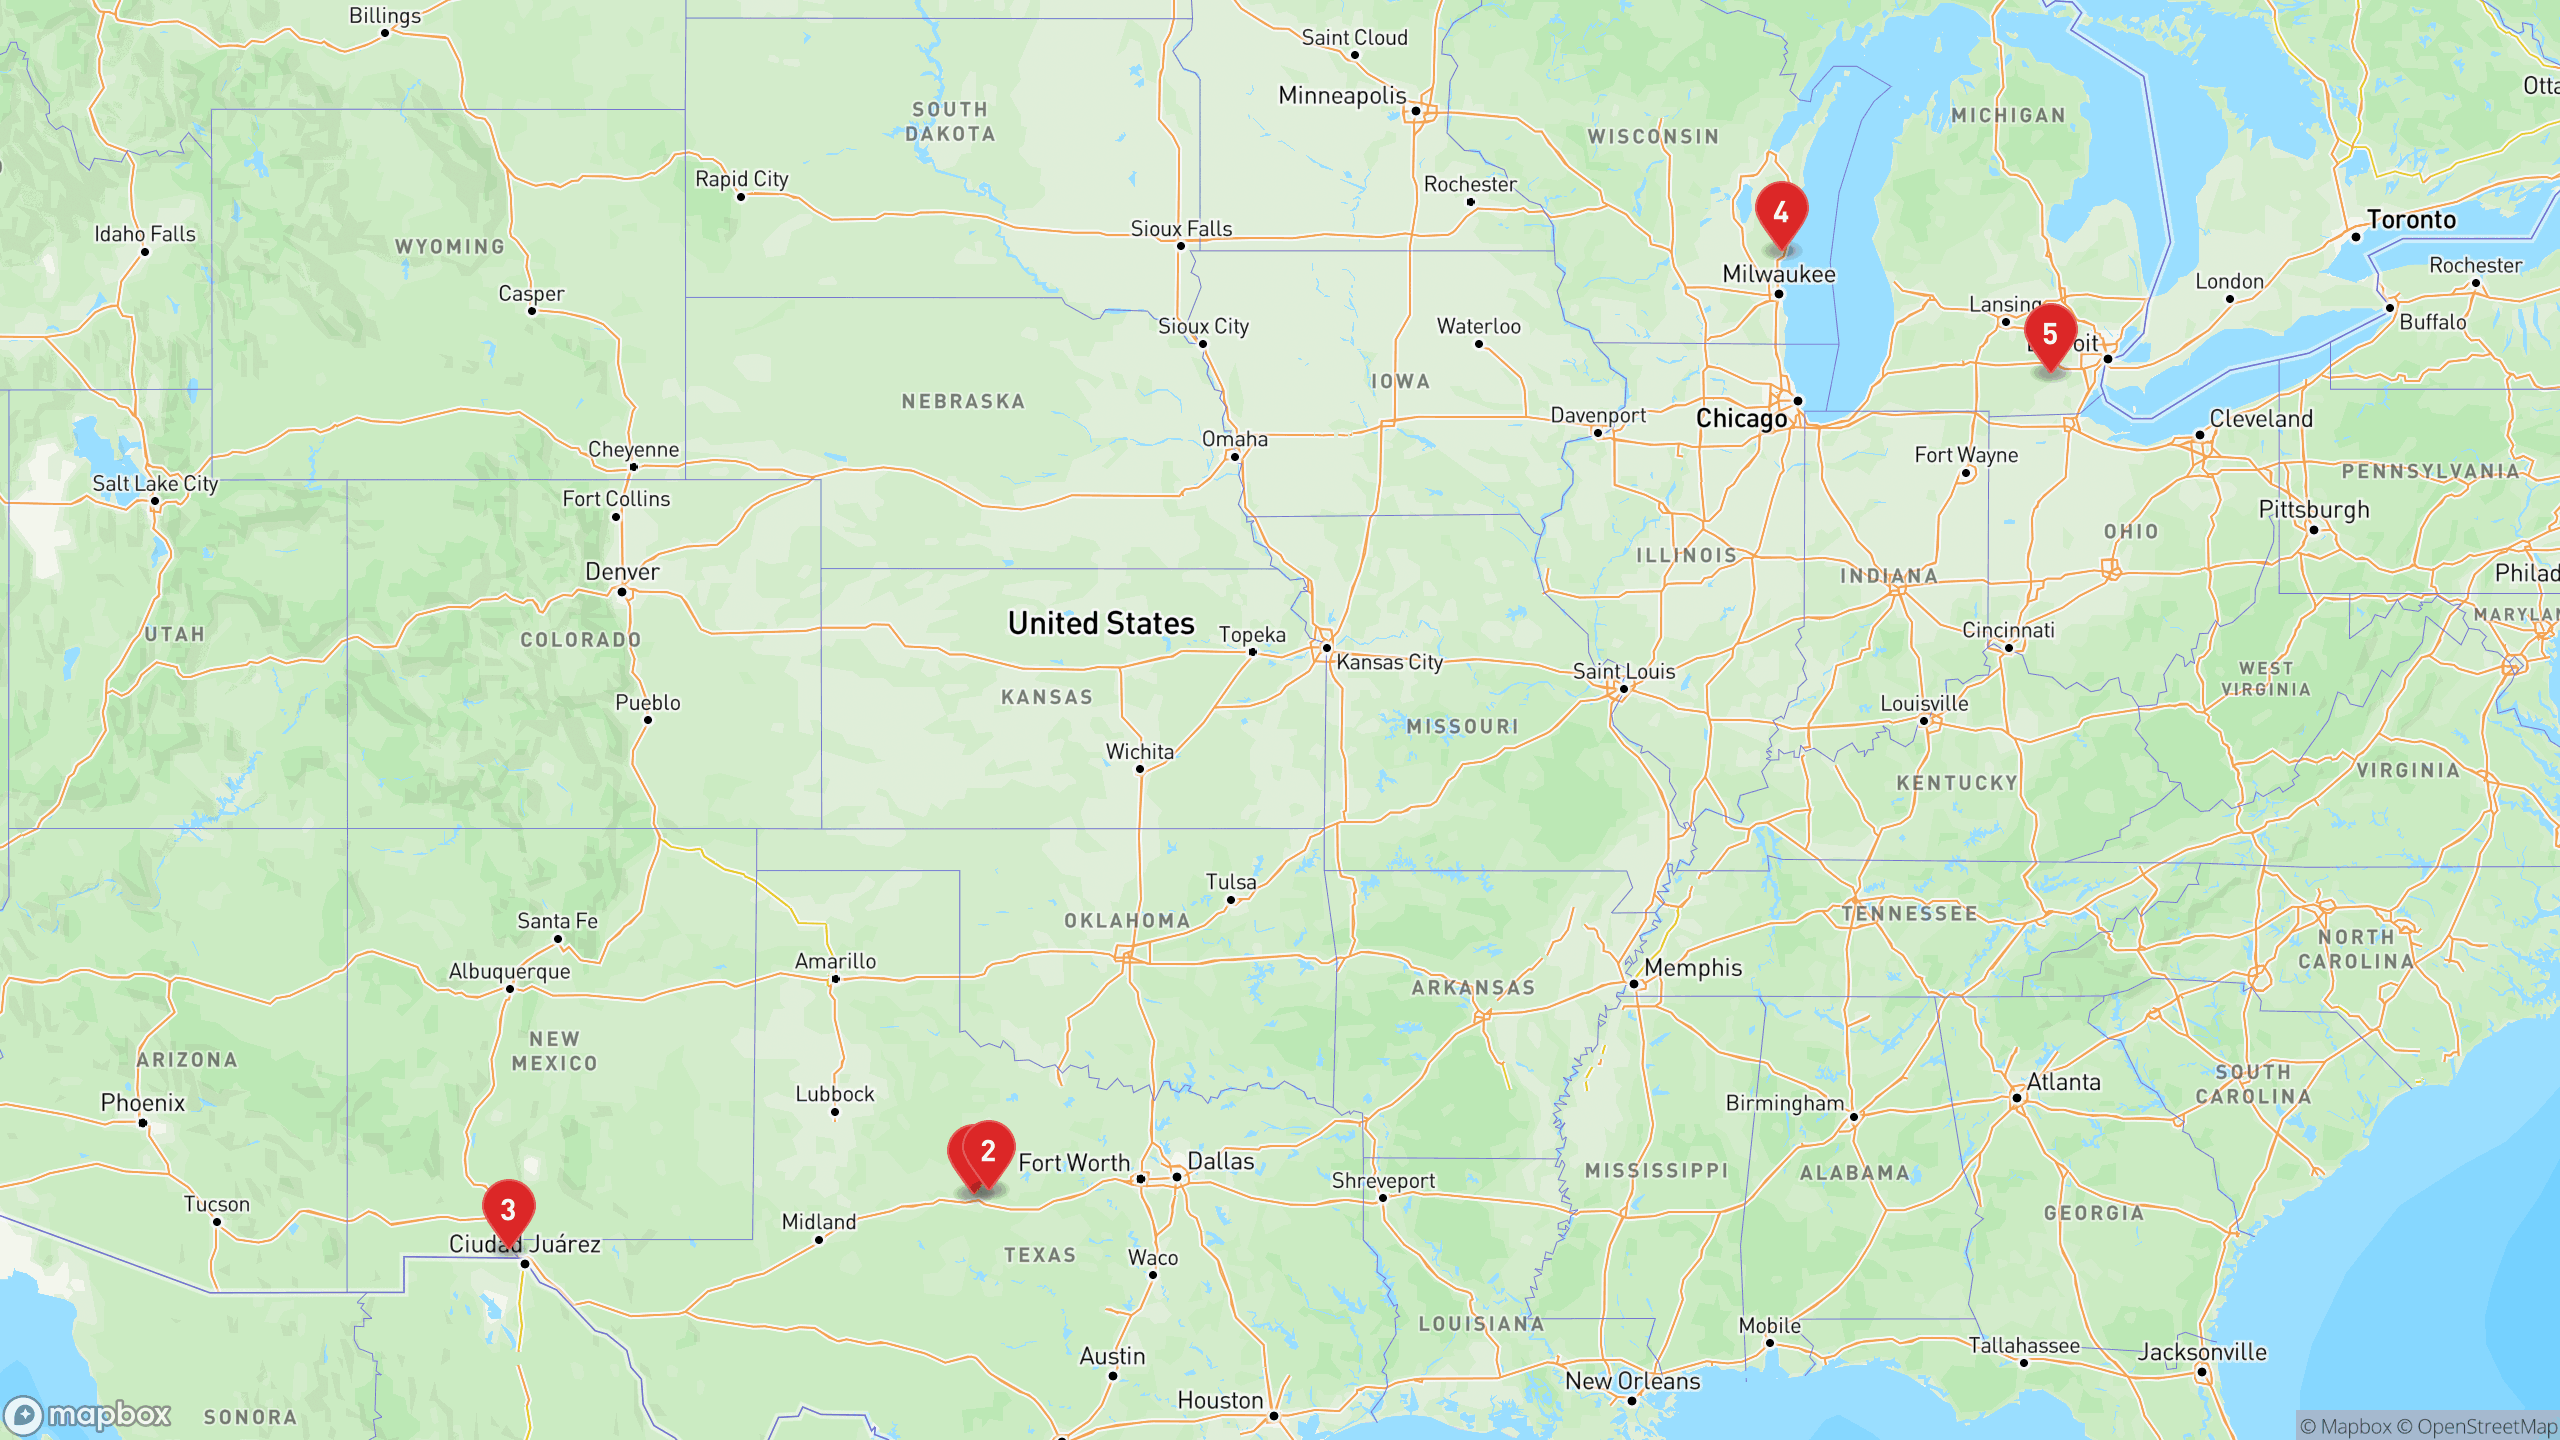
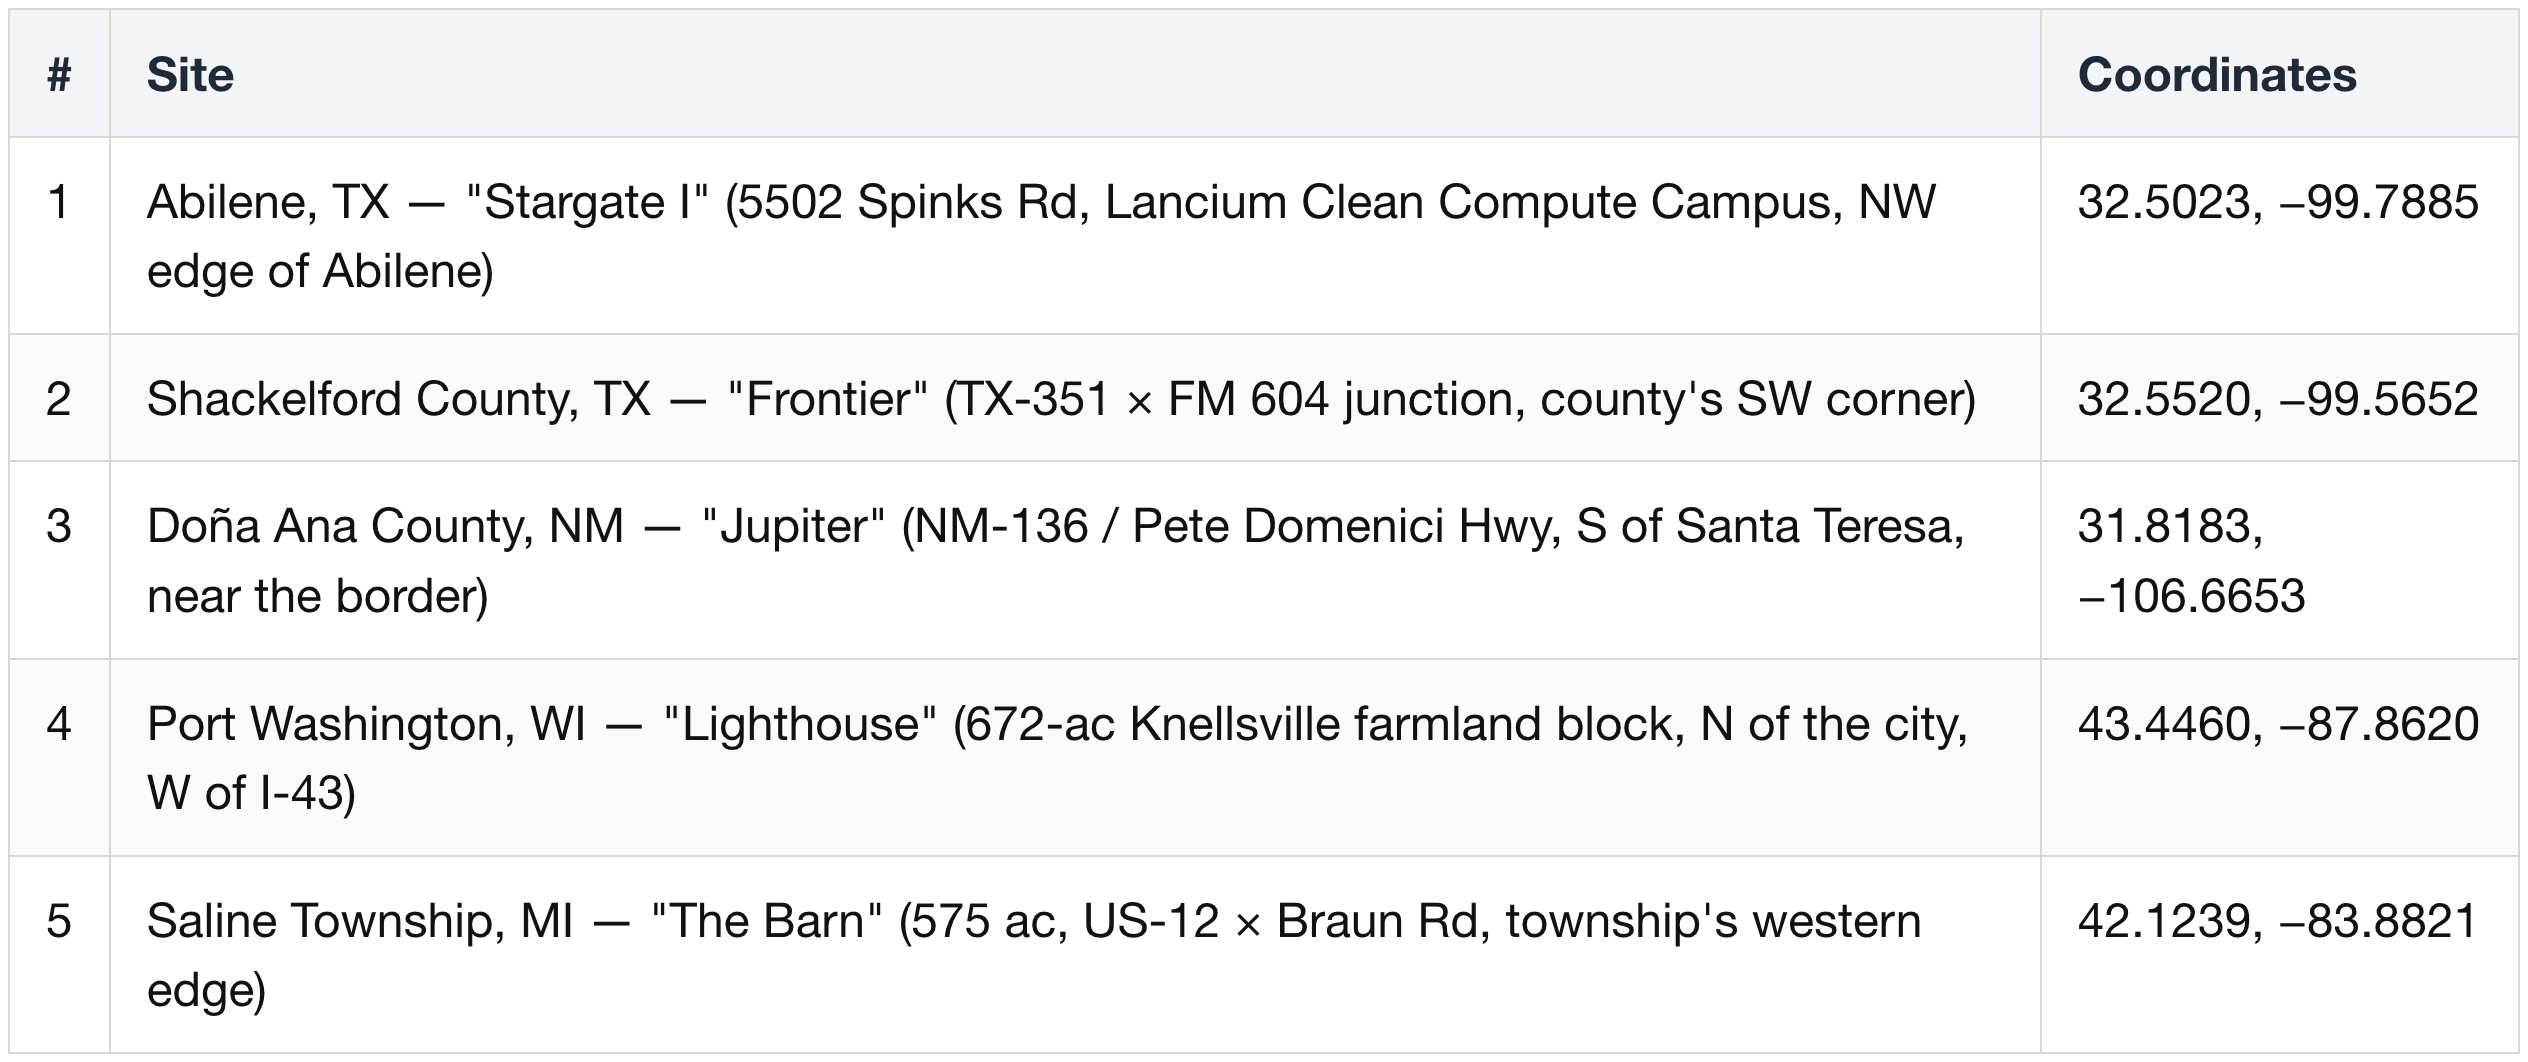
- Site-level coordinates (Epoch AI dataset addresses + OSM construction polygons + county / press records).
- Abilene and Frontier are only ~21 km apart — a deliberate West Texas cluster (13+ mi by road, per Vantage).
- Area-level: Lighthouse and Frontier (±1 km); the rest are polygon-verified.
Abilene, TX — "Stargate I"
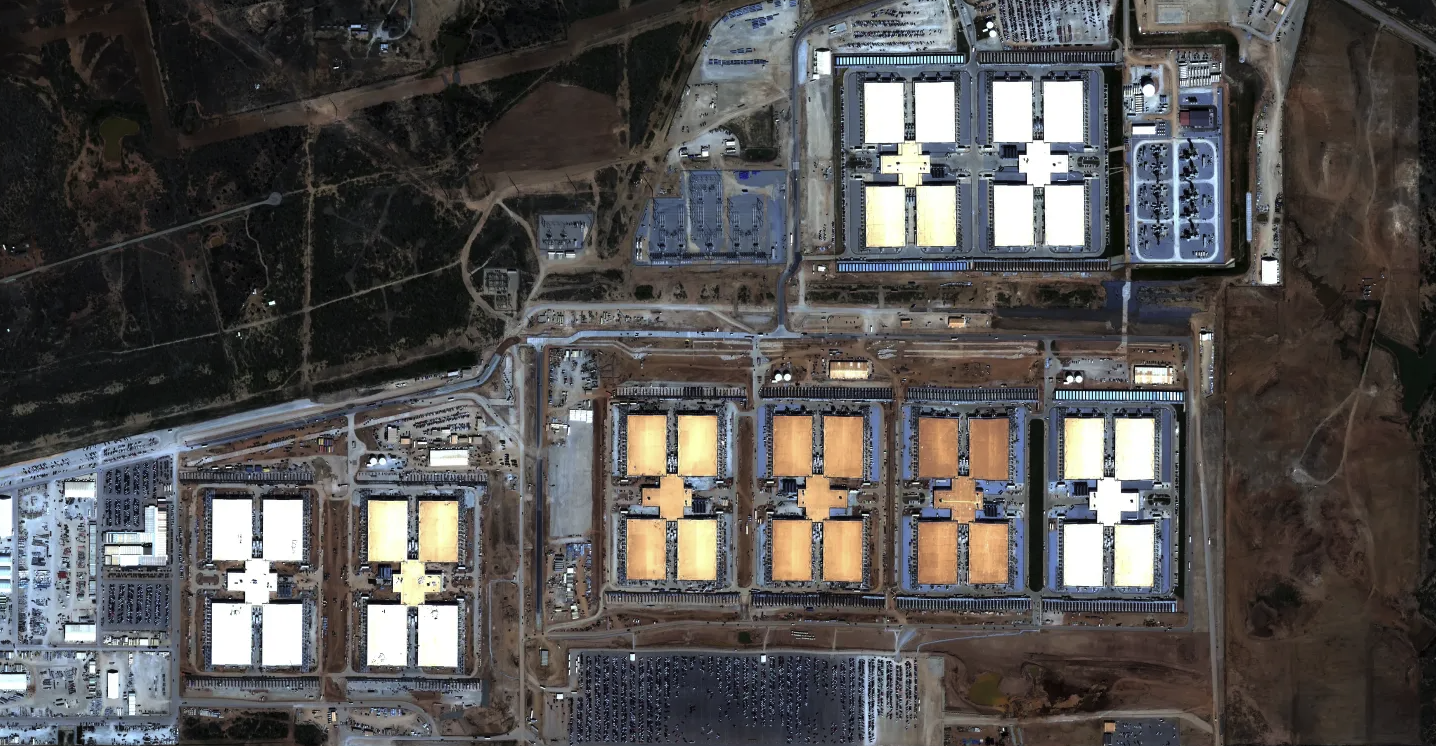
- Partners: built by a Crusoe + Blue Owl + Primary Digital JV; 15-yr lease to Oracle; end-customer OpenAI.
- Capacity: 1.2 GW (8 buildings).
- Status: 42% delivered as of Jun 2026, +35% guided within ~90 days.
- Chips: GB200 (Ellison: ~400–450k at full build, unverified).
- Financing: JPMorgan ~$2.3B phase-1 + ~$7.1B phase-2 construction loans (~$15B project).
- Note: a planned +600 MW expansion was scrapped Mar 2026 — grid-interconnection waits + OpenAI's preference to put Vera Rubin at newer sites rather than mix generations here.
- Online now: ~0.3 GW energized IT (Epoch, Apr 2026) behind the 42% "delivered"; no customer delivery until 1H CY27.
Shackelford County, TX — "Frontier"
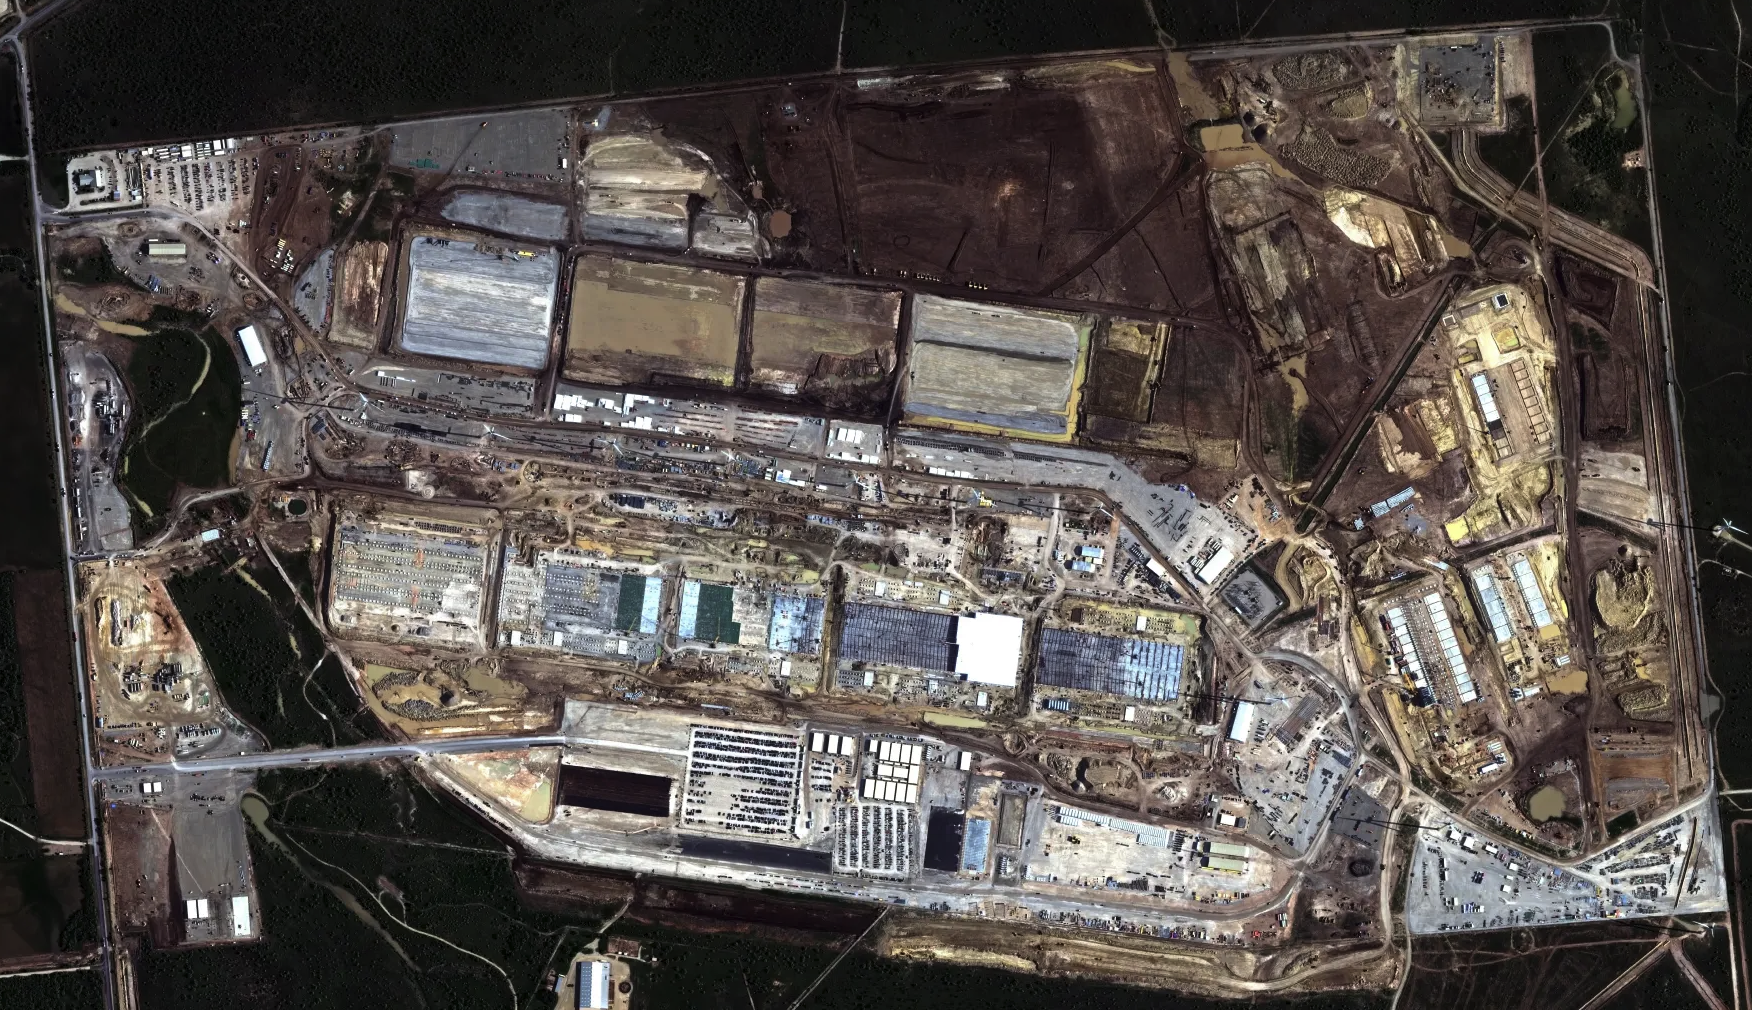
- Partners: Vantage Data Centers; leased to Oracle.
- Capacity: 1.4–2.0 GW (sources diverge).
- Status: 115 MW online >1 month ahead of schedule.
- Online: customer delivery 1H CY27; full buildout ~CY 4Q28; earmarked for Vera Rubin.
- Financing: part of Vantage's ~$23B JPM / MUFG term loan.
- Online now: 115 MW available online (>1 month ahead) — the only live Frontier capacity; customer delivery 1H CY27.
Doña Ana County, New Mexico — "Project Jupiter"
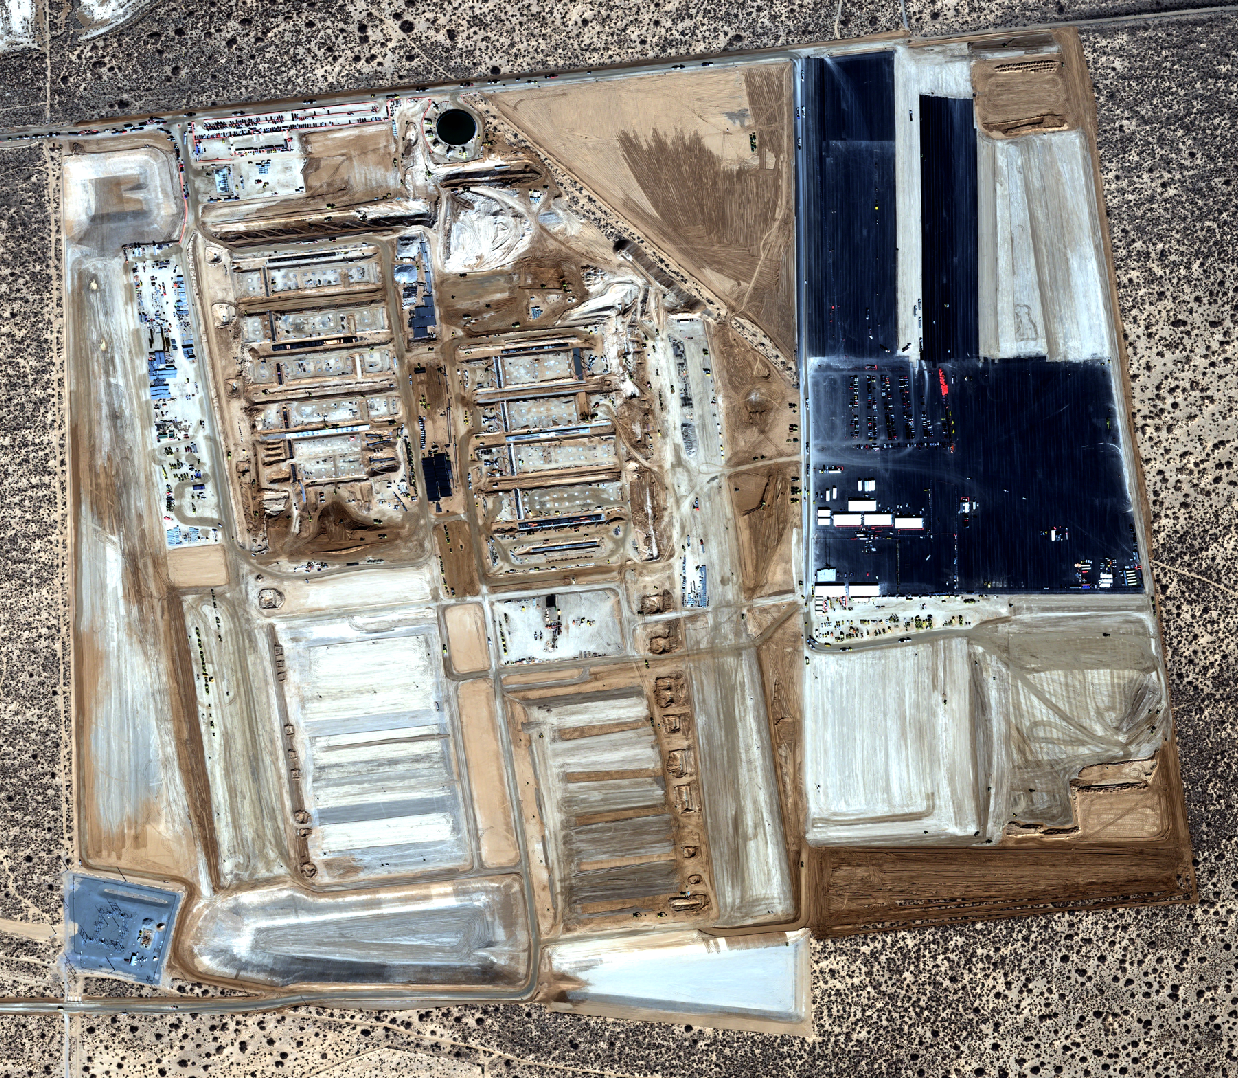
- Partners: STACK Infrastructure.
- Capacity: 2.2 GW.
- Power: designed around ~2.45 GW of Bloom Energy solid-oxide fuel cells — behind-the-meter generation (the BTM thesis in action).
- Online: delivery 1H CY27.
- Online now: 0 — forward; Bloom fuel-cell power still being stood up.
Saline Township, MI — "The Barn"
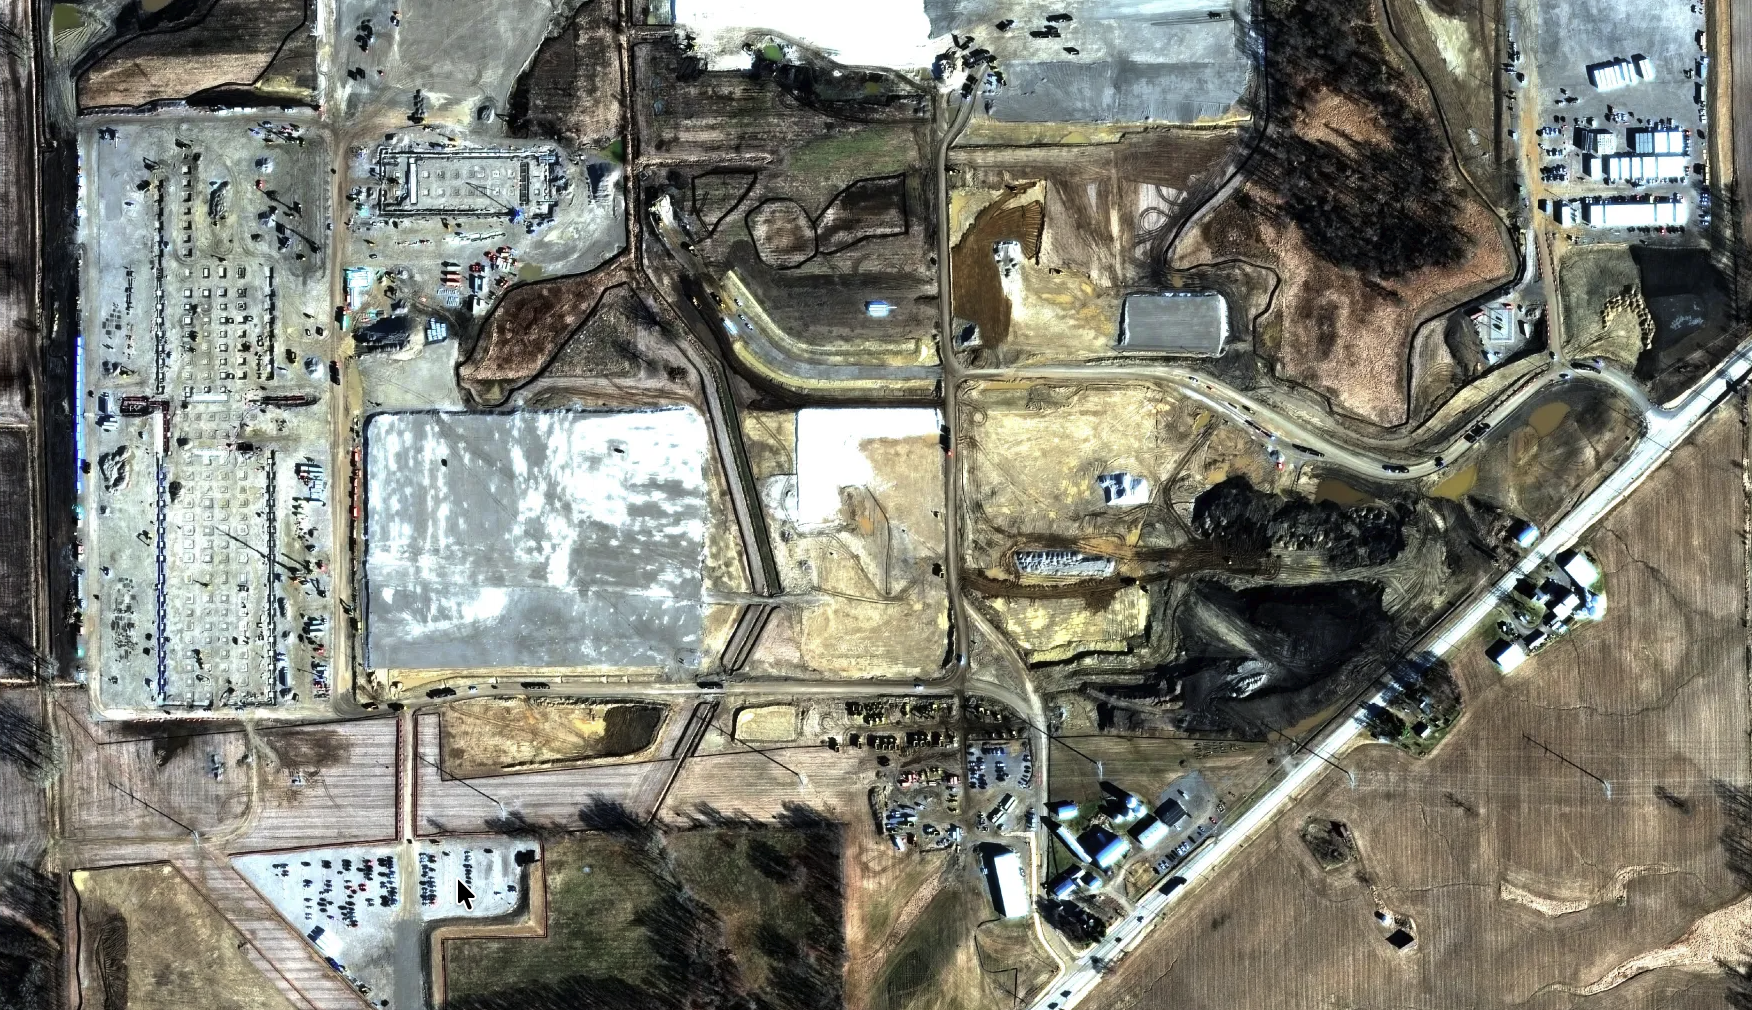
- Partners: Related Digital (+ Blackstone equity).
- Capacity: 1.4 GW (~$16B project).
- Status: construction began early 2026; network core delivered end-CY26, ahead of schedule.
- Online: delivery 2H CY27.
- Financing: BofA-arranged ~$14B project bonds (~$10B PIMCO-anchored, Apr 2026), with hell-or-high-water clauses guaranteeing Oracle's lease payments regardless of utilization.
- Online now: 0 — forward; network core end-CY26, customer delivery 2H CY27.
Port Washington, WI — "Lighthouse"
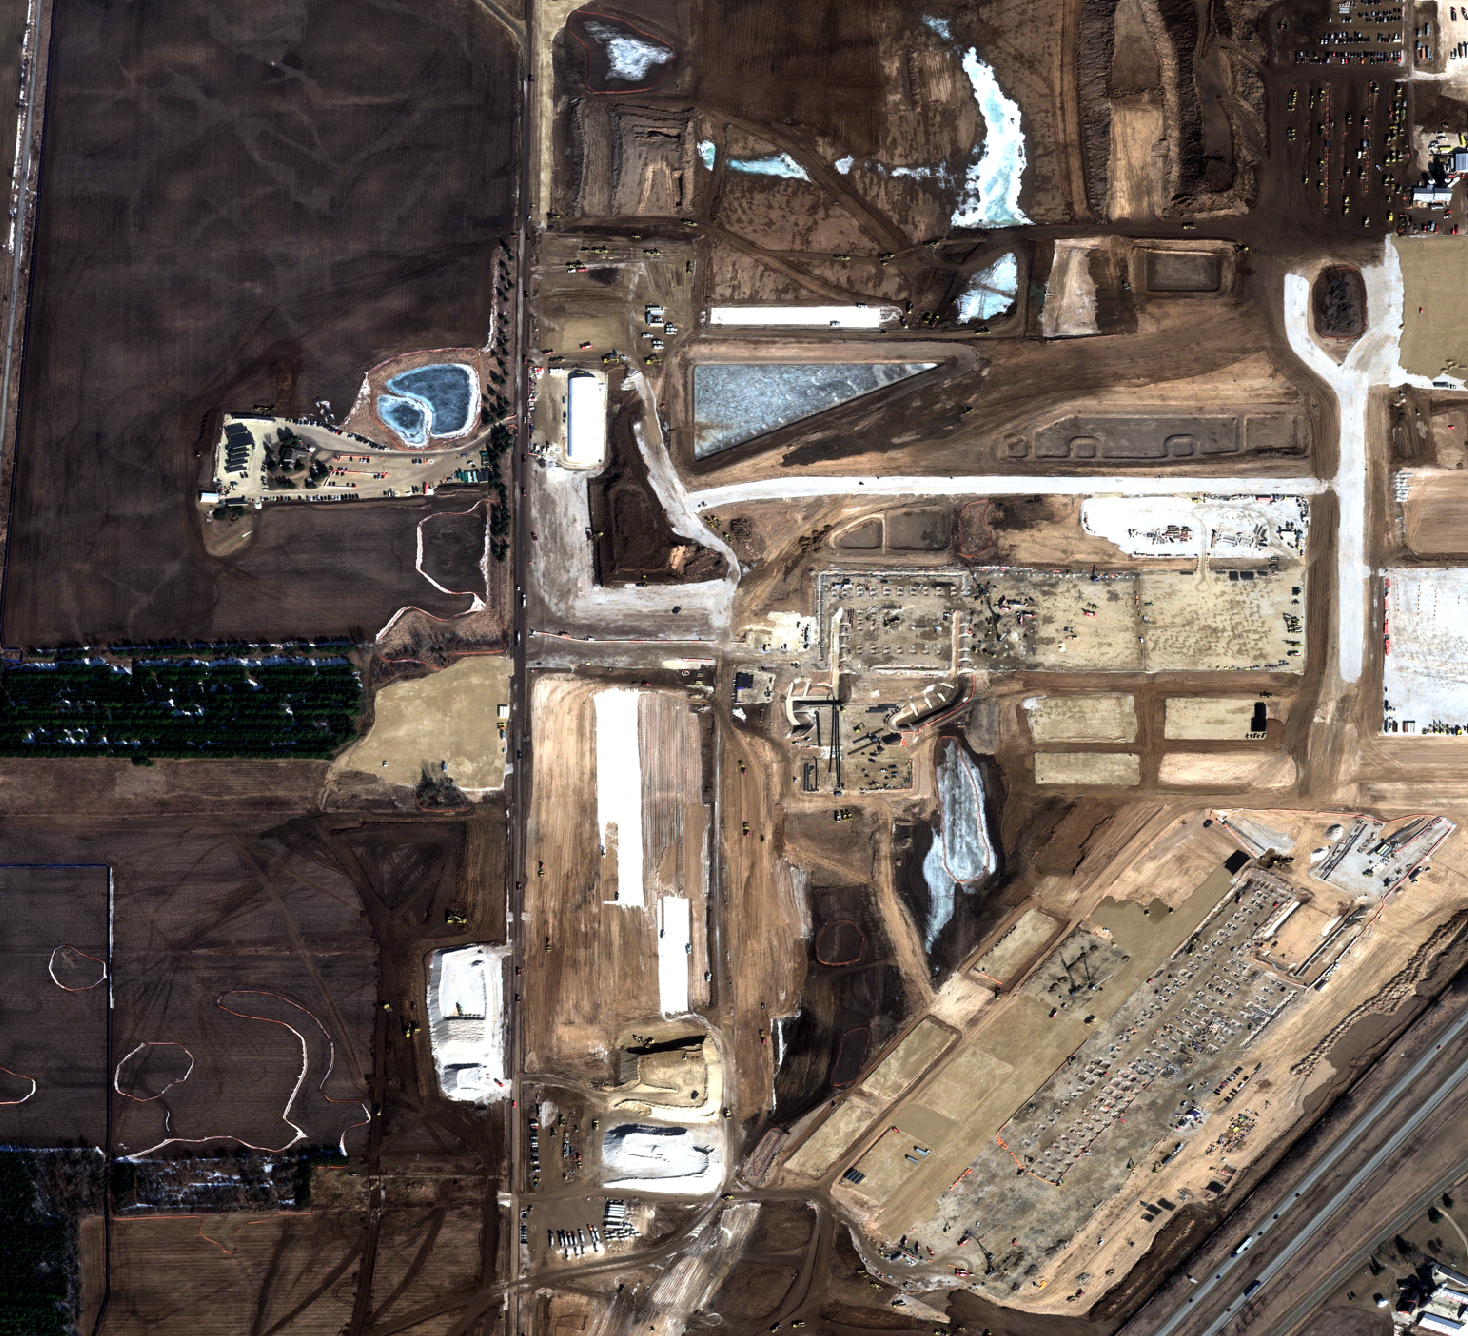
- Partners: Vantage.
- Capacity: 1.3 GW.
- Online: delivery 2H CY27.
- Financing: part of Vantage's ~$15B Lighthouse term loan.
- Online now: 0 — forward; delivery 2H CY27.
SoftBank-side Stargate sites (not Oracle — context only)
The other half of the Stargate JV (OpenAI + Oracle + SoftBank). No OCI lease or revenue; listed so the full US Stargate footprint (~9.6 GW) is visible — the ~1.5 GW here sits on SoftBank's side, not in Oracle's 8.1 GW.
Milam County, TX
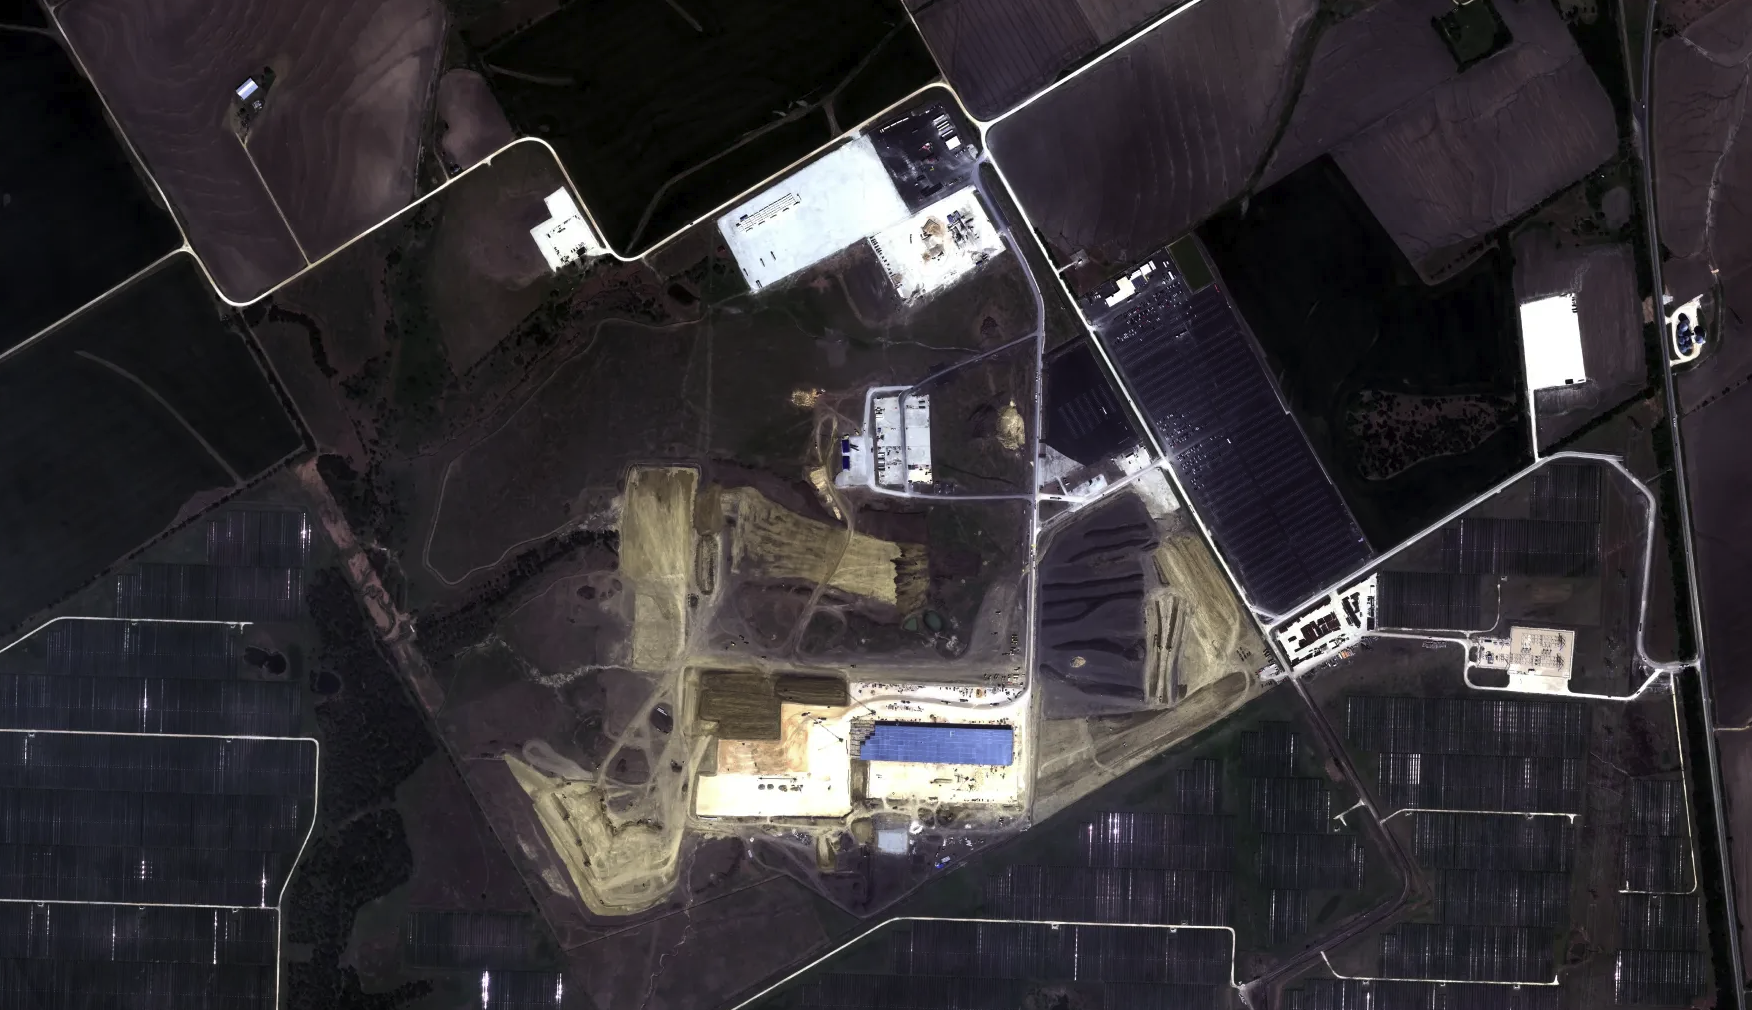
- Developer: SB Energy (SoftBank subsidiary).
- Capacity: 1.2 GW projected (0 today).
- Timeline: construction CY 3Q25 → completion CY 4Q28; first building Oct 2026.
- Detail: "fast-build" site ~70 mi NE of Austin; on-site generation (type unspecified), SoftBank funding new energy + storage.
Lordstown, OH
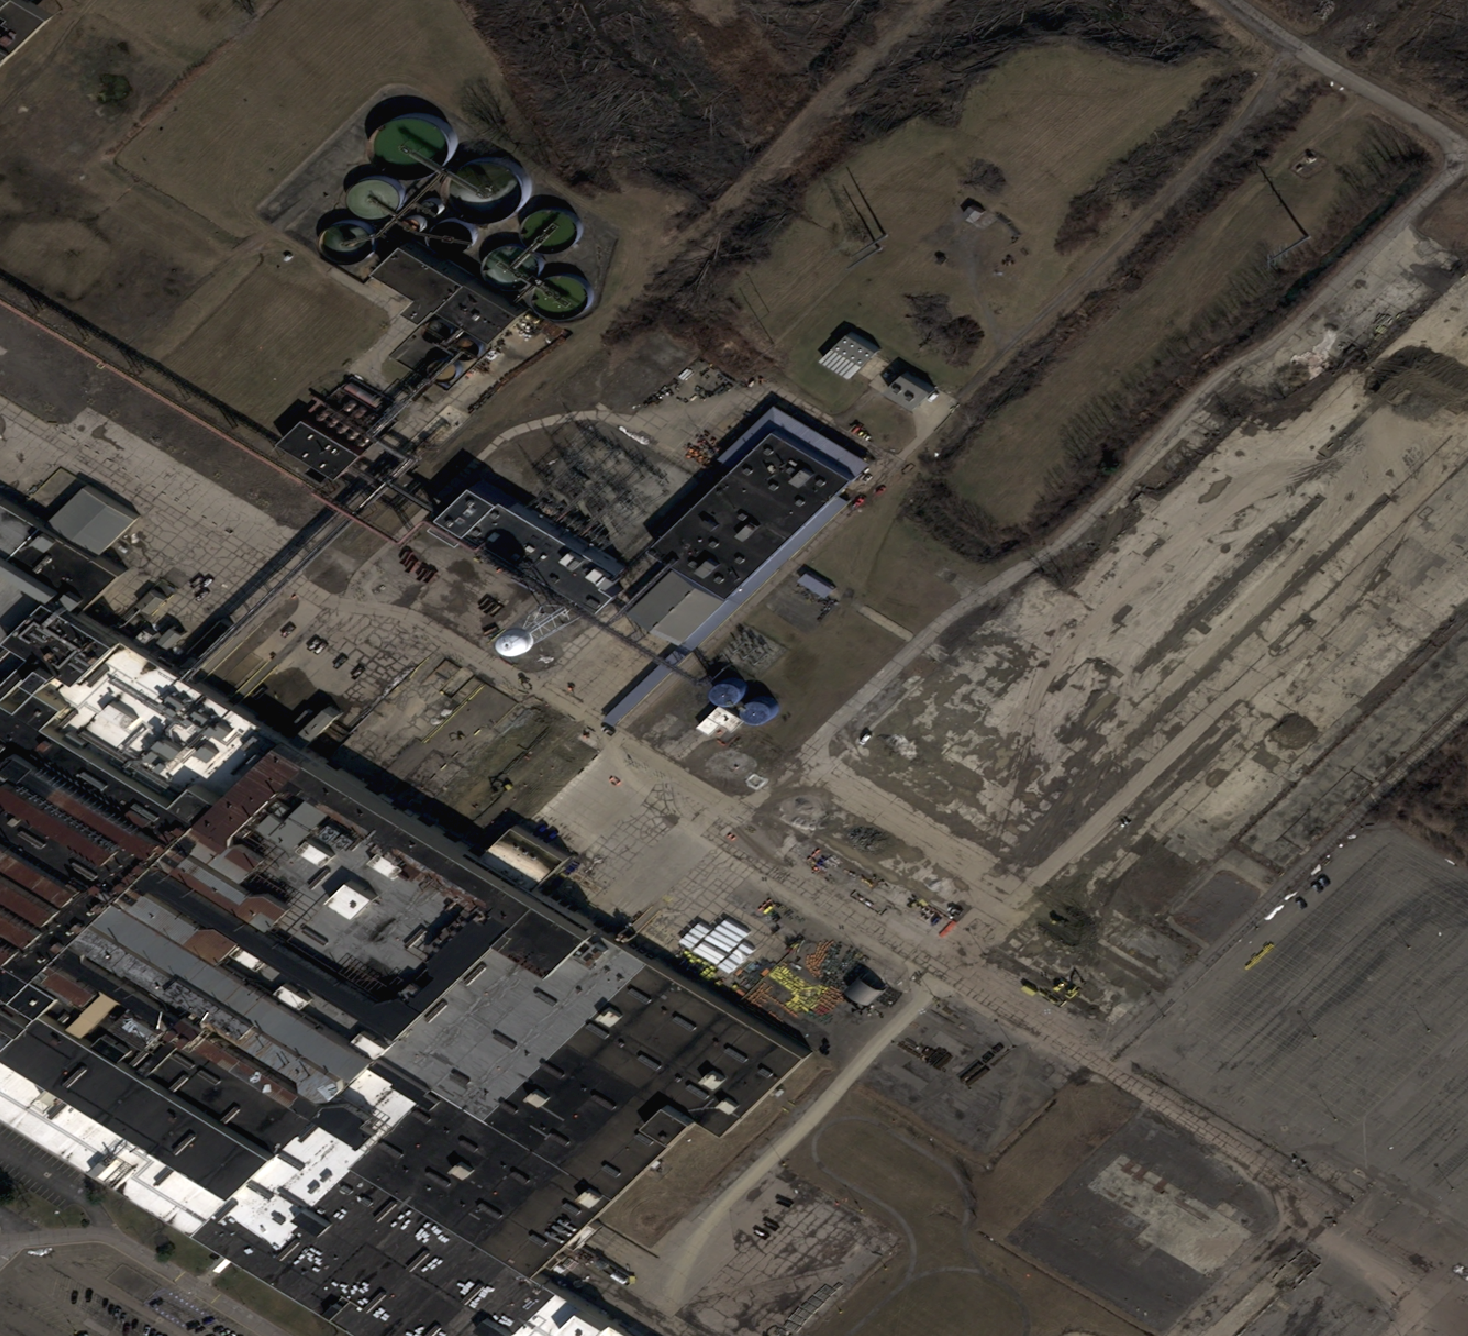
- Developer: SoftBank / Foxconn JV.
- Capacity: <0.3 GW projected (0 today).
- Timeline: construction CY 4Q25; completion unknown.
- Detail: primarily an AI-server manufacturing facility (minimal datacenter build); grid via an existing Foxconn substation; a local datacenter ban was later enacted.
SpaceX (AI segment)
- Terrestrial — the Colossus complex (Memphis TN / Southaven MS): ~2 GW across three buildings, ~555,000 GPUs bought for ~$18B — the largest single-site AI installation.
- Power is substantially off-grid gas; orbital compute is a long-dated option (below).
The sites:
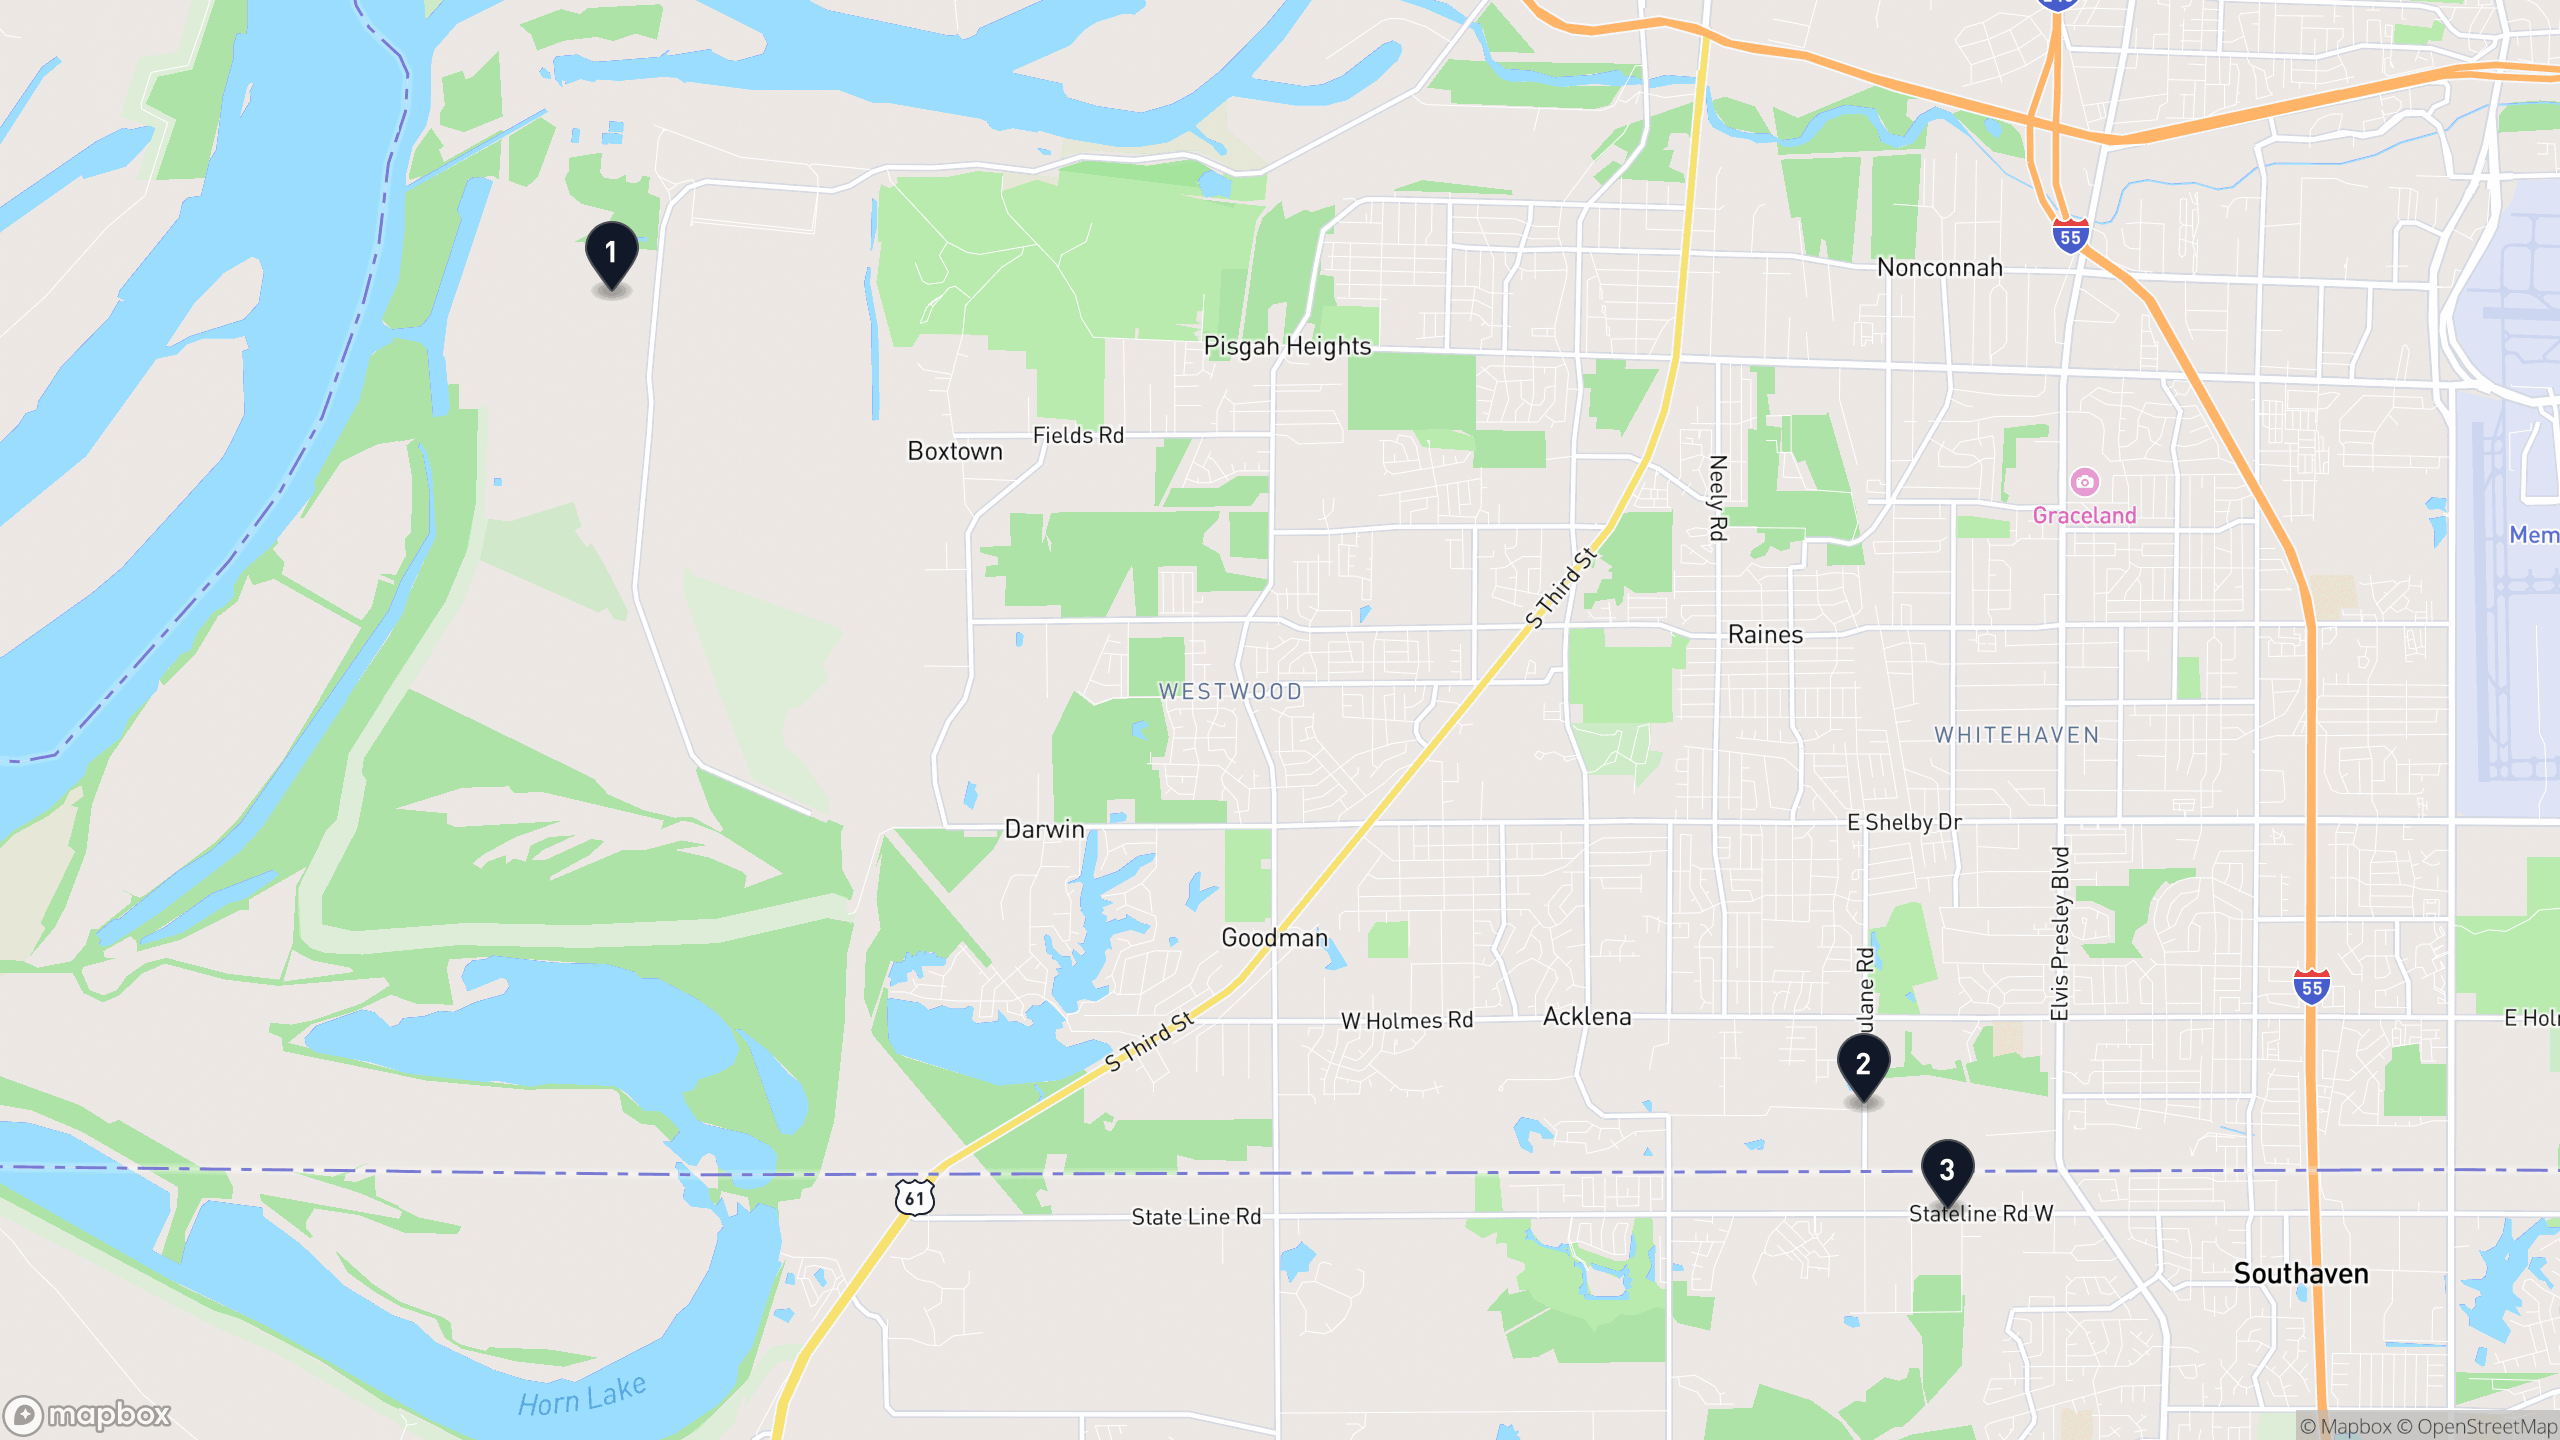
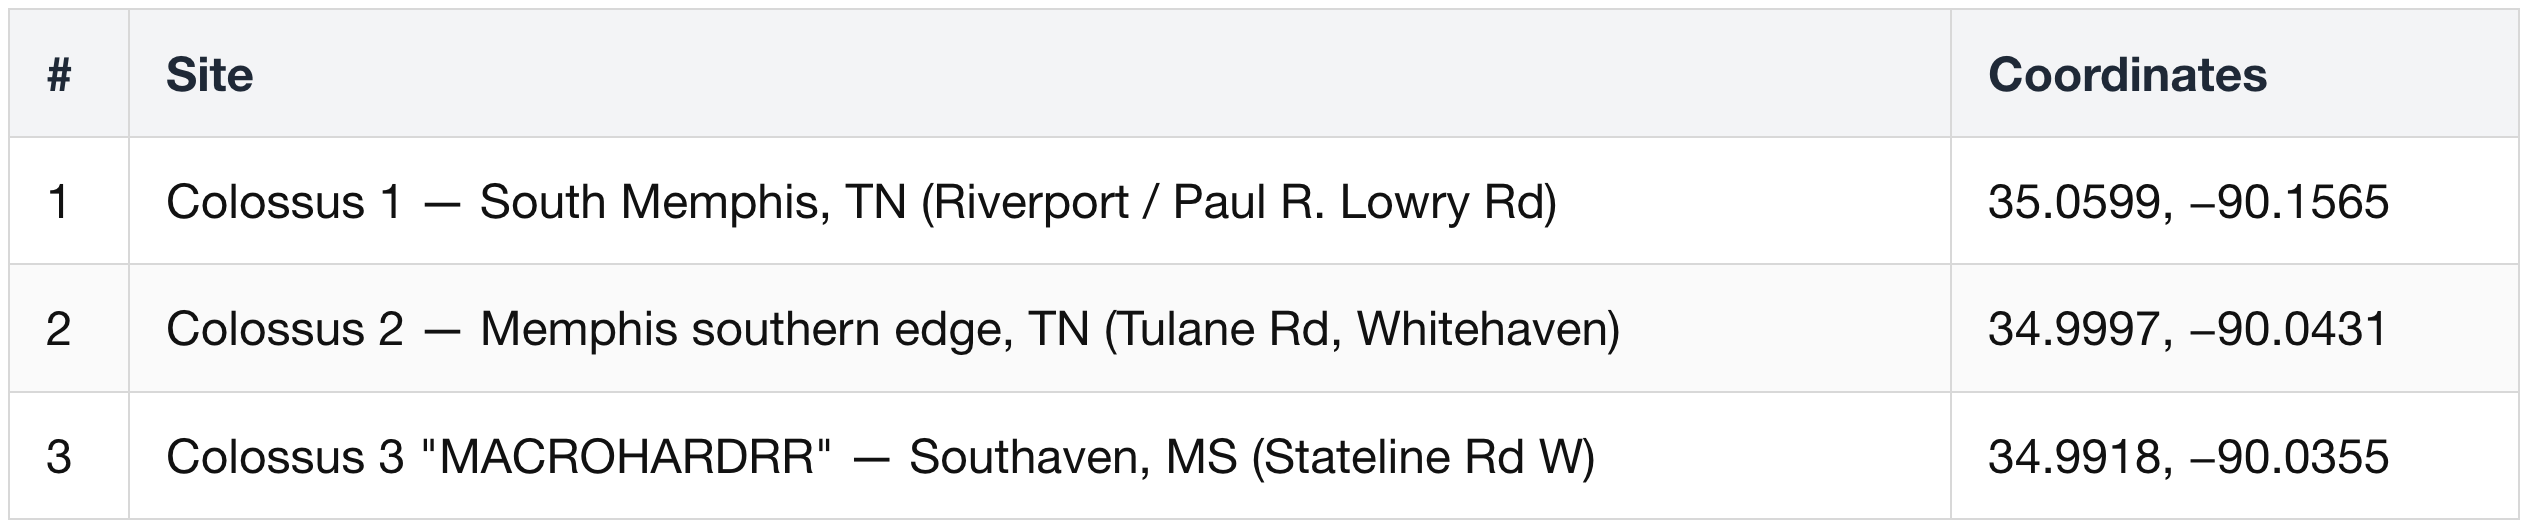
- Site-level coordinates (street addresses, not town centroids).
- Colossus 2 and 3 sit ~1 km apart across the TN / MS state line — effectively one campus (the S-1's "COLOSSUS II = Memphis + Southaven").
- Colossus 1 is ~11 km northwest, in the Riverport industrial zone.
- Colossus 3 pinned at Stateline Rd W (approximate within the corridor).
The corporate frame — three segments, one cash engine
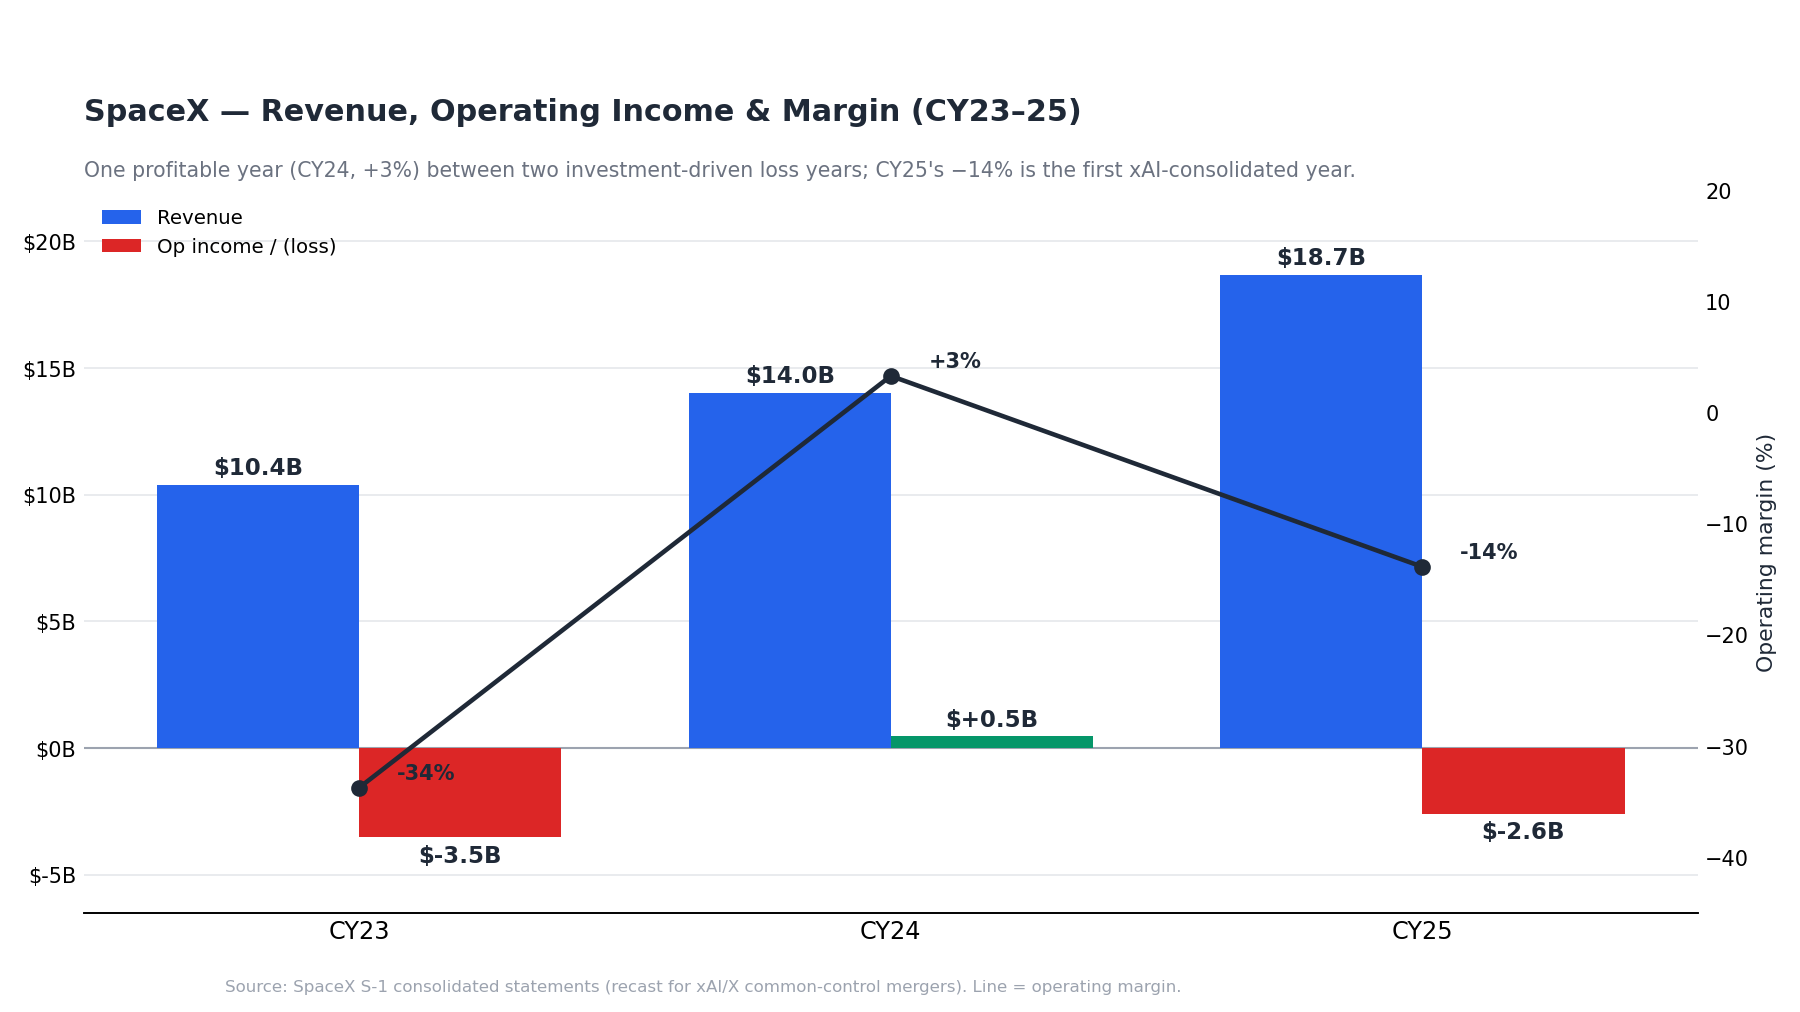
- Consolidated (S-1): revenue $10.4B (CY23) → $14.0B (CY24) → $18.7B (CY25, +33%); operating margin −34% → +3% → −14%; adj. EBITDA $6.58B.
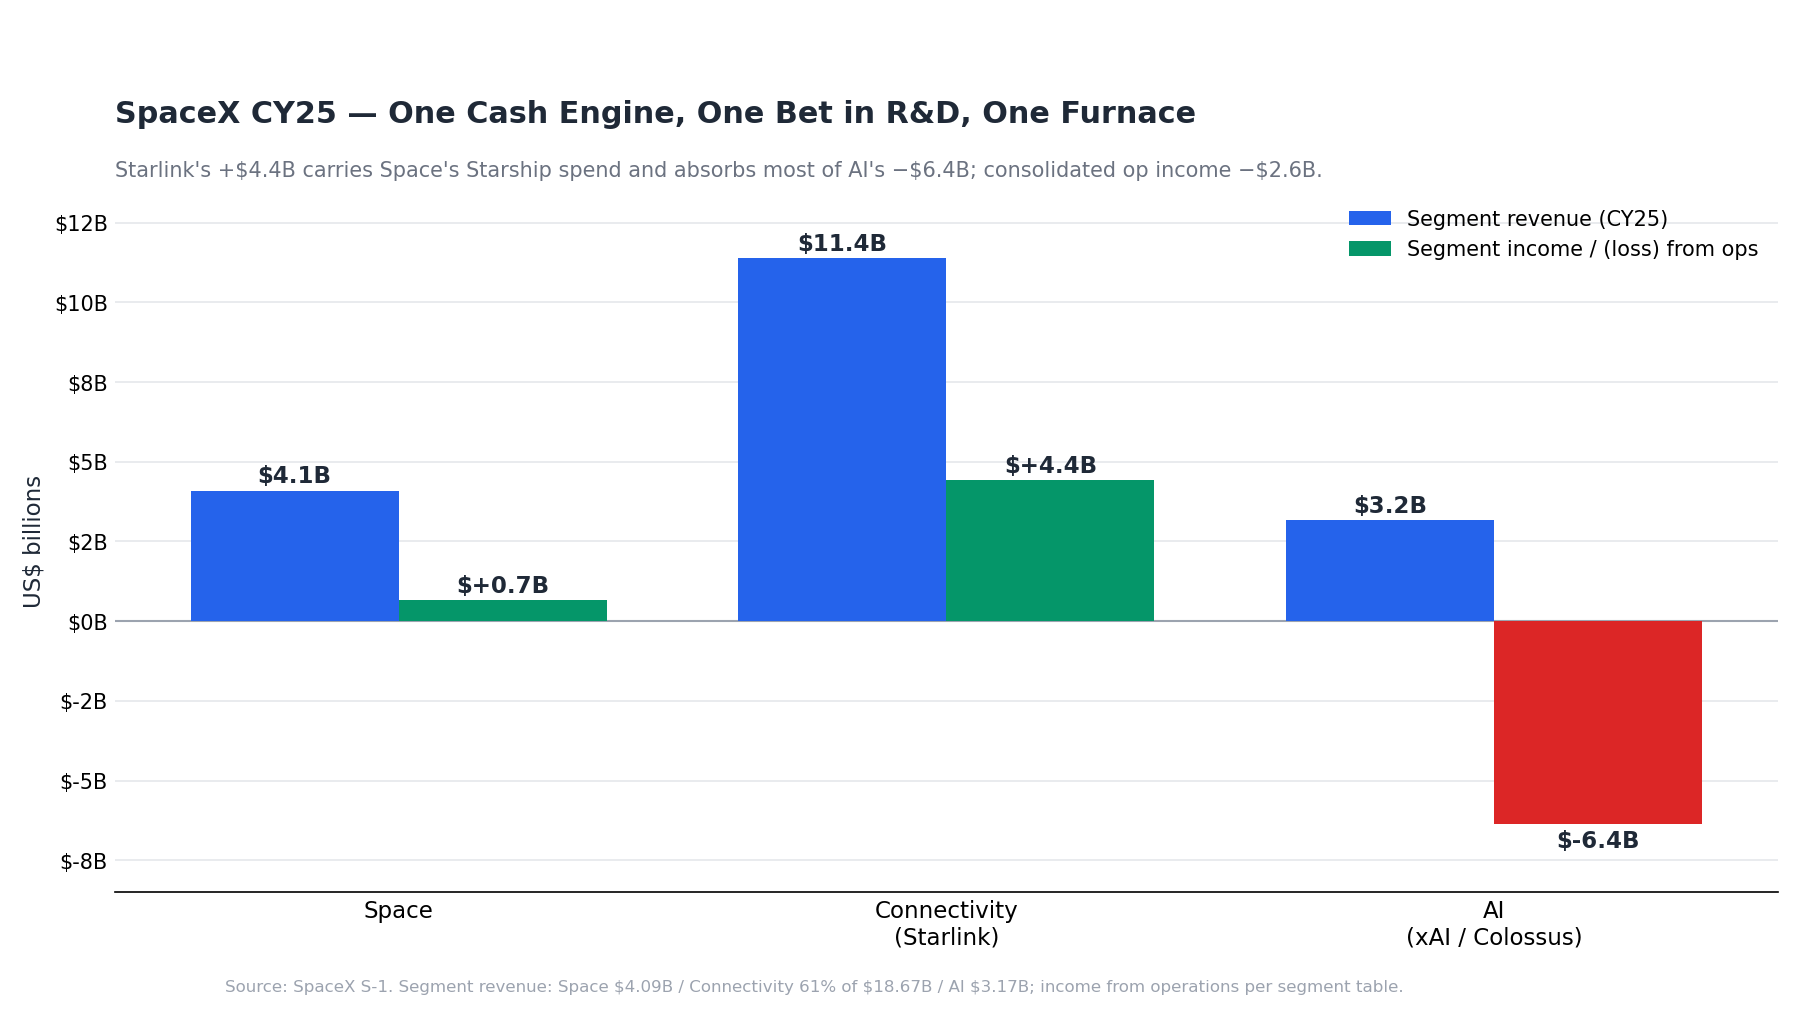
CY25 segment economics: Starlink's +$4.4B carries Space's Starship R&D (+$0.7B) and absorbs most of AI's −$6.4B. Consolidated op income −$2.6B.
- CY25 revenue mix: Connectivity (Starlink) 61% / Space 22% / AI 17%.
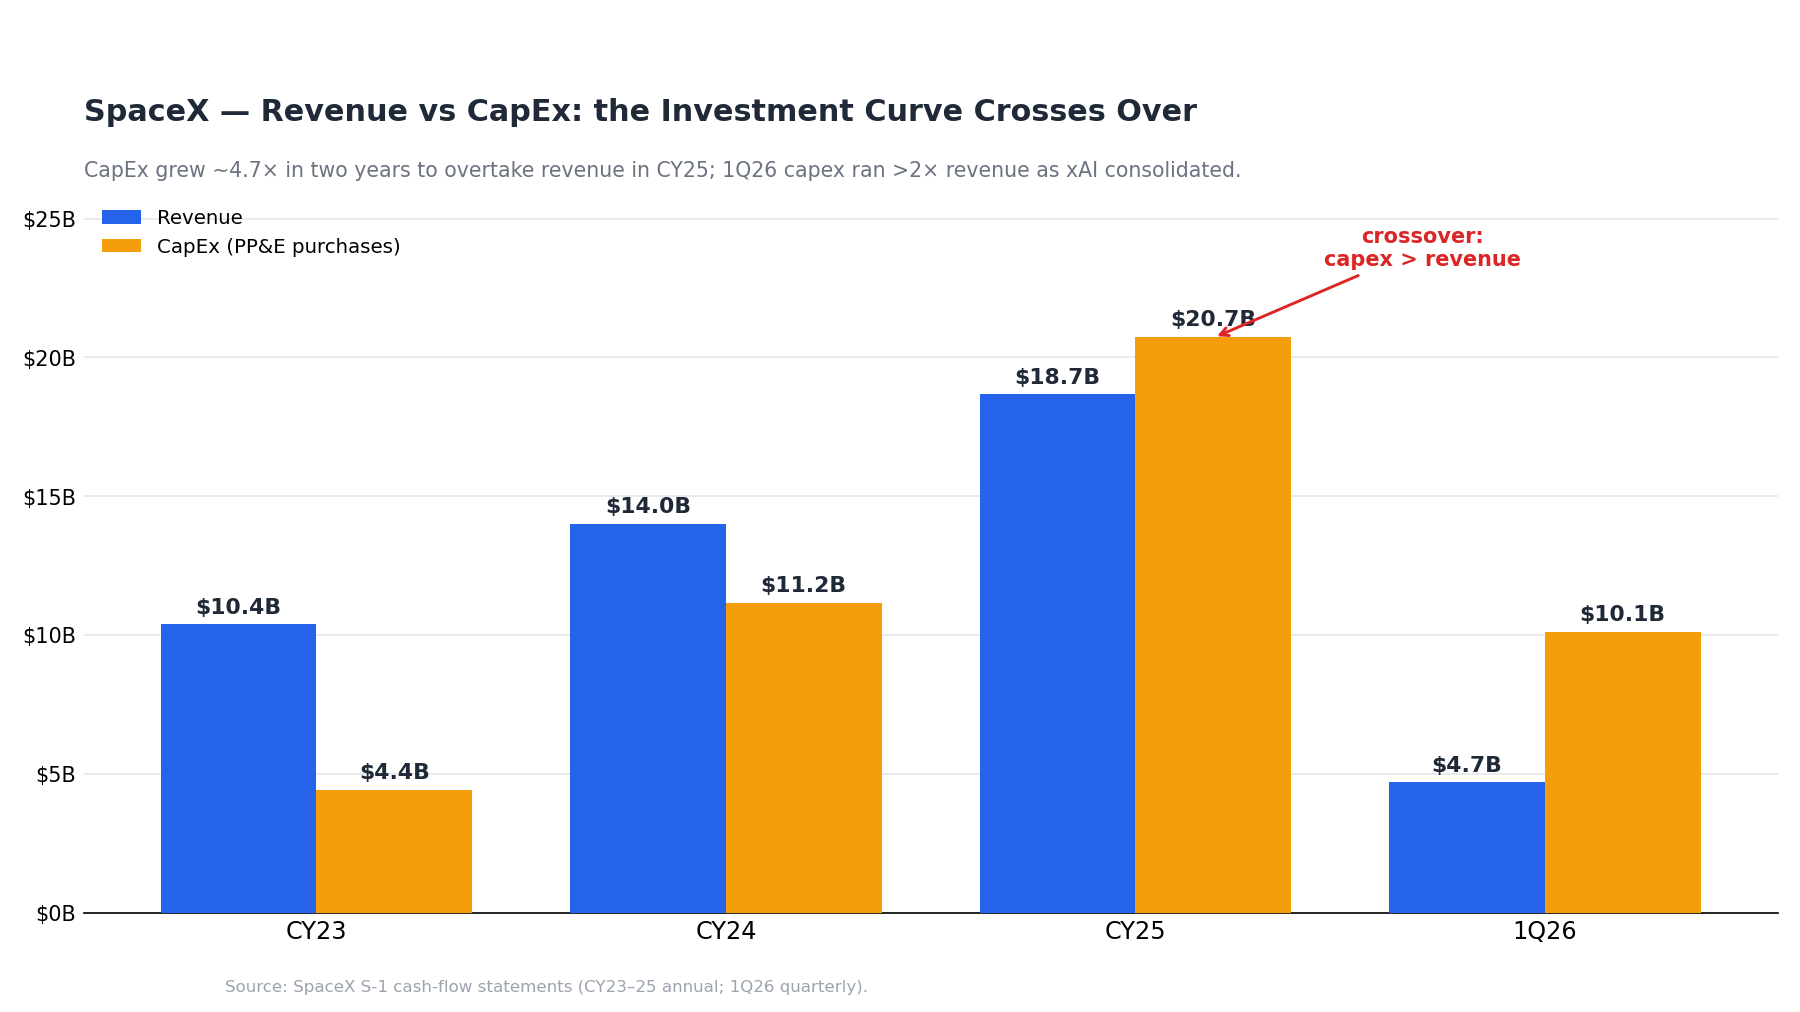
- Capex now exceeds revenue:
- CY25: capex $20.7B vs revenue $18.7B.
- CY 1Q26: capex $10.1B vs revenue $4.7B — over 2×, while revenue growth decelerated to +15% YoY (CY 1Q26 is also the first quarter consolidating xAI).
- The xAI merger, precisely (S-1):
- X.AI Holdings folded into SpaceX effective 2026-02-02 (the "xAI Merger");
- X itself had been acquired by xAI effective 2025-03-28 (the "X Merger").
- Both were common-control transactions, so all historical financials are retrospectively recast — the CY23–24 "SpaceX" numbers above already contain xAI/X. A 5-for-1 stock split followed 2026-05-04.
- Post-IPO float is ~4.5–5% — a thin free float on a ~$2T market cap; the stock moves on small flows. It thickens on a staggered lock-up-release schedule:
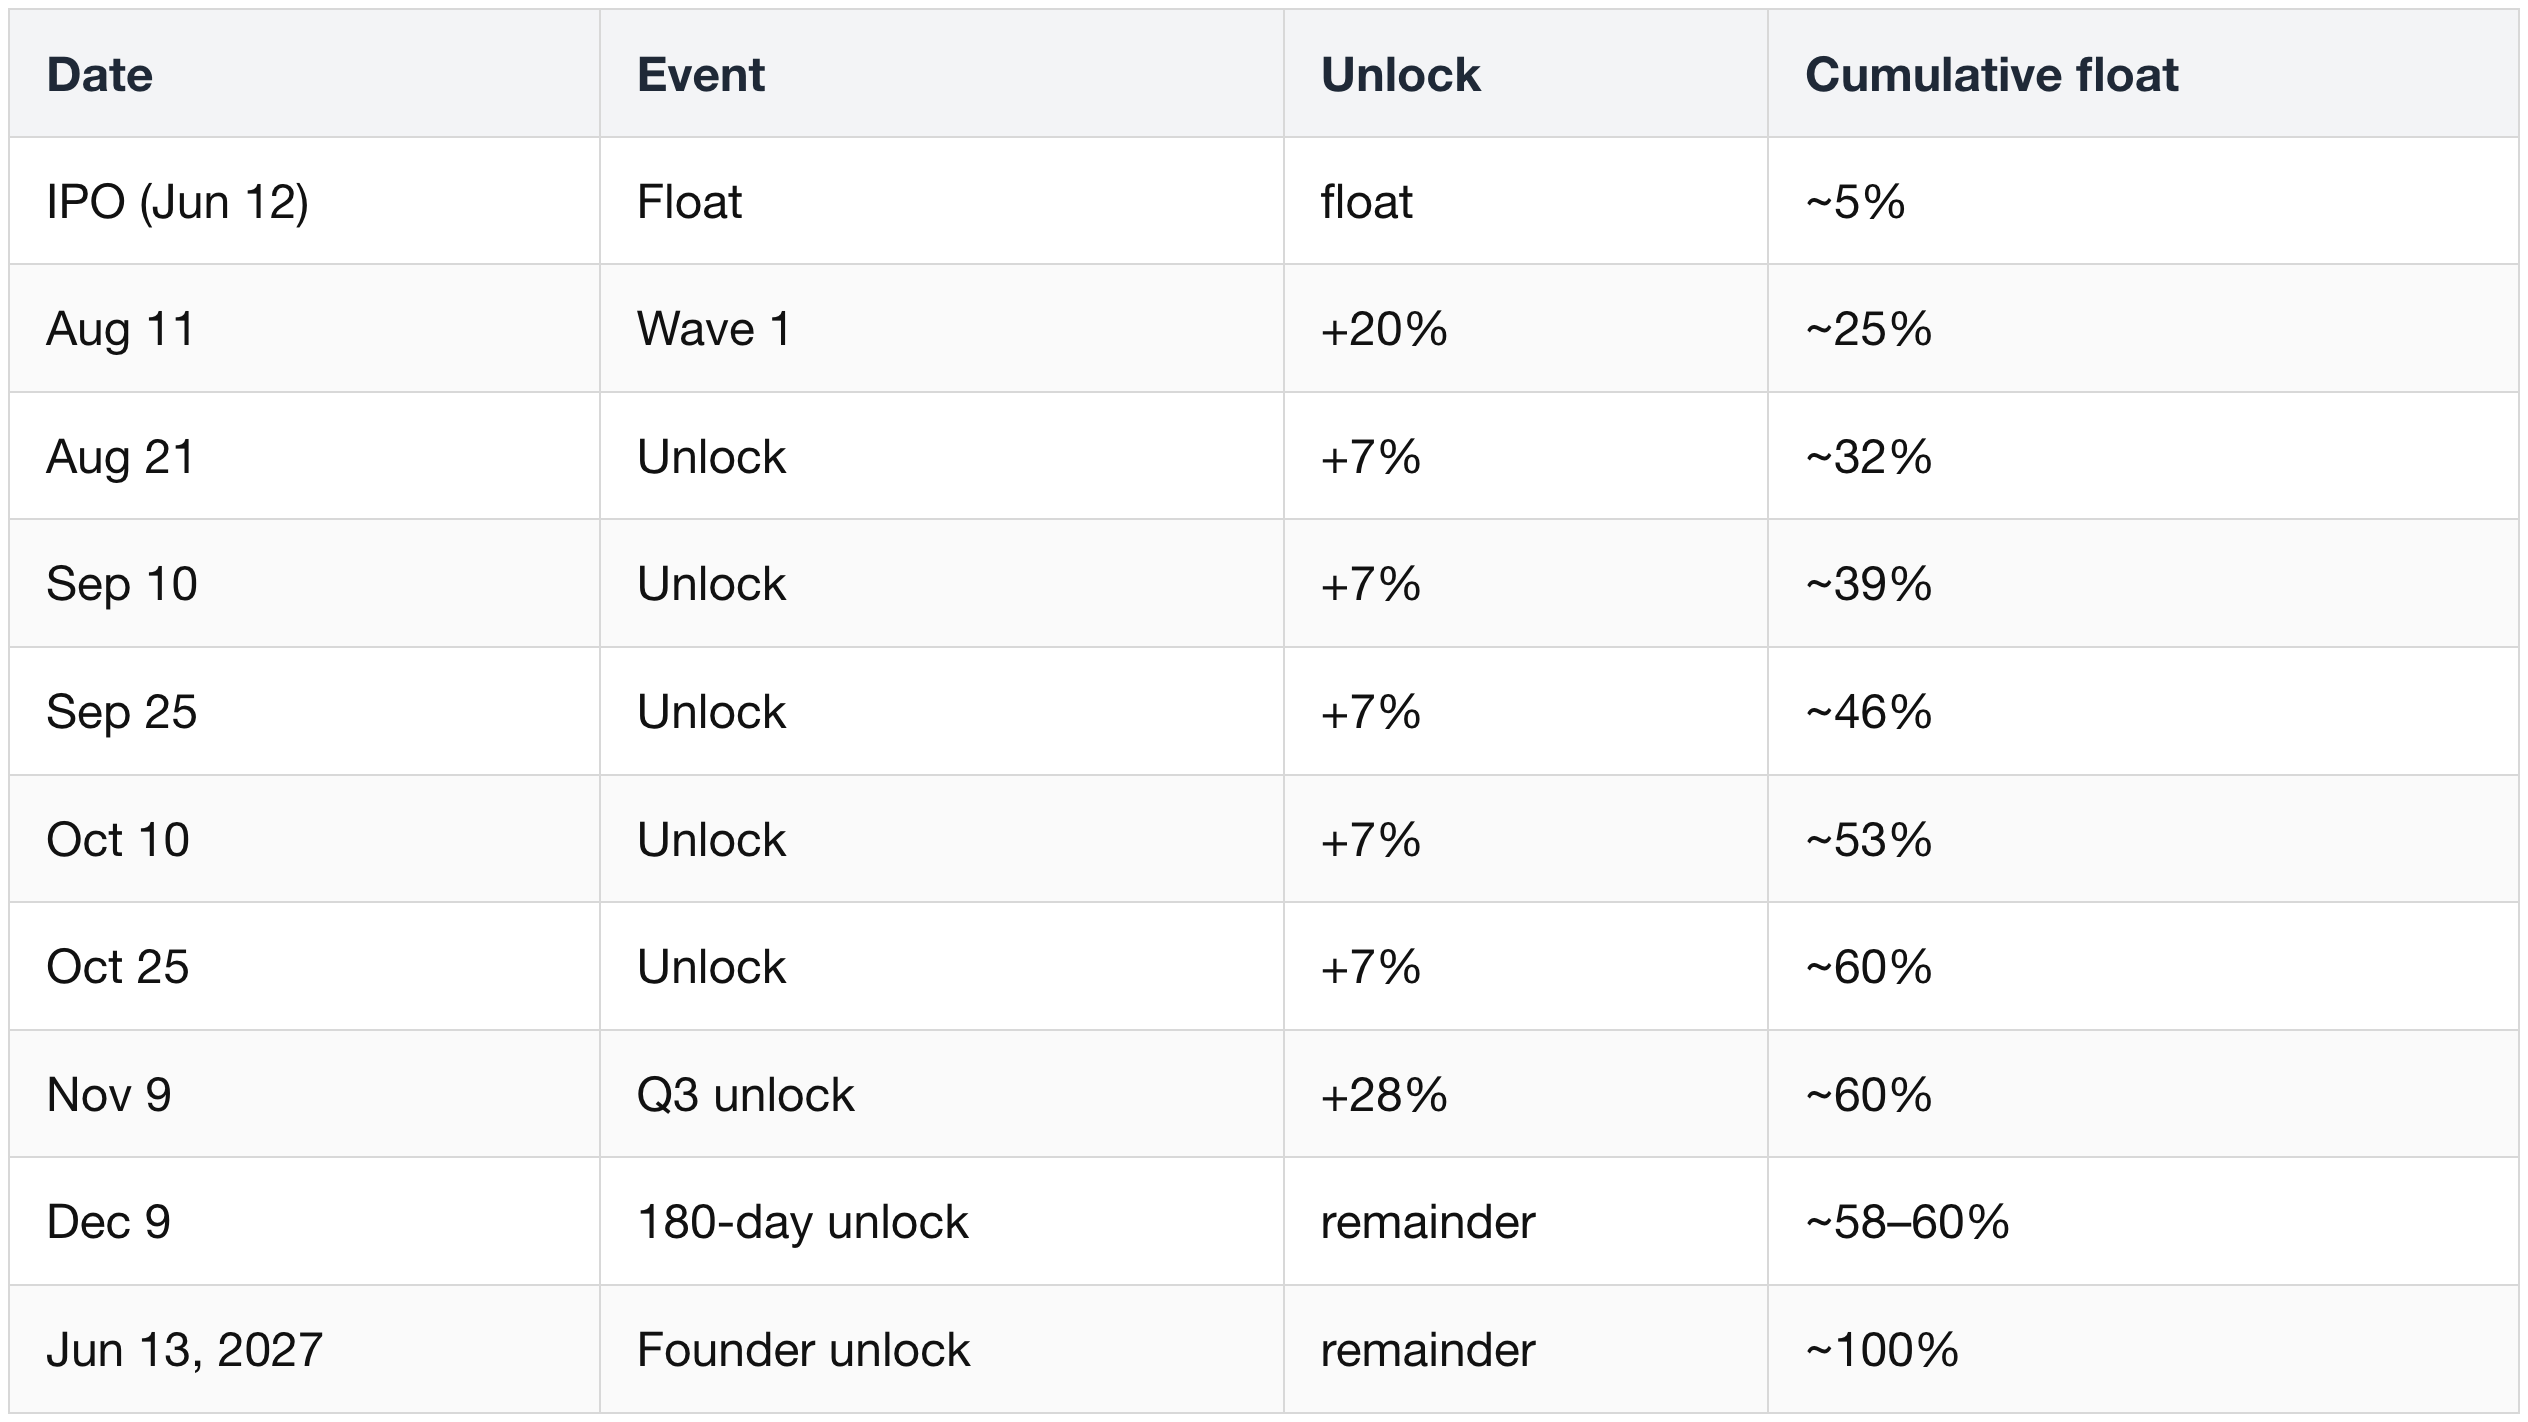
Free float climbs from ~5% at IPO toward ~60% by the Dec 9 180-day expiry, then to ~100% once the founder lock-up releases Jun 2027. The Nov CY 3Q26 and Dec 180-day waves overlap the weekly tranches, so the cumulative column holds ~60% rather than summing linearly.
The S-1's own risk framing, verbatim:
"Our ability to execute our growth strategy is highly dependent on the successful development and scaling of Starship and the ability to increase our launch cadence." (S-1)
Starlink — the cash cow
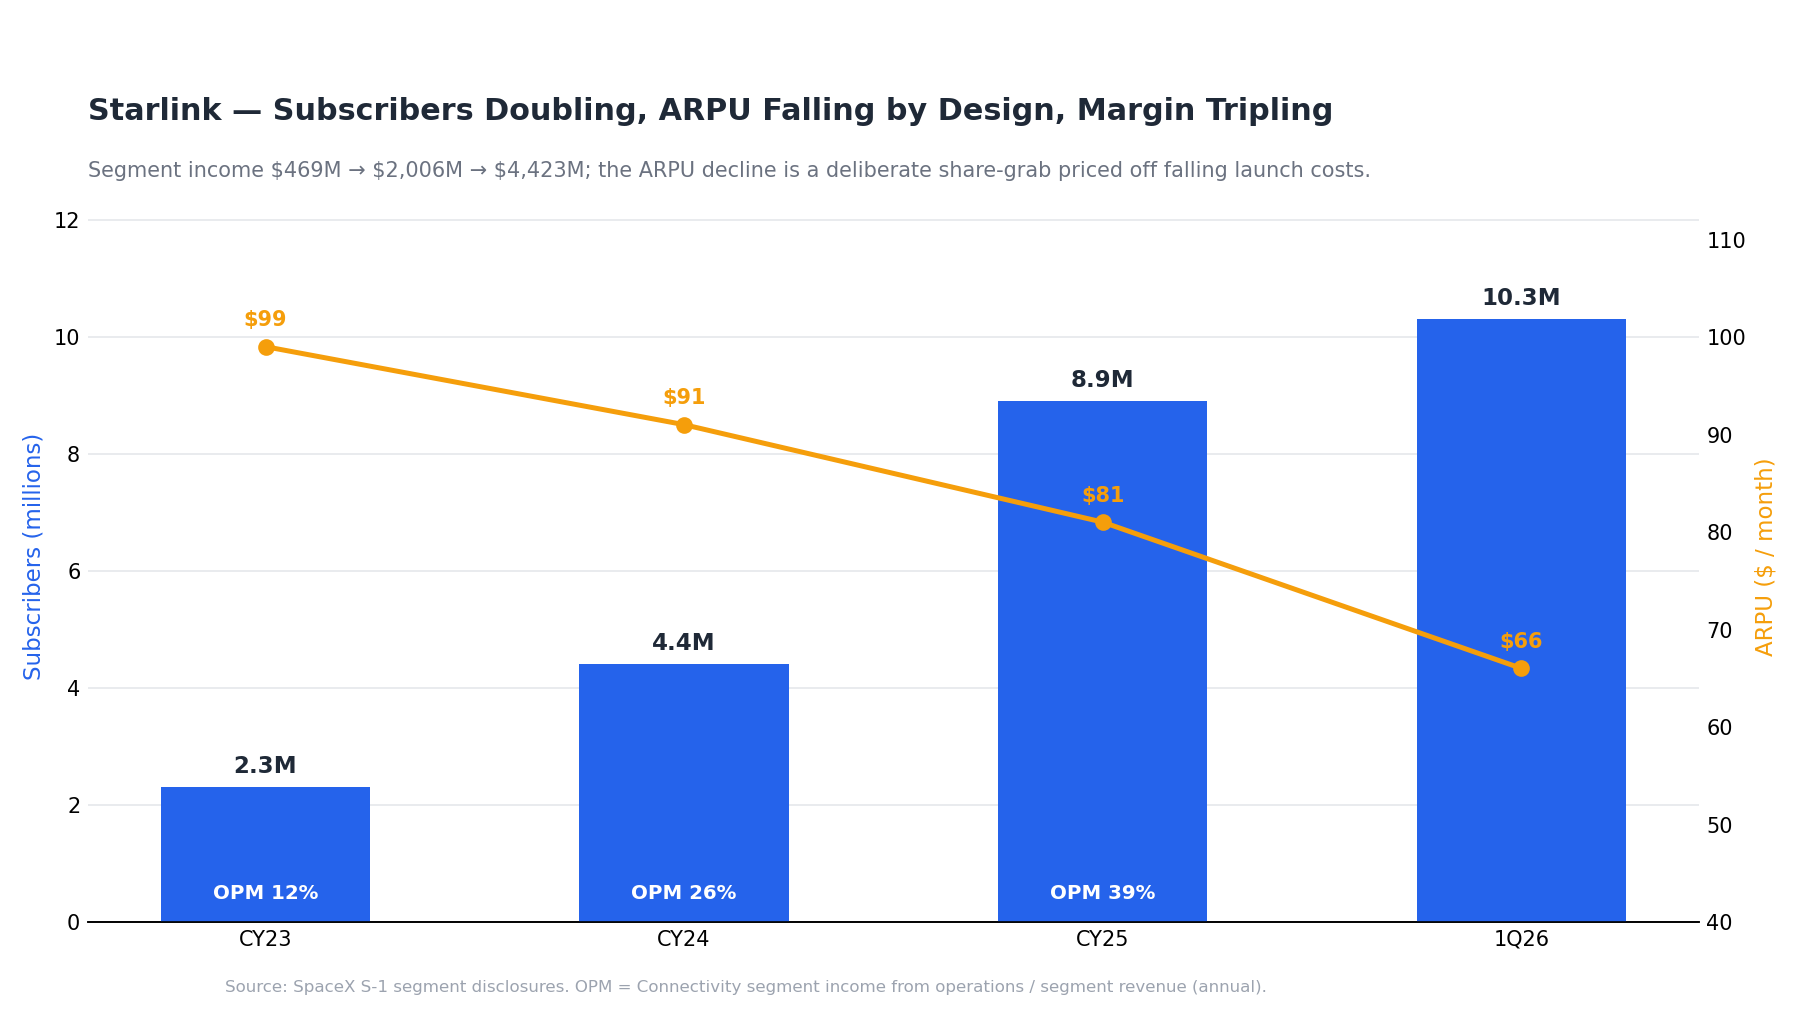
Subscribers double yearly while ARPU is walked down — and segment OPM still triples. The deliberate trade: rate for share, funded by launch-cost deflation.
- Subscribers: 2.3M (CY23) → 4.4M (CY24) → 8.9M (CY25) → 10.3M (3/31/26) — roughly doubling each year, across 164 countries.
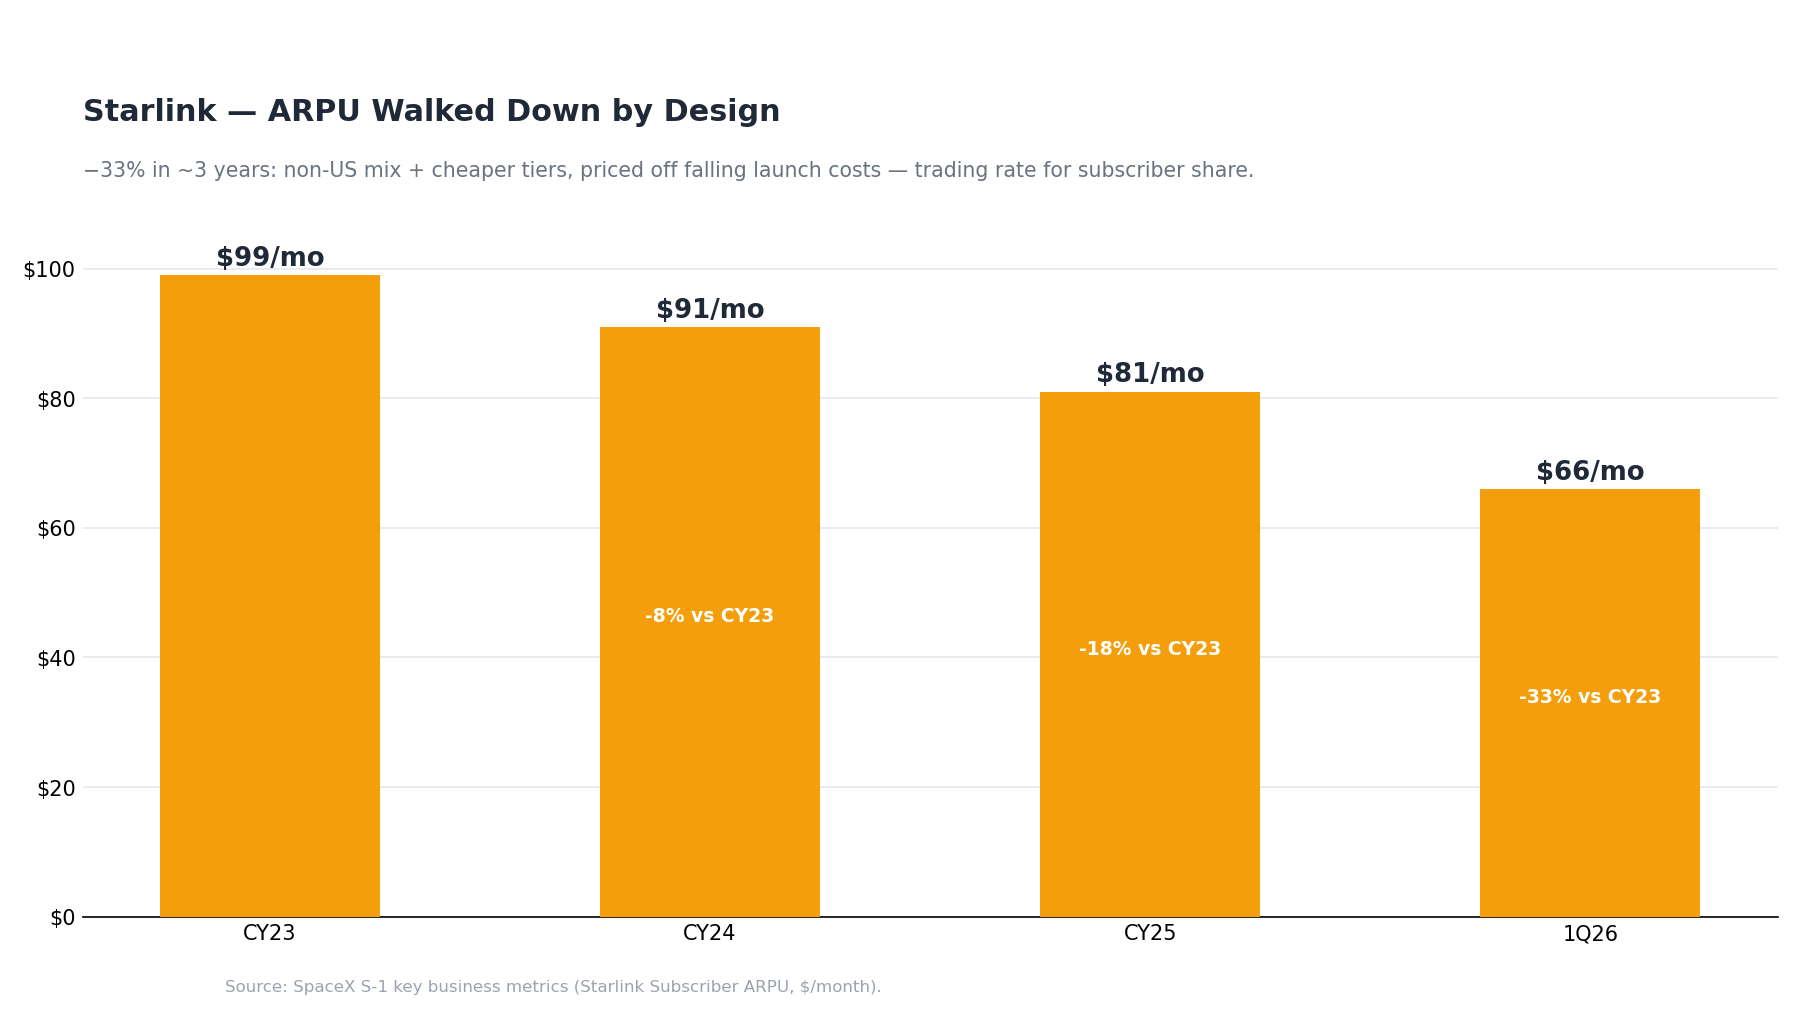
- ARPU falls by design: $99 → $91 → $81 → $66/mo (CY 1Q26, −23% YoY) — mix shift to non-US subscribers and cheaper plans, priced off falling launch costs; the S-1 frames it as prioritizing subscriber growth and operating leverage over rate.
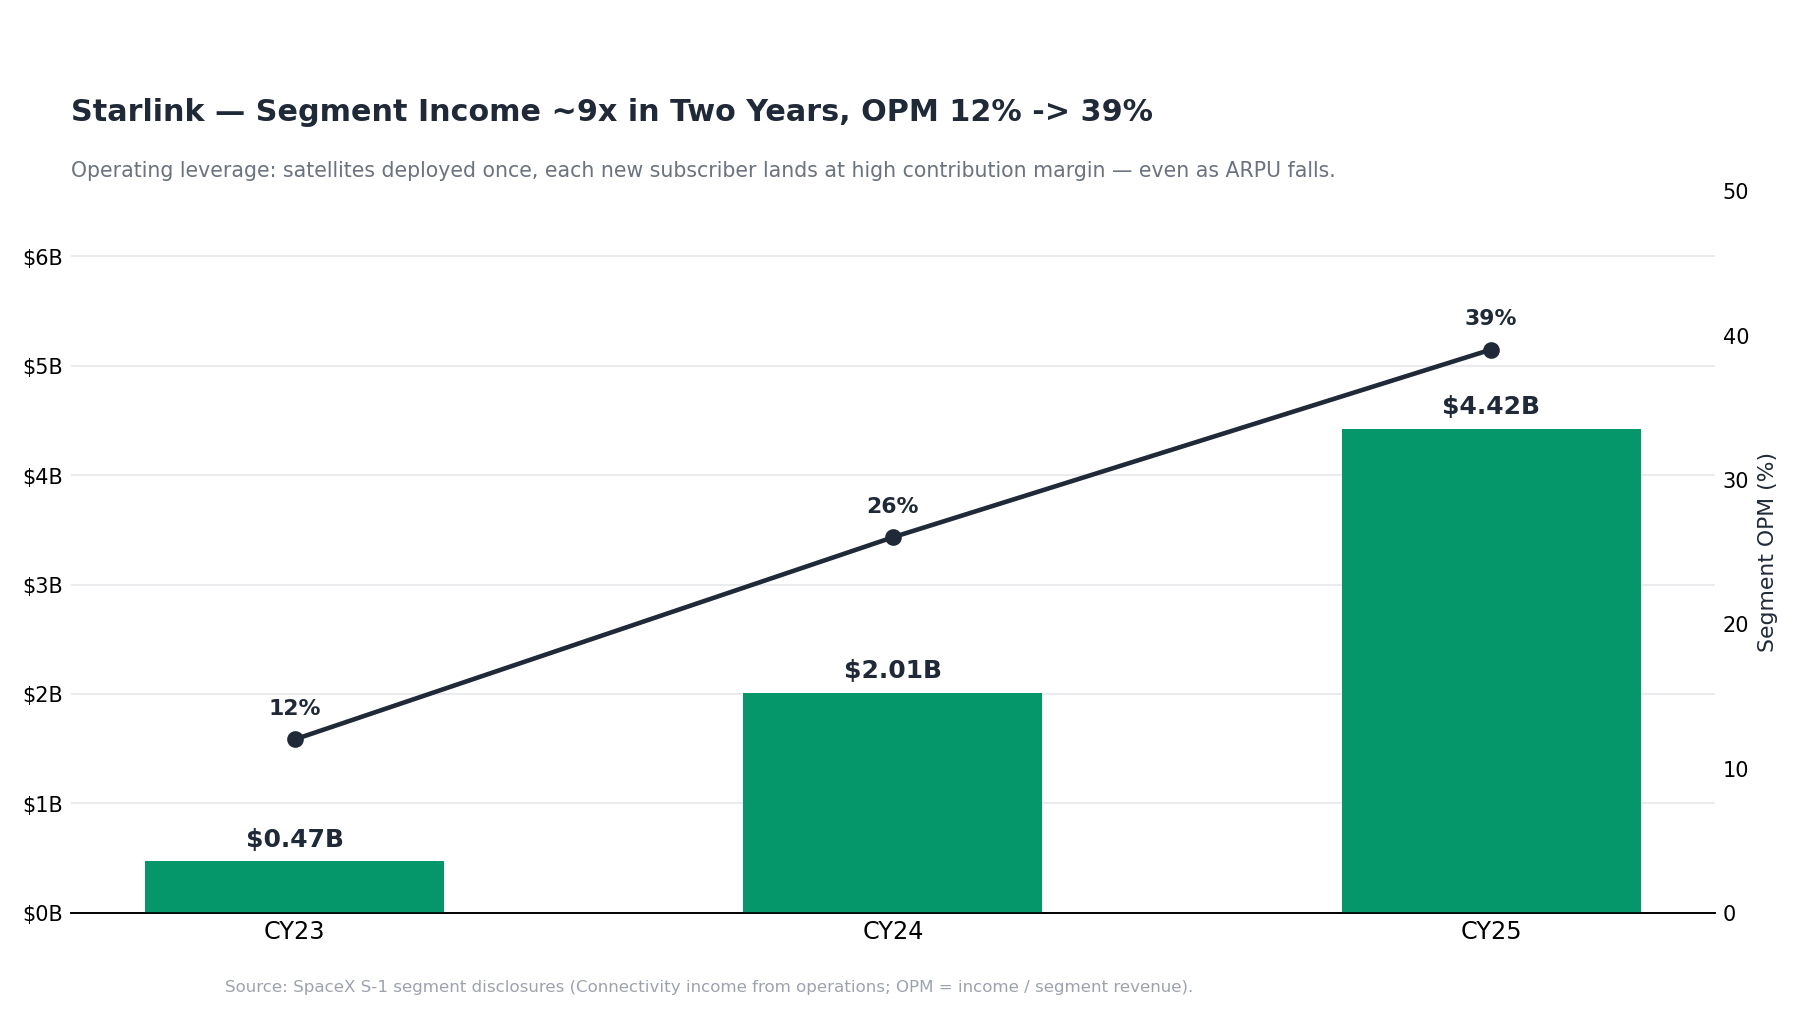
- The leverage shows up in margin, not price:
- segment income $469M → $2,006M → $4,423M (CY25);
- segment OPM 12% → 26% → 39%;
- adj. EBITDA $7.17B — the internal funding source for Starship and the AI buildout.
- The fleet: 9,600+ satellites — ~75% of all active satellites in orbit; average download 225 Mbps vs ~120 Mbps terrestrial-ISP average.
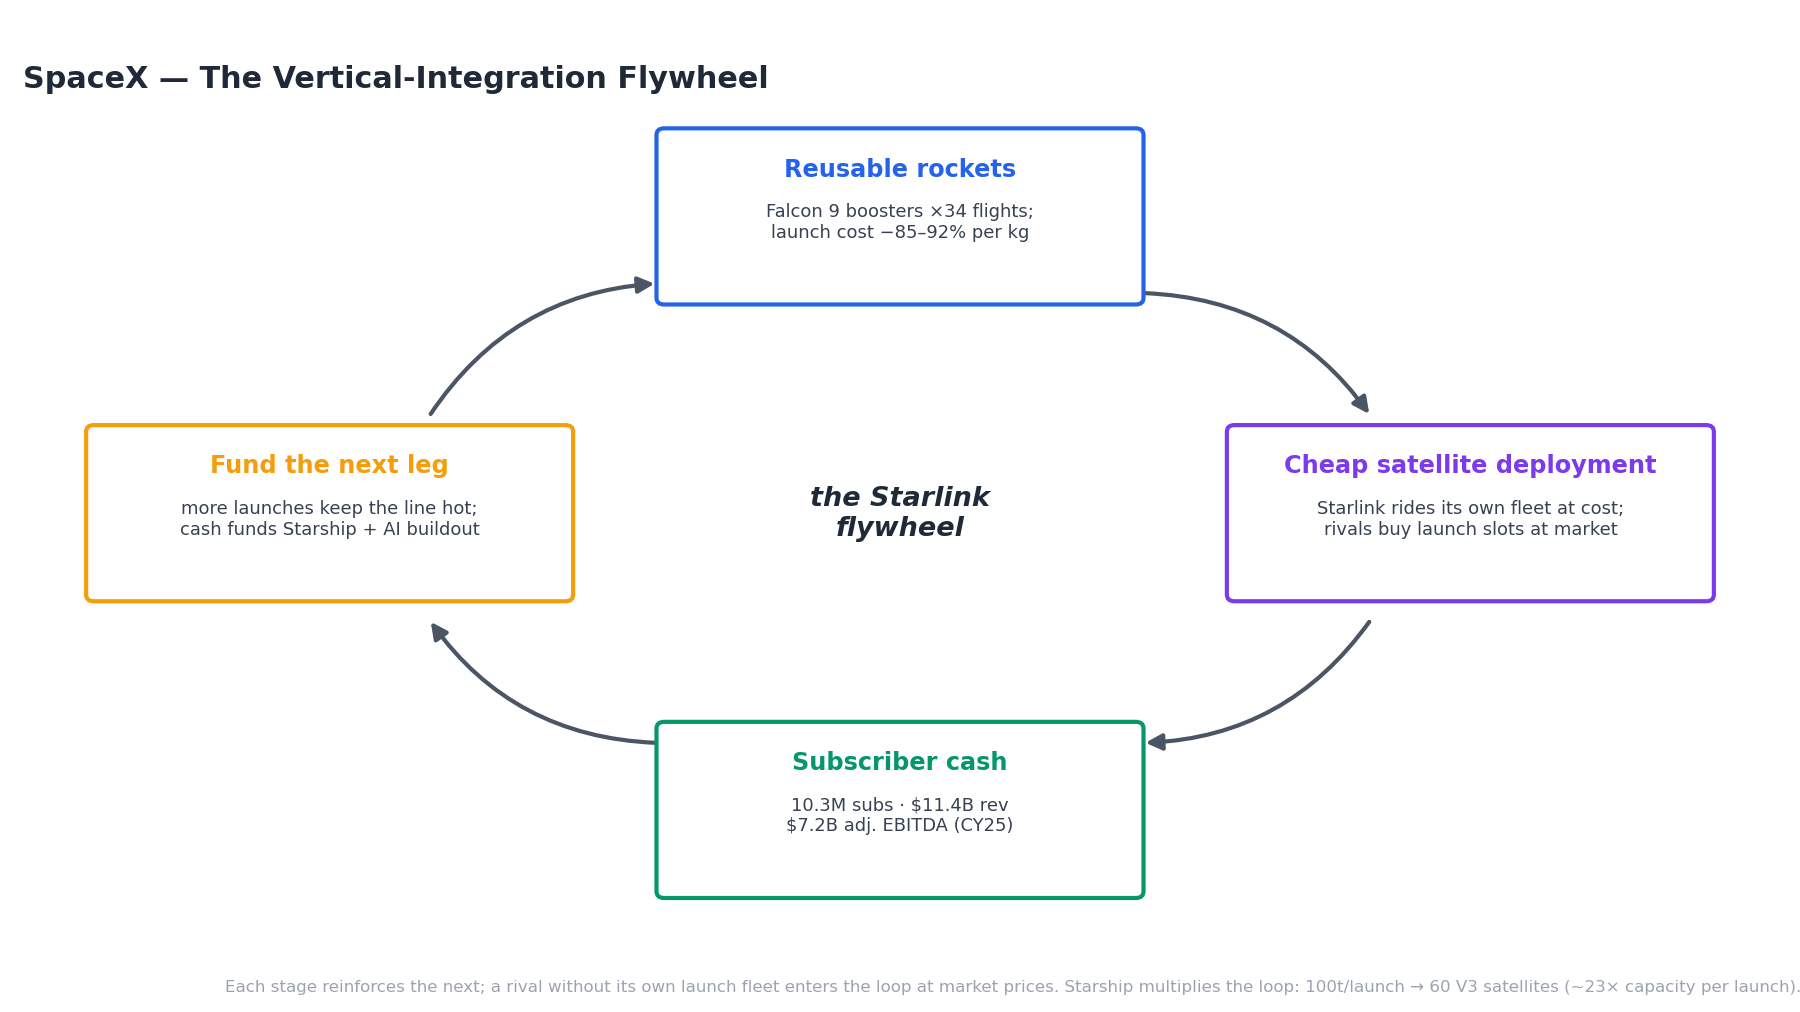
- The flywheel:
- owning the rockets makes satellite deployment cheap
- → the constellation generates subscription cash
- → the cash funds more launches and keeps the launch line utilized.
- A satellite-internet rival must buy launch slots at market rates; Starlink rides its own fleet at cost.
- Why the economics step-change from 2H CY26 — Starlink V3:
- V2 satellite: 96 Gbps downlink, 27 per Falcon 9 launch → ~2,600 Gbps deployed per launch.
- V3: ~1 Tbps per satellite (~10.7×), 60 per Starship launch → ~61,000 Gbps per launch — a ~23× jump in capacity deployed per launch.
- Capacity per launch is what sets unit economics: more bandwidth per subscriber, gigabit tiers, enterprise SLAs.
- The second leg — Starlink Mobile (direct-to-cell):
- V1 already live: ~30 mobile-operator partnerships, ~1.9B population covered, ~650 mobile satellites, ~7.4M monthly unique devices (S-1).
- V2 satellites launch from 2027 (Starship-dependent) — from texting toward 5G-class broadband + IoT.
- Regulatory gate: the 65 MHz spectrum acquisition + global MSS license closes ~Nov 2027.
xAI — what the merger actually brought
- The data flywheel: X feeds Grok ~550M MAU and ~350M daily posts as training data — the one input other AI Labs must scrape or license.
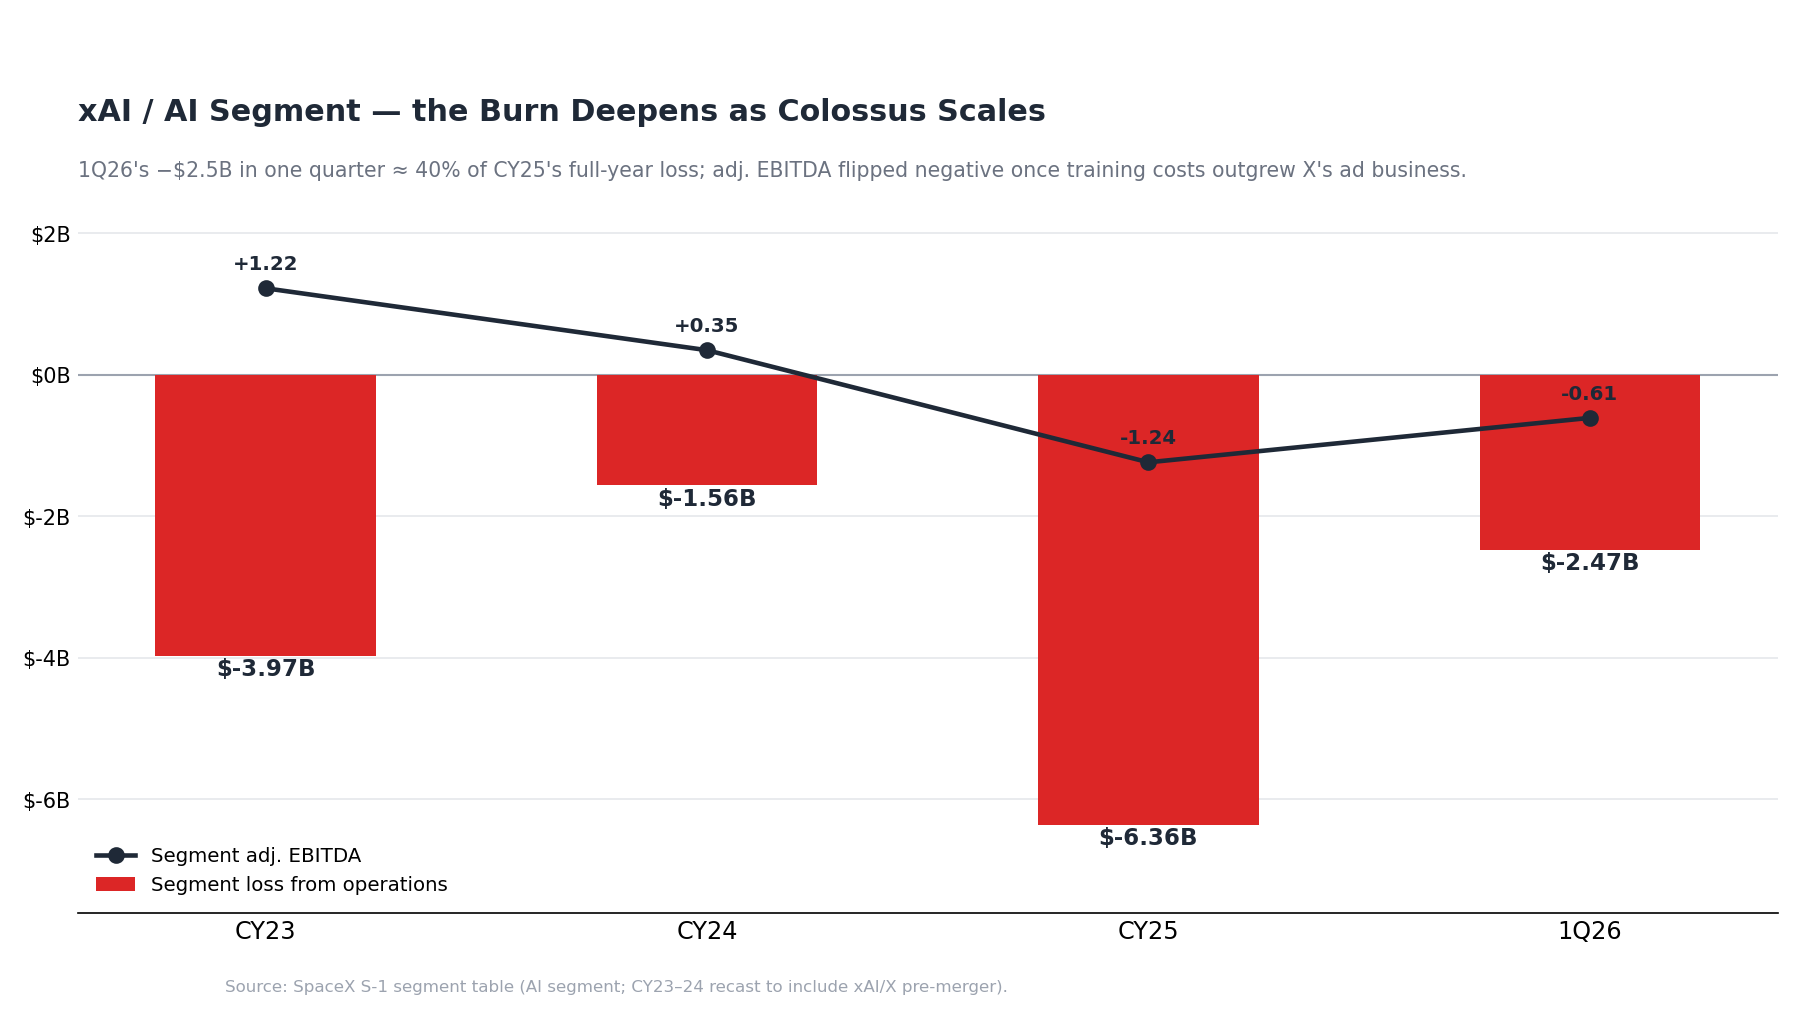
- The burn (S-1 segment table): AI segment loss from operations
- −$3.97B (CY23) → −$1.56B (CY24) → −$6.36B (CY25) → −$2.47B in CY 1Q26 alone;
- segment adj. EBITDA flipped from +$1.22B (CY23, X's ad business) to −$1.24B (CY25) — the ad business can no longer carry the training bill.
- The capex:
- AI took $7.7B of CY 1Q26's $10.1B group capex (+201% YoY, 76% of the total);
- CY26 AI capex tracking $30B+ annualized against $3.2B of AI revenue.
- Grok 5 is training on Colossus 2 (release ~mid-2026E) — the trigger that either revalidates the AI-Labs bet or doesn't.
- Cursor: post IPO, ~$60B of SPCX equity reportedly went to acquiring Cursor — doubling down on the coding-agent lane before Grok 5 proves out.
- The strategic read:
- if Grok stays Tier 2, the fallback is the full neocloud pivot — sell the compute instead of the intelligence.
- The Anthropic / Google / Reflection offtakes are that fallback already monetizing;
- the endstate would be "an Oracle with a fancy dayjob."
- Knowledge-intensive AI Lab → capital-intensive neocloud is a step down the value stack — but it keeps the compute, and compute is the moat Musk actually trusts.
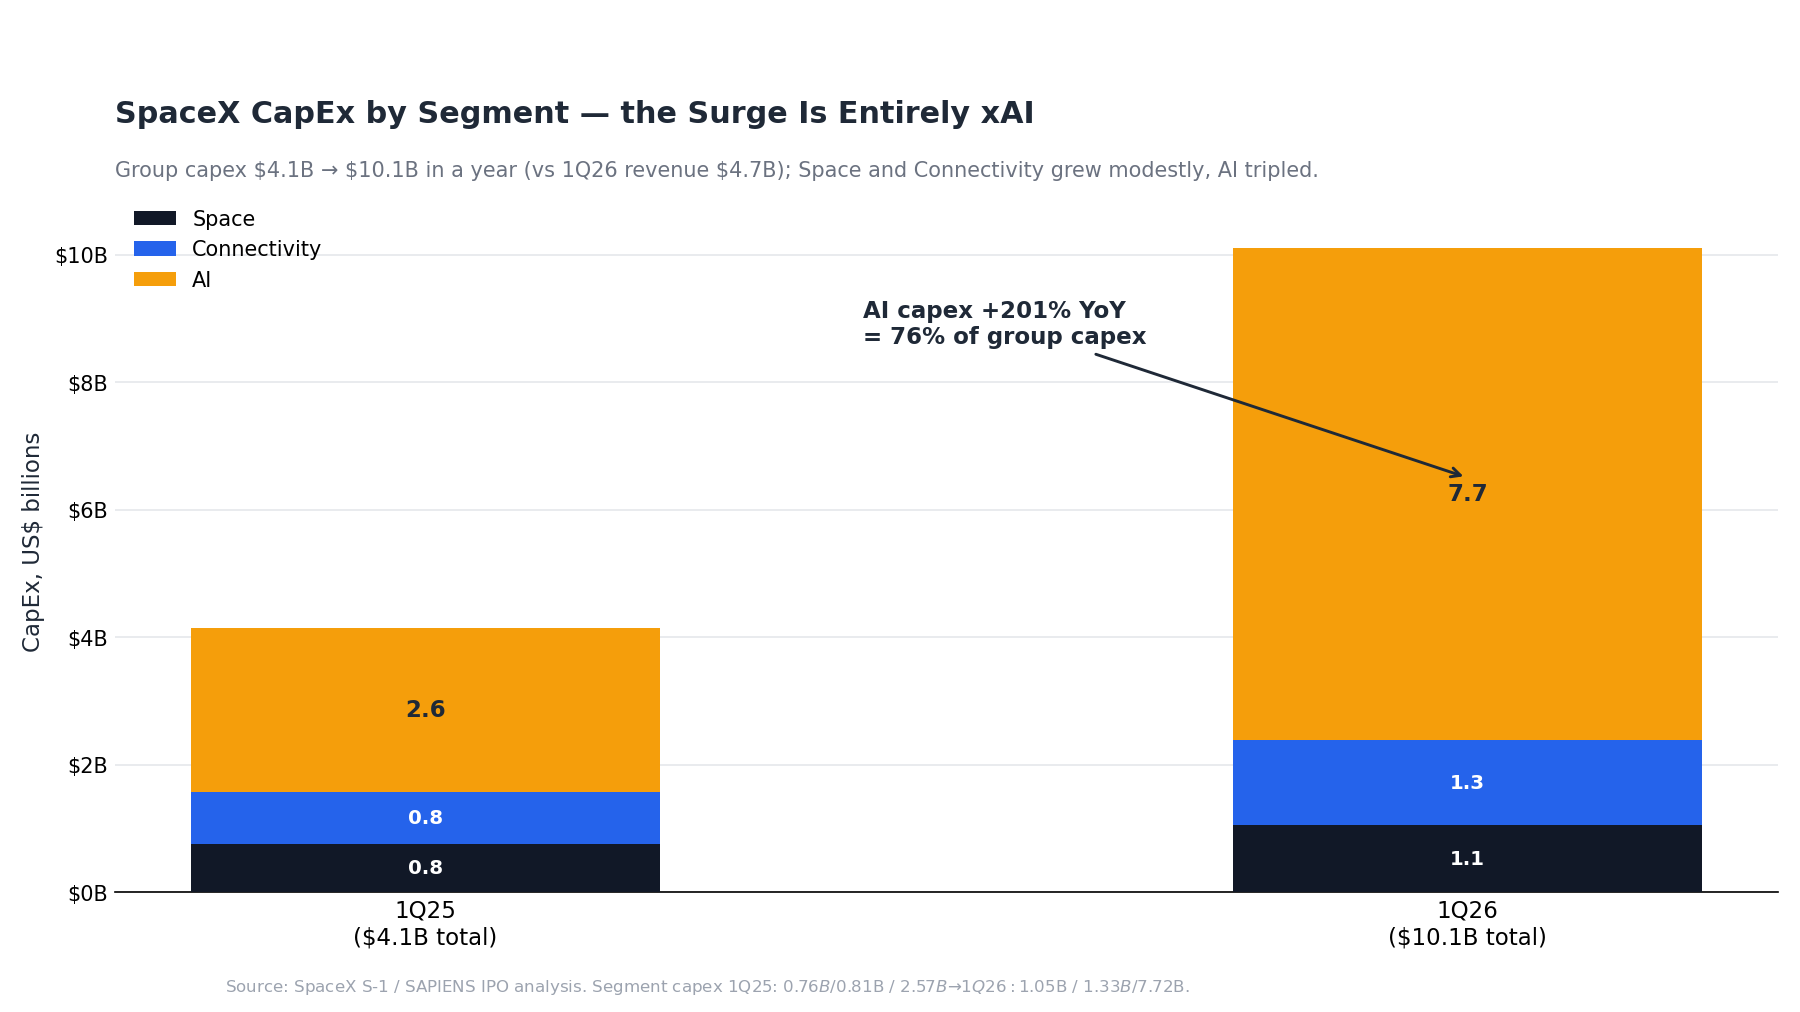
The capex surge is entirely xAI: Space and Connectivity grew modestly; AI tripled to 76% of group spend.
Colossus — the AI fleet in numbers
- Nameplate compute draw (S-1 metric):
- 0 (CY23) → 0.3 GW (CY24) → 0.8 GW (CY25) → 1.0 GW (3/31/26)
- Colossus 1 ~300 MW + Colossus 2 ~700 MW;
- est. ~1.3 GW by mid-2026 as Colossus 2 fills. (GPU count × rated power; excludes cooling / distribution / facility overhead.)
- "Coherent" is the design claim: the S-1 calls it the "first coherent gigawatt-scale AI training cluster"
- one physically unified training fabric (power, network, cooling, storage, software),
- not DCI-linked separate buildings. xAI's stated moat is building the biggest cluster fastest and cheapest — AI as a hardware business.
- Naming note:
- the S-1 defines COLOSSUS II as spanning Memphis + Southaven
- press's "Colossus 3 / MACROHARDRR" (below) sits inside the S-1's Colossus 2 footprint.
- Next phase:
- +400 MW and ~220k GB300s — ~1,500 GB300 NVL72 racks from Supermicro
- ~1,500 racks from Dell — targeted online ~Aug 2026.
- +400 MW and ~220k GB300s — ~1,500 GB300 NVL72 racks from Supermicro
- Read that closely — it is the whole SPCX-as-neocloud story in one clause: the offtake is framed as monetizing spare capacity, reversible on 90 days' notice, not as a committed multi-year AI-factory buildout à la Microsoft-Nebius. (The Google and Reflection deals postdate the S-1 — press-sourced, in §3.)
The Anthropic anchor deal, in the S-1's own words:
"The customer has agreed to pay us $1.25 billion per month through May 2029, with capacity ramping in May and June 2026 at a reduced fee. The agreements may be terminated by either party upon 90 days' notice… This structure allows us to monetize unused compute capacity in our infrastructure, while still permitting reallocation of the capacity for our own internal initiatives if needed." (S-1)
Colossus 1 (Memphis, TN)
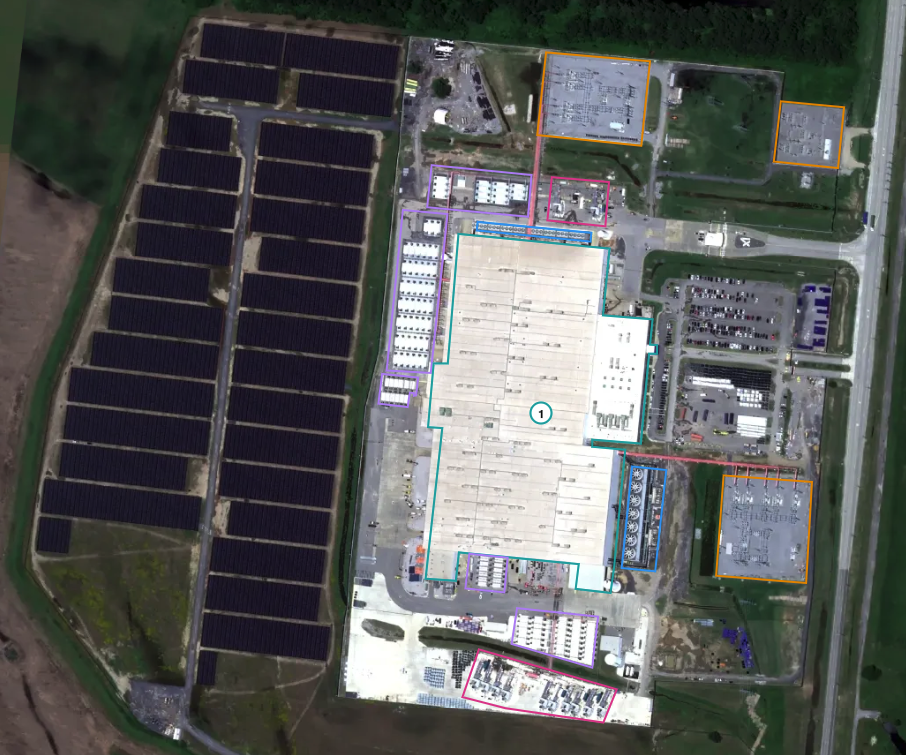
- Partners: xAI-built (now SpaceX); anchor tenant Anthropic — the whole facility.
- Capacity: >300 MW.
- Chips: >220,000 mixed H100 / H200 / GB200.
- Note: pre-Anthropic utilization was reportedly ~11% (Grok's demand collapse); the deal monetizes a stranded asset.
Colossus 2 ⎯ "MACROHARD" (Memphis area)
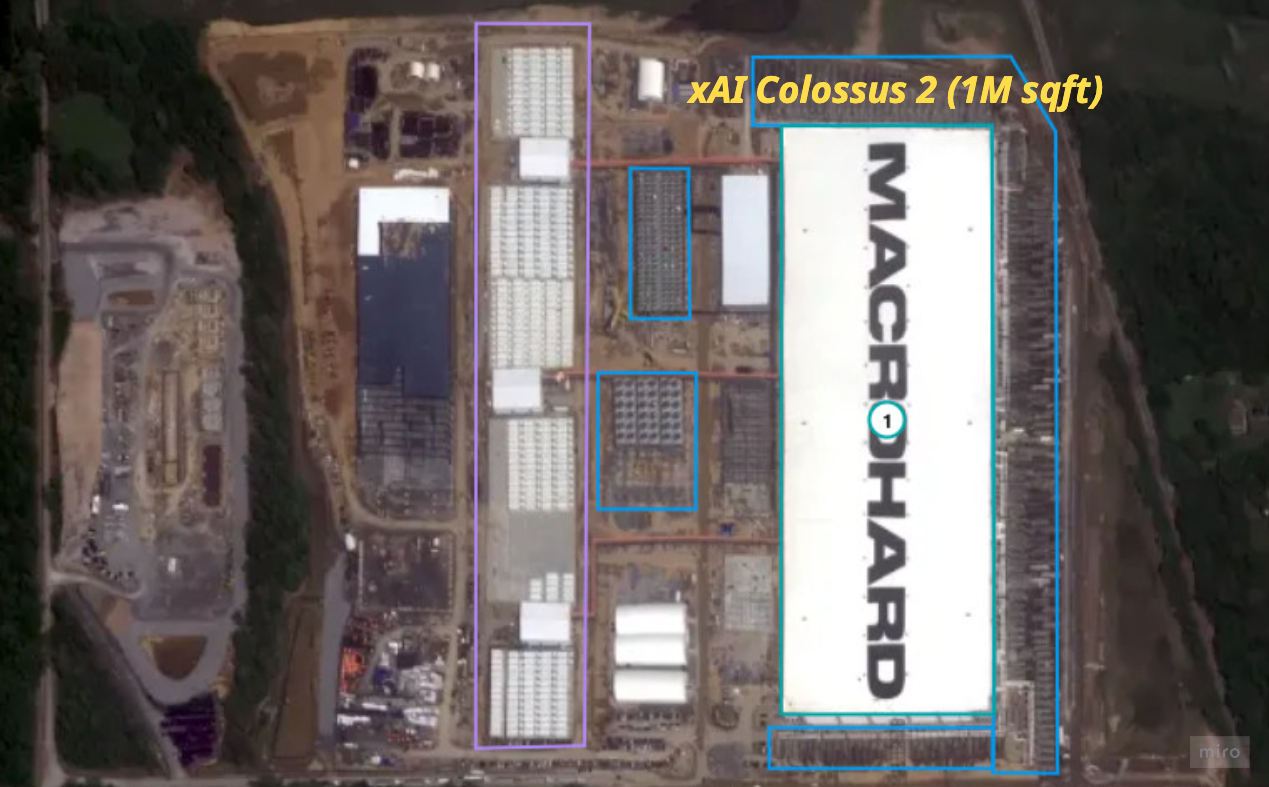
- Capacity: first GW-scale training cluster.
- Chips: GB200 / GB300.
- Tenants: xAI (Grok training) + Reflection AI (GB300).
Colossus 3 — "MACROHARDRR" (Southaven, Mississippi)
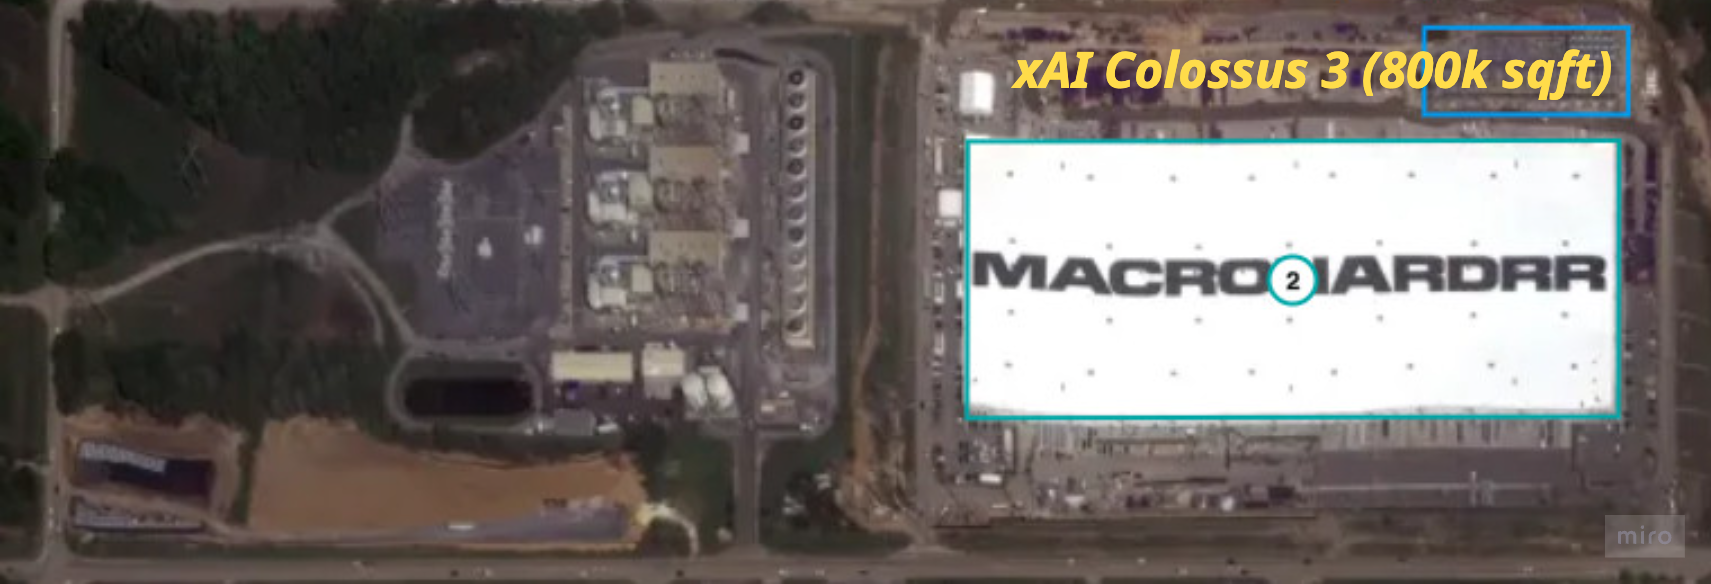
- Status: building acquired Dec 30, 2025; conversion from CY 1Q26; GPU deployment CY 2Q–CY 3Q26.
- Target: pushes the complex toward 2 GW and a stated 1M-GPU site goal.
Power
- Solaris Energy Infrastructure JV (50.1% Solaris / 49.9% xAI): mobile gas turbines to >1.1 GW by CY 2Q27; 41 permanent turbines (~1.2 GW) permitted Mar 2026 at Southaven.
- Ongoing community opposition (NAACP + Memphis groups) over gas-turbine emissions.
(3) Financing ledger — per company
The capital-stack question is where neoclouds actually differentiate. Same GPUs, same customers — the spread is made or lost on the liability side.
CoreWeave — the DDTL laboratory
What a DDTL is. A Delayed Draw Term Loan is a committed facility drawn in stages, not all at once:
- The lender fixes the total limit upfront, but CoreWeave pulls cash only as it needs it — as each powered shell is leased, fitted out (~1–2 months), and populated with GPUs — instead of borrowing the whole sum on day one.
- Why it fits the business: capex is staged and revenue lags it by ~3 months (shell → fit-out → GPU install → customer handoff). A plain term loan would accrue interest on the full balance while the data center is still dark and pre-revenue; a DDTL times the interest to the draw, so cost tracks revenue instead of leading it.
- How it's secured — structured (project) finance applied to GPUs:
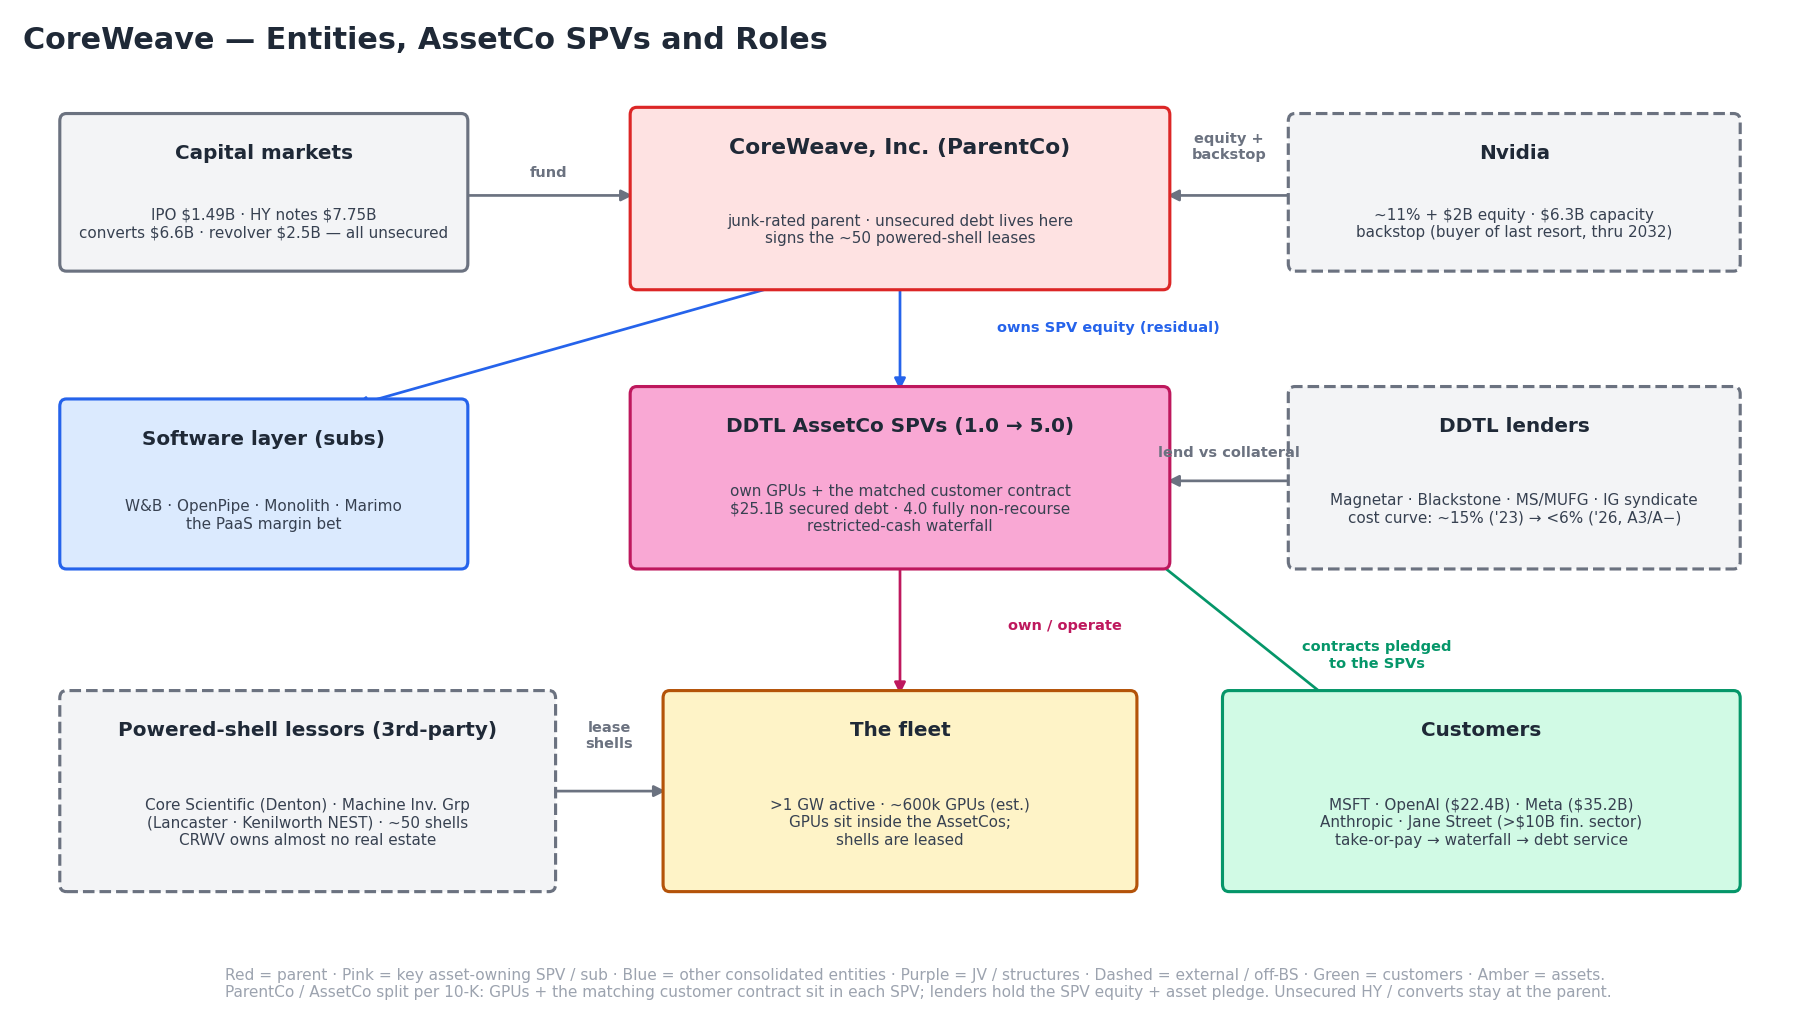
- The SPV. Each DDTL is lent to a bankruptcy-remote subsidiary (an "AssetCo" / SPV), not to CoreWeave Inc. — into it go a defined pool of GPUs plus the customer contract they serve.
- What's pledged. The lender takes both the physical GPUs and the assignment of the contract's take-or-pay cash flows — a hard asset plus the revenue stream that repays it.
- Non-recourse. On default the lender can seize only that SPV's assets, never CoreWeave Inc. or another SPV — so lenders underwrite the customer's credit, not CoreWeave's, and one bad contract can't sink the company.
- ParentCo / AssetCo split. CoreWeave Inc. owns the SPV equity and keeps the residual after debt service; lenders hold the asset + equity pledge. Same architecture as financing a solar farm or a toll road.
- Self-amortizing waterfall. Customer payments hit a restricted account and cascade opex → debt service → release to CoreWeave; because the 5–6 yr contract is matched to GPU life and the loan amortizes across it, leverage falls automatically and the GPUs are largely unencumbered by contract-end.
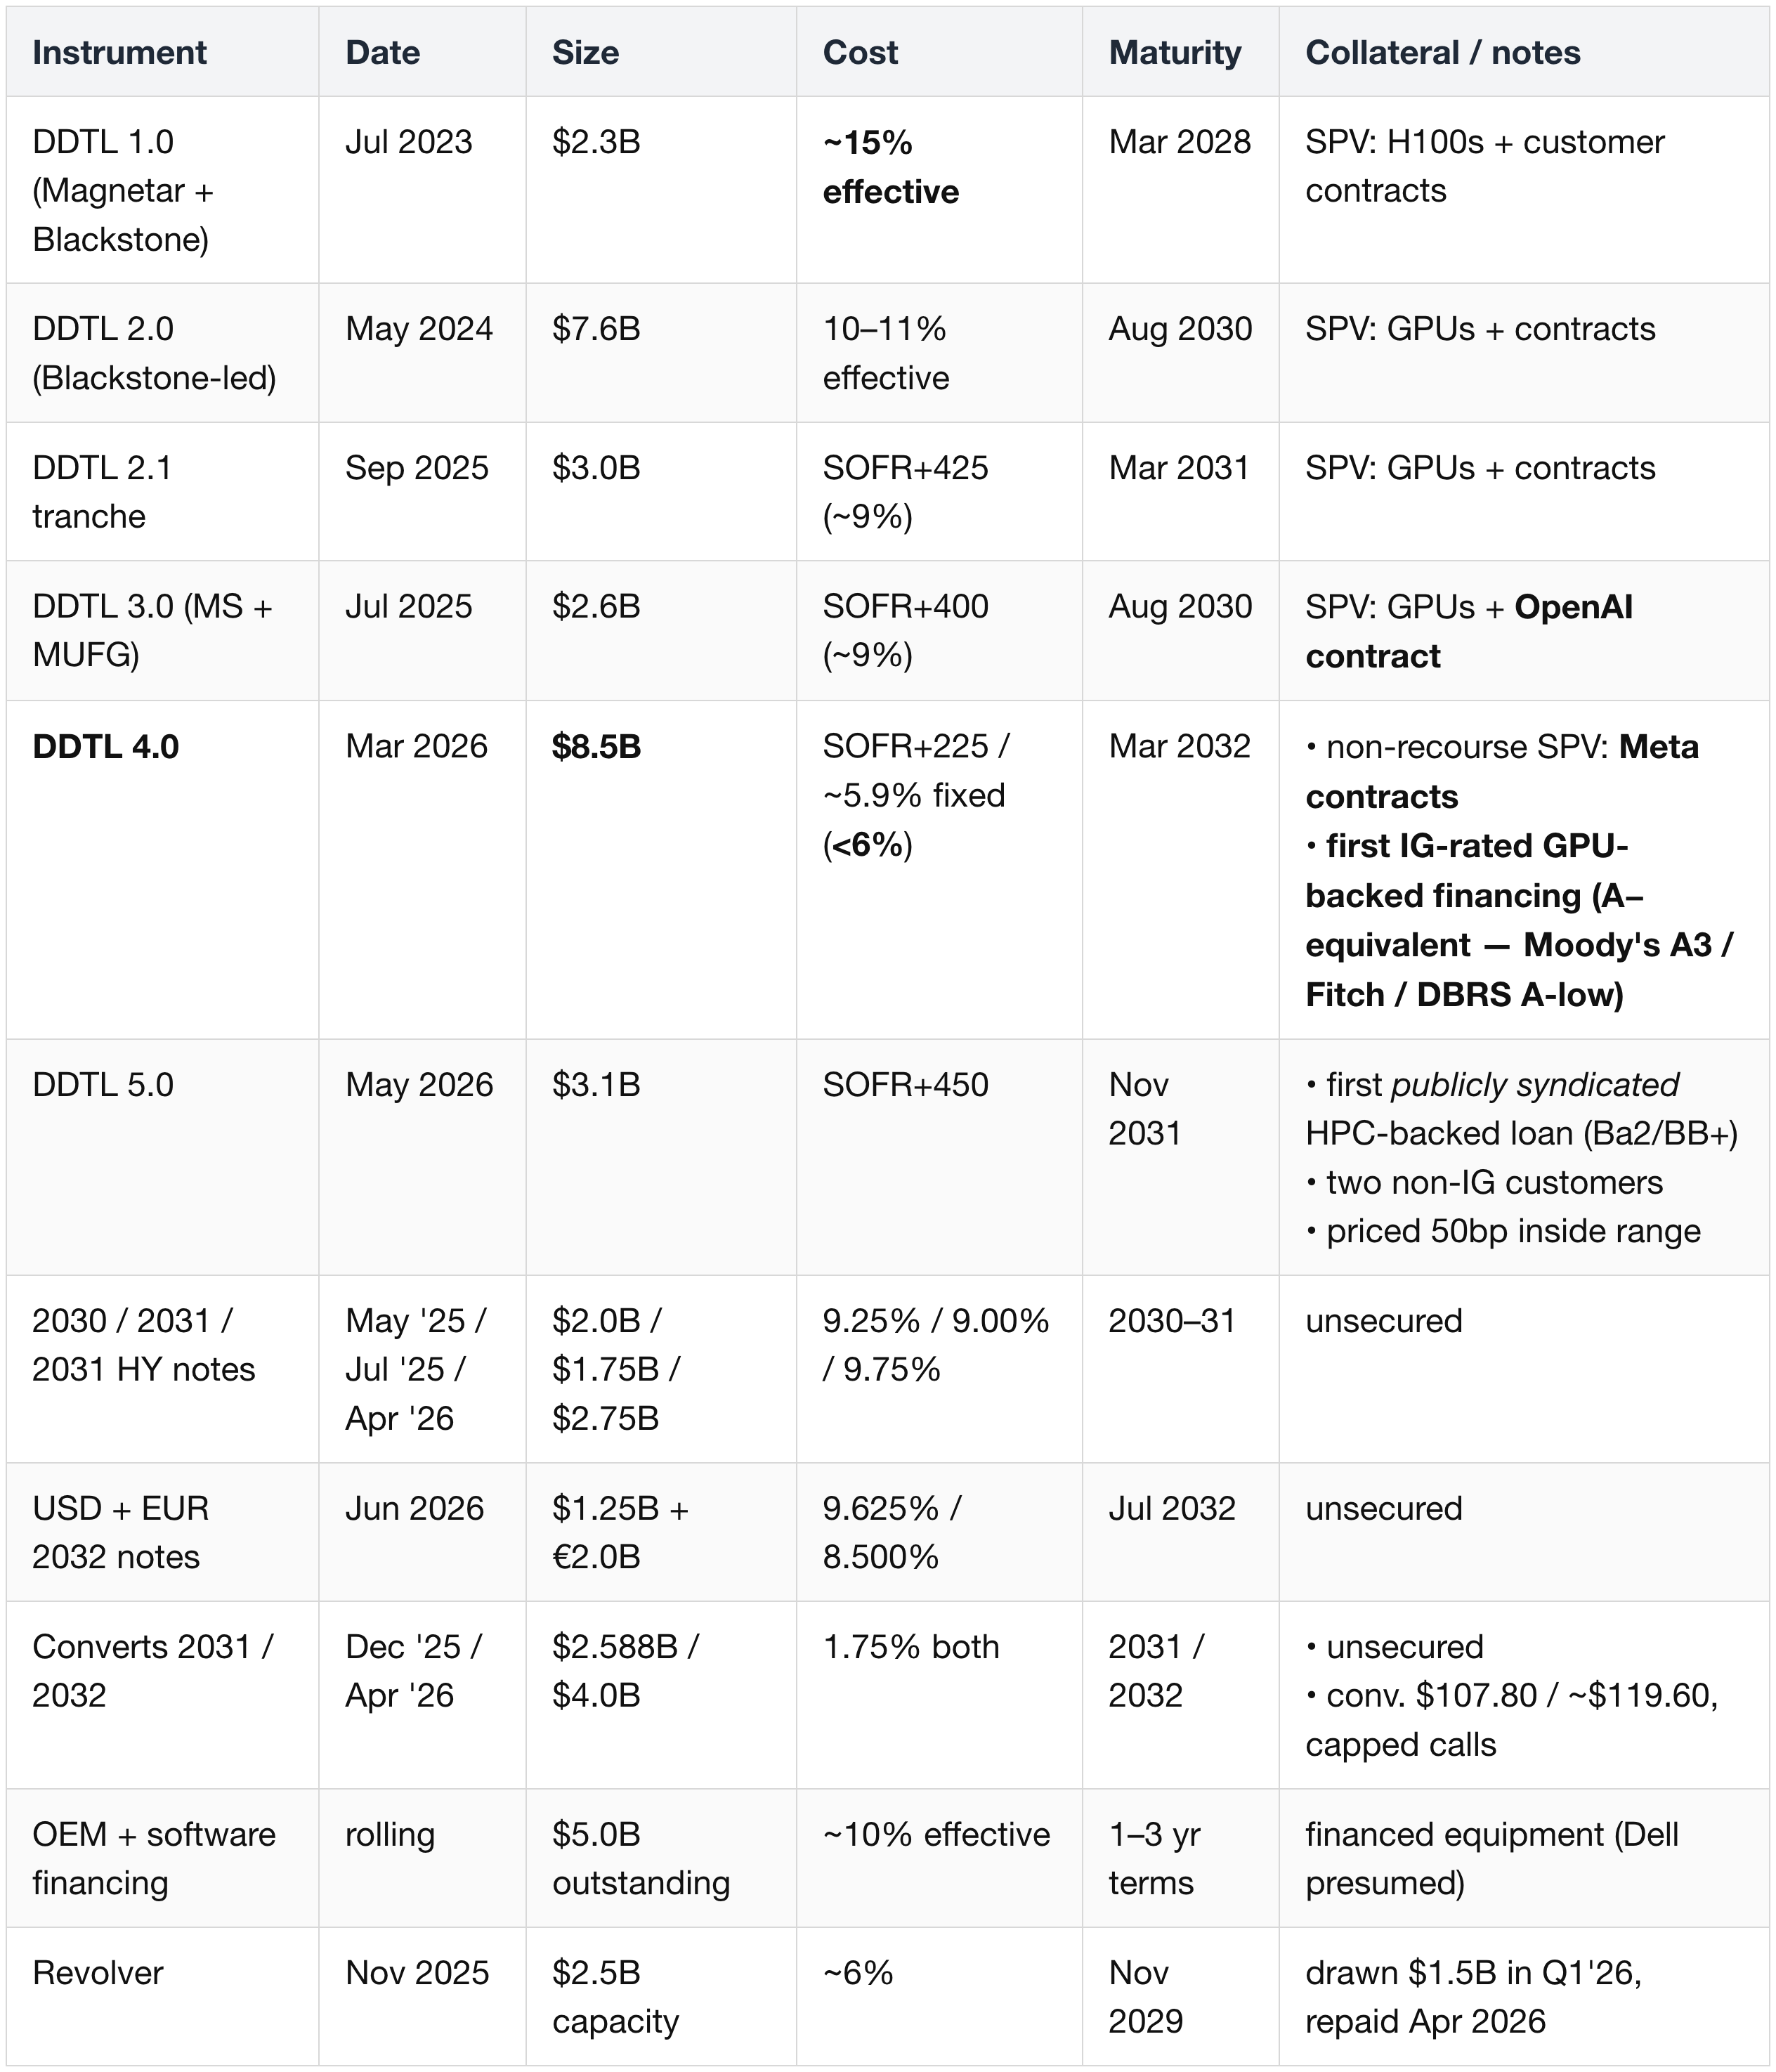
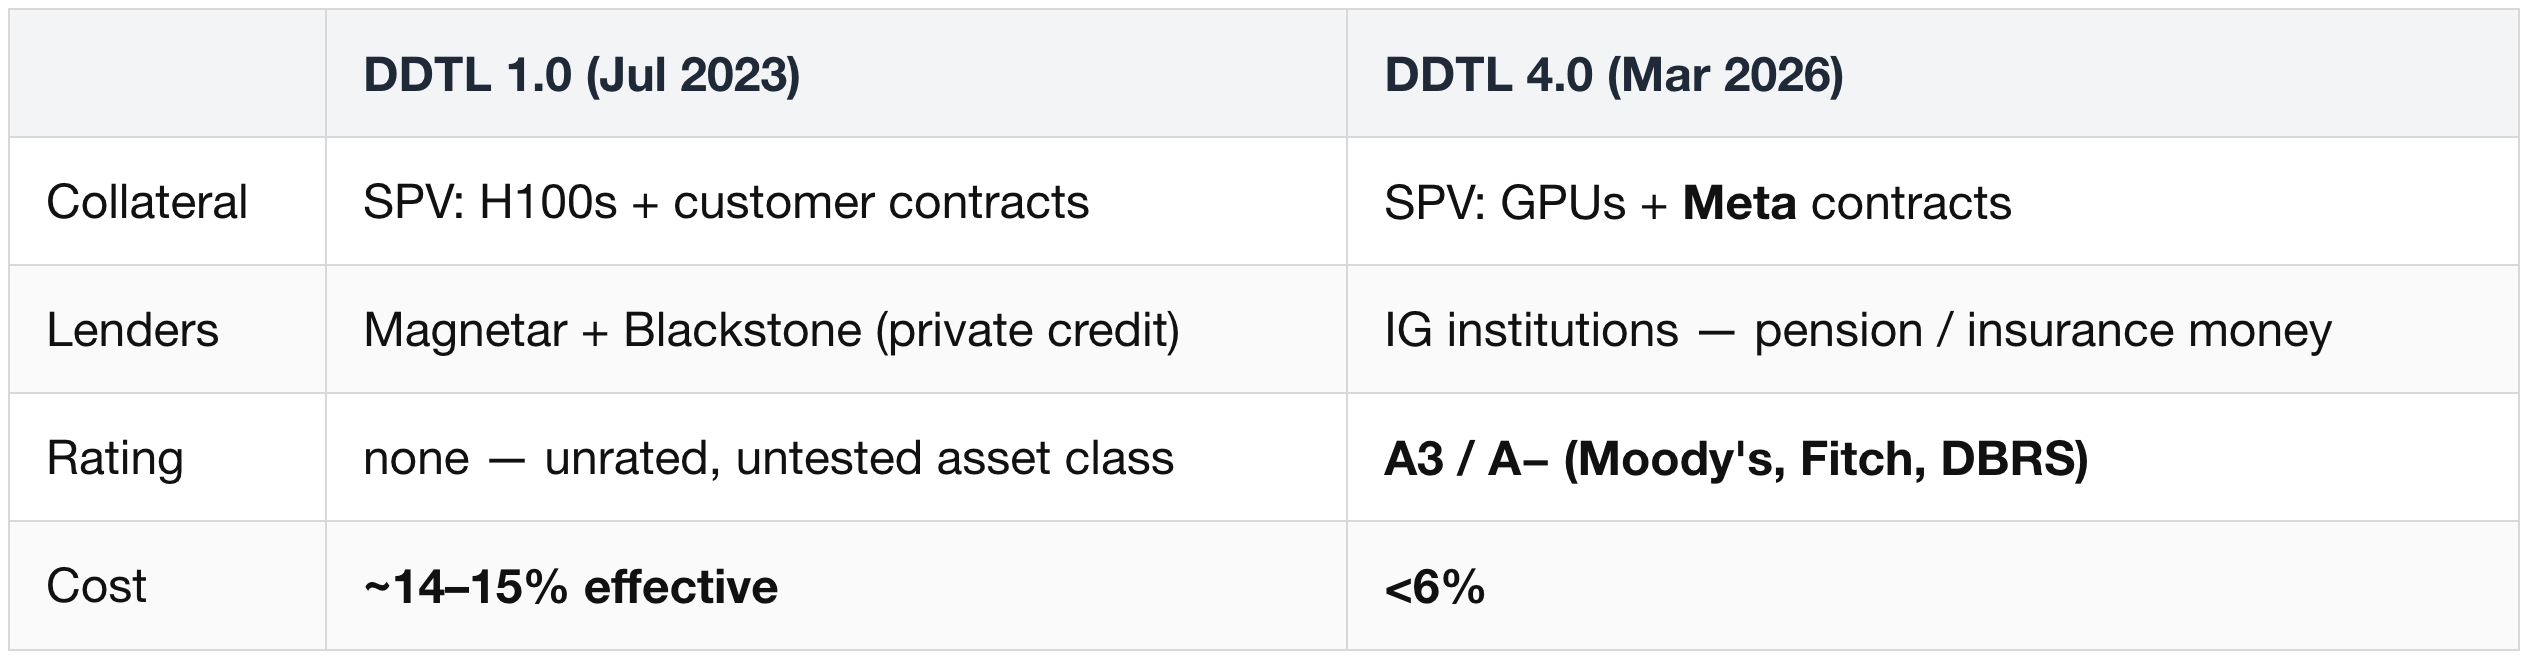
- Rating arbitrage — the point. Ring-fenced and backed by a named IG customer, the SPV is rated on the customer's credit: DDTL 4.0 earned A3 / A- on Meta's contract, letting a junk-rated, loss-making company borrow at <6%.
- Why there are "generations" (1.0 → 5.0): each is a fresh facility priced off CoreWeave's credit at the time — from private credit (Magnetar, ~15% effective) down to investment-grade (DDTL 4.0, <6%). The falling rate is the whole point.
Debt principal: $8.0B (12/31/24) → $21.6B (12/31/25) → $25.1B (3/31/26) → ~$35B pro-forma after Apr–Jun 2026 raises.
- Interest burden: FY24 $361M → FY25 $1,229M → CY 1Q26 $536M (~$2.1B annualized — ~26% of revenue).
- Cash interest paid lags accrual: $869M in FY25.
- Blended cost ~8.2–8.3%, falling at the margin.
- The DDTL cost curve: 14–15% (1.0) → 10–11% (2.0) → ~9% (2.1 / 3.0) → <6% (4.0).
- Management framing: every 4% off $24–25B of debt ≈ $1B/yr of interest — the biggest lever toward break-even, vs hyperscalers funding at 4–5%.
- The math: 4% × ~$25B ≈ $1B/yr saved per 4-point drop in the blended rate.
- Why it's the lever: CoreWeave is operationally profitable (56% adj. EBITDA); the ~$2.1B interest bill is what holds it in a net loss — so break-even runs through the liability side, not revenue or opex.
- The gap being closed: hyperscalers borrow at ~4–5%, CoreWeave at ~8.2% — that 3–5pp is its one structural disadvantage (same GPUs, customers, rents), and the DDTL curve toward <6% is erasing it.
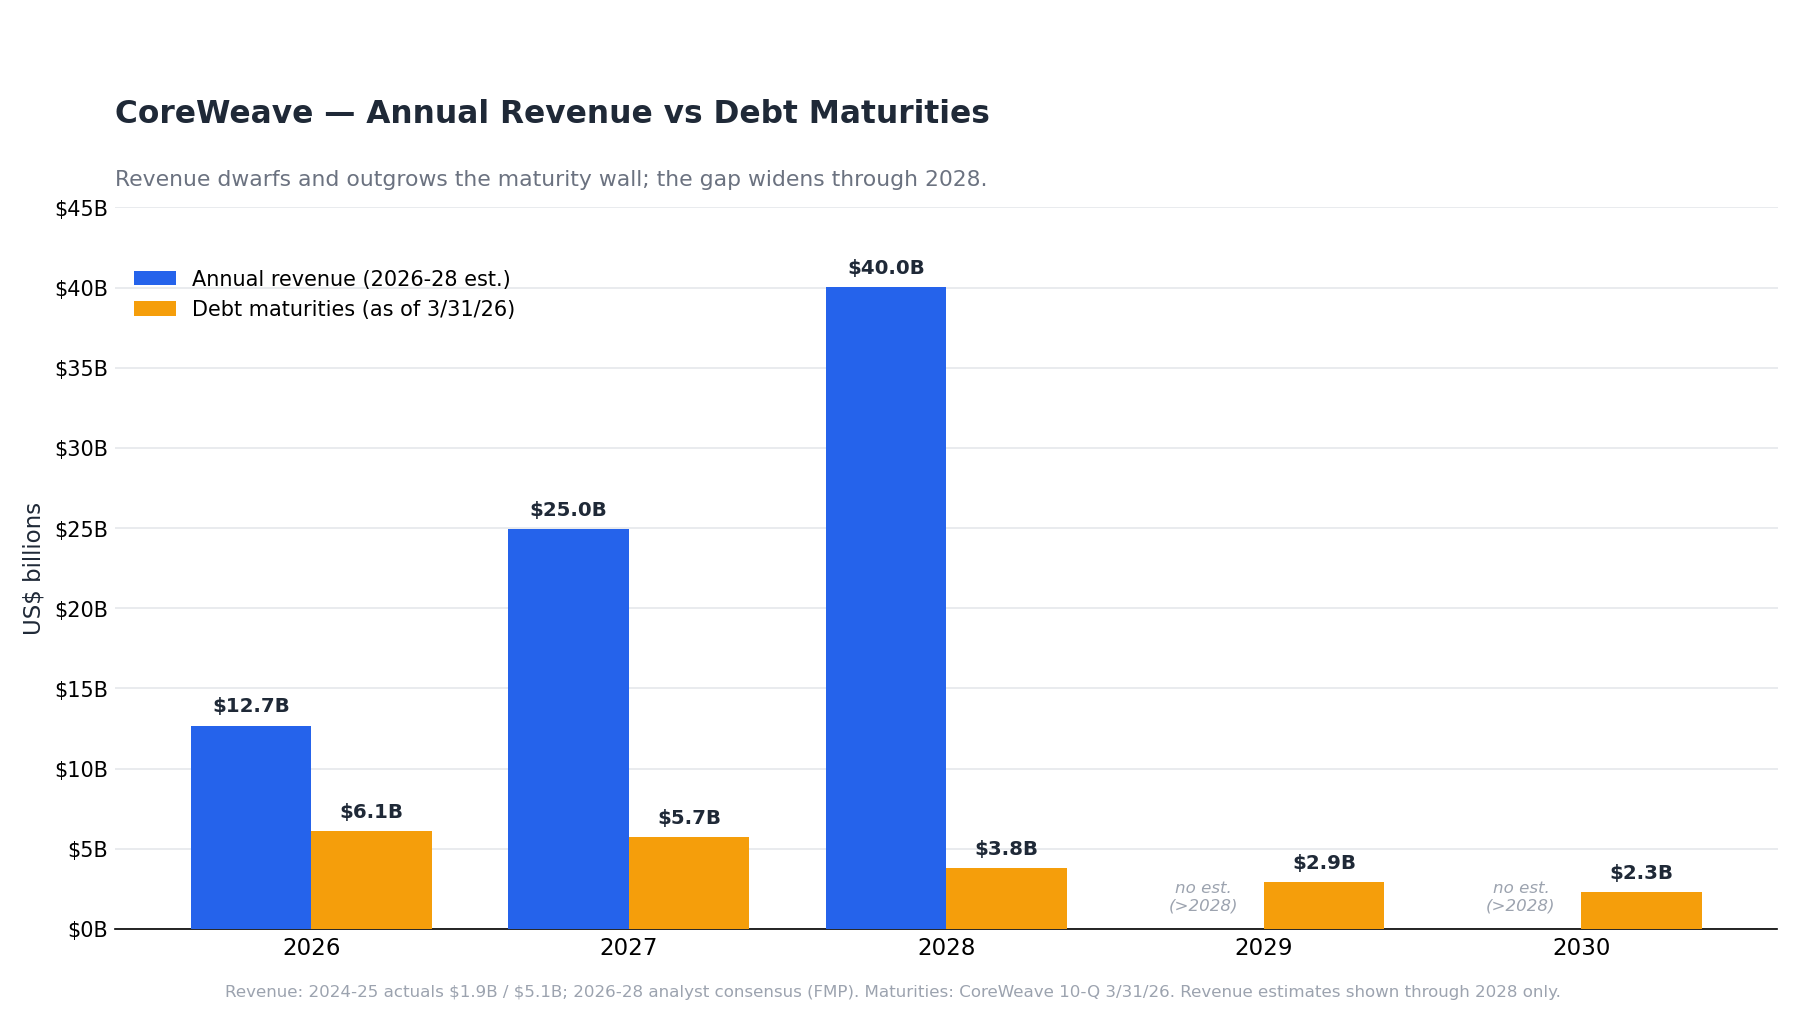
- Maturity wall (3/31/26): 2026-rem $6.1B, 2027 $5.7B, 2028 $3.8B, 2029 $2.9B, 2030 $2.3B, thereafter $4.4B.
- Near-term is dominated by DDTL amortization and OEM financing.
- The Apr–Jun 2026 raises pushed ~$10.3B out to 2031–32.
- DDTLs are self-amortizing — leverage naturally declines over each contract's life.
- Collateral covenants (mechanics in the DDTL explainer above): the package is structural, not financial —
- restricted-cash waterfalls (customer payments → opex → debt service → release)
- ≥95% interest-rate hedging
- power-cost hedging
- amortization that springs earlier if DC delivery milestones slip
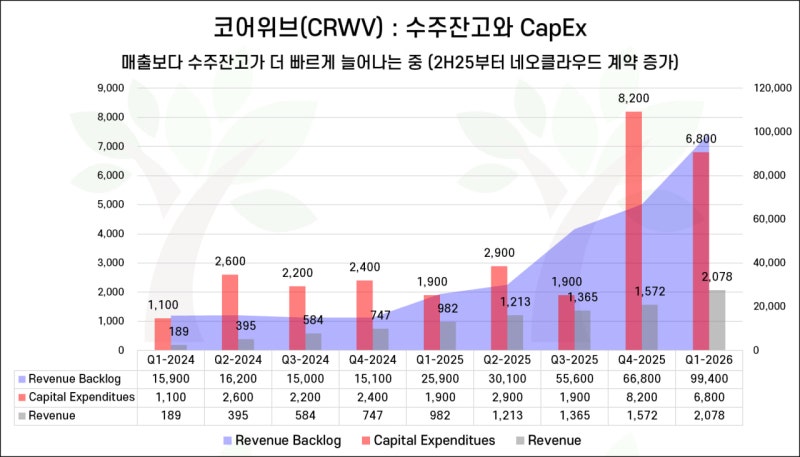
- Prepayments / RPO as financing: backlog $66.8B → $99.4B in one quarter (>$40B booked in CY 1Q26); RPO $98.8B.
- Non-IG AI Labs now <30% of backlog.
- Contract tenors stretched 3yr (2024) → 5–6yr (2026), matching the 6-yr GPU life.
- Magnetar's $230M "capacity deposit" with a 12% return multiplier is literally prepayment-as-debt (reclassified under ASC 470).
- Equity stack since pivot — the non-debt capital funding the buildout, a thinner slice that de-levers the parent (vs the ~$25B of DDTLs):
- IPO Mar 2025 — $1.49B net @ $40: primary public equity (net of fees), the base of the stack.
- OpenAI $350M: a customer taking equity in its supplier — the first thread of the ecosystem circularity.
- Nvidia $2.0B @ $87.20 (Jan 2026), on top of its 11.5% stake (13G/A): the chip supplier as major shareholder — the §4 thesis in cash (equity + GPU allocation + capacity backstop).
- $1.0B placement @ $109 (Apr 2026): note the rising price — $40 → $87.20 → $109 — each raise sells fewer shares per dollar, so less dilutive; cost of equity falling alongside cost of debt.
- $6.6B of converts: equity-linked debt (~1.75% coupon, conversion ~$107.80 / ~$119.60) — cheap capital now (investors pay via the conversion option), dilution later only if the stock clears the strike.
Nebius — the convertible machine
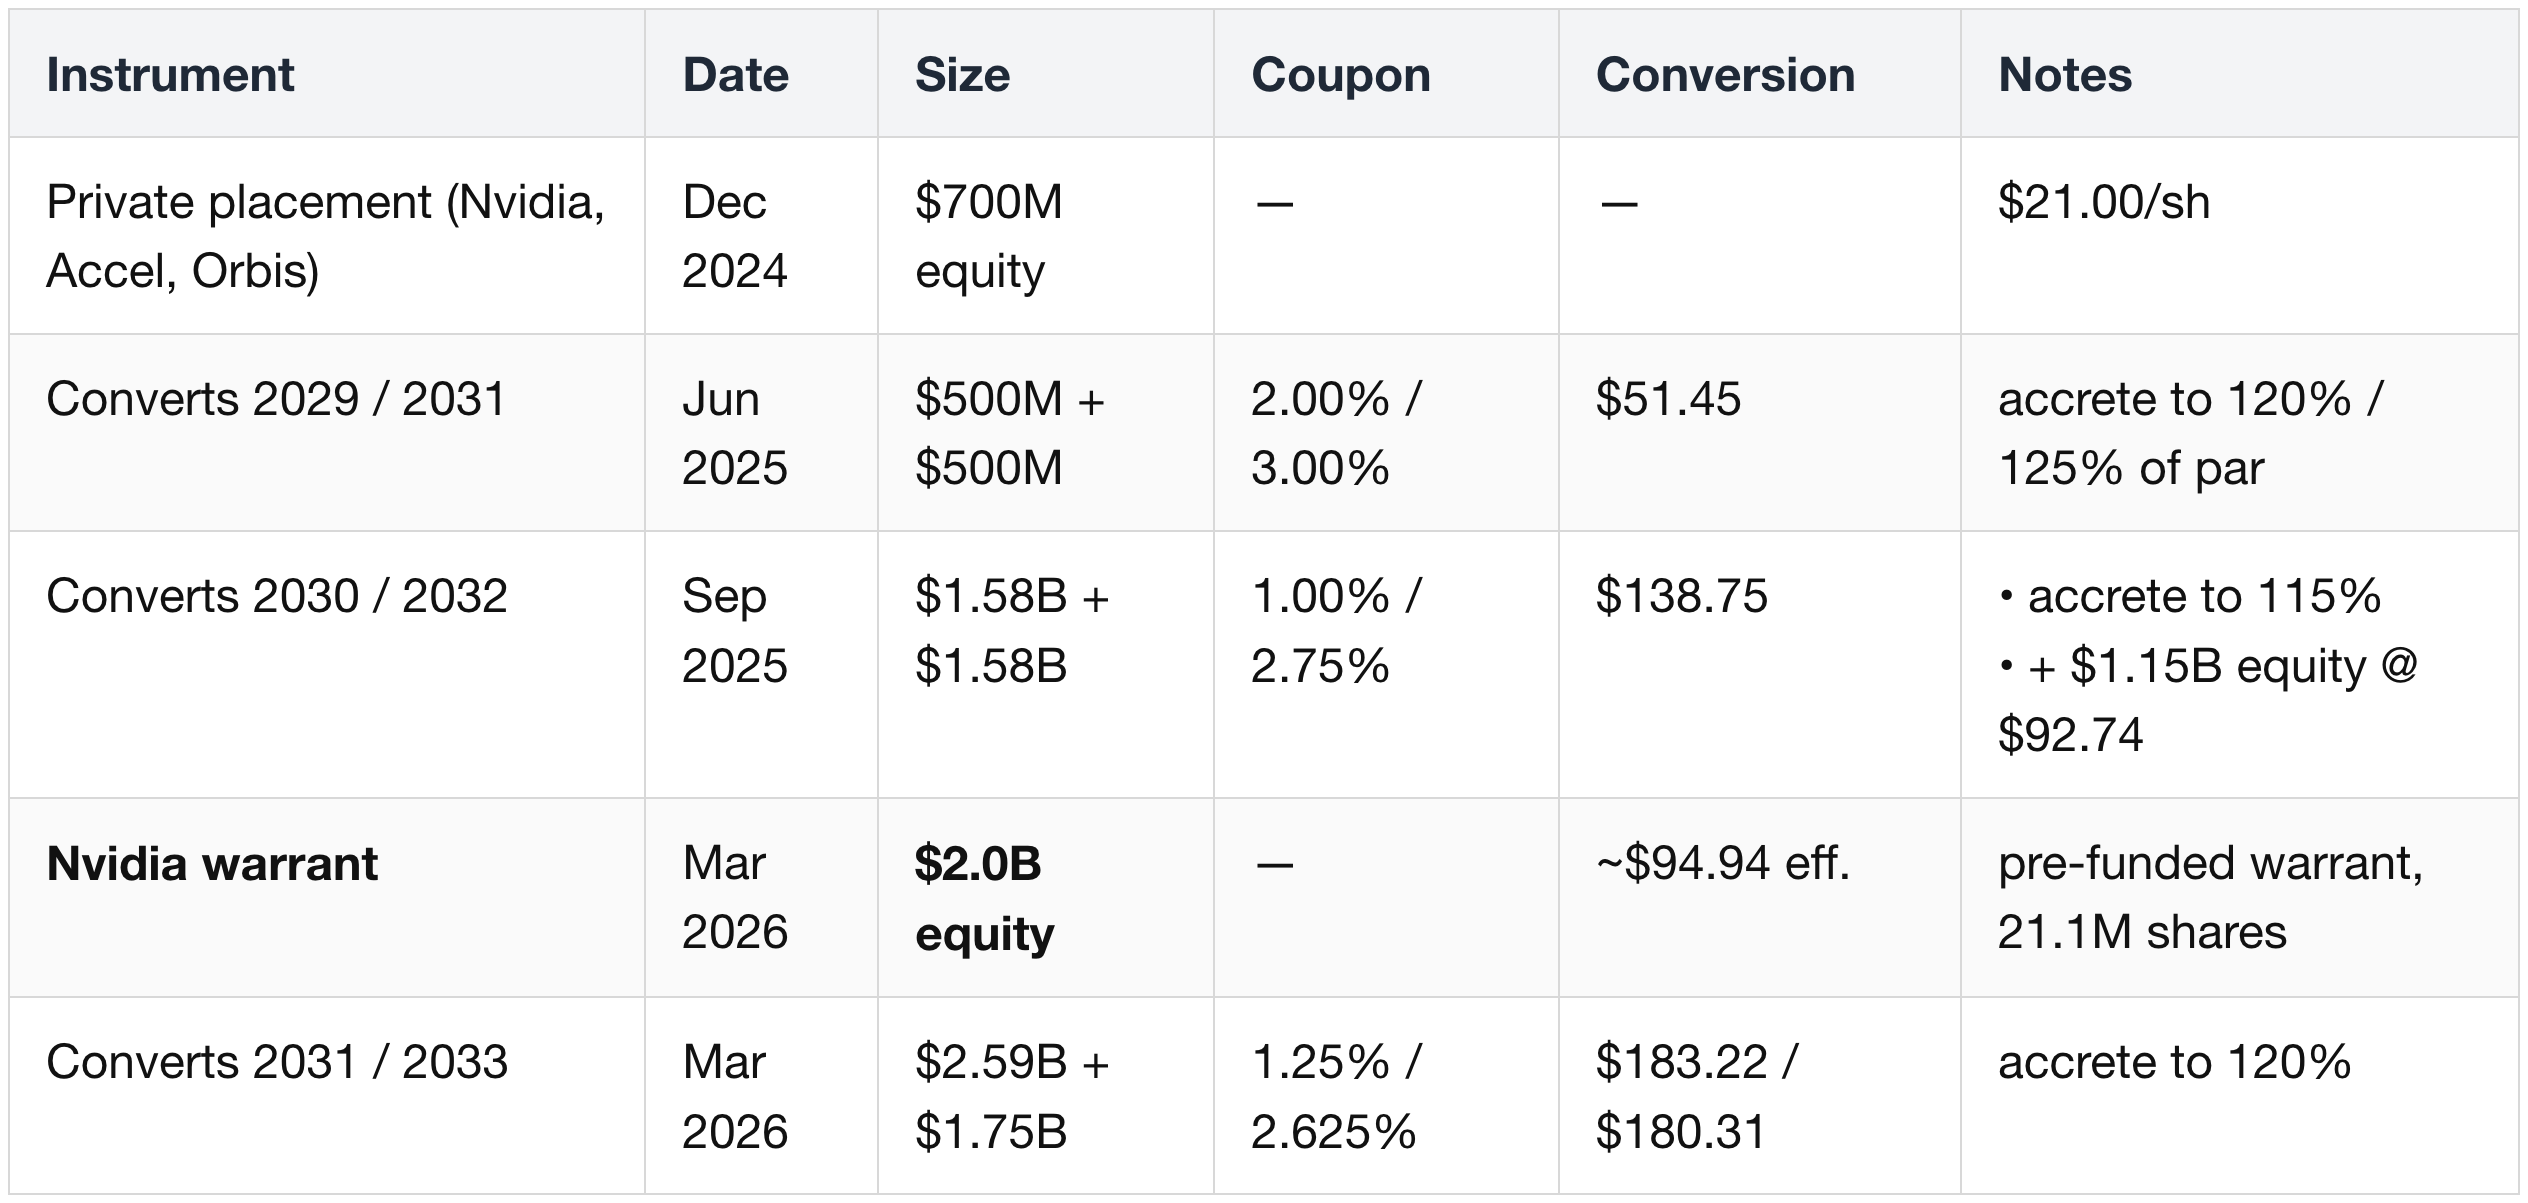
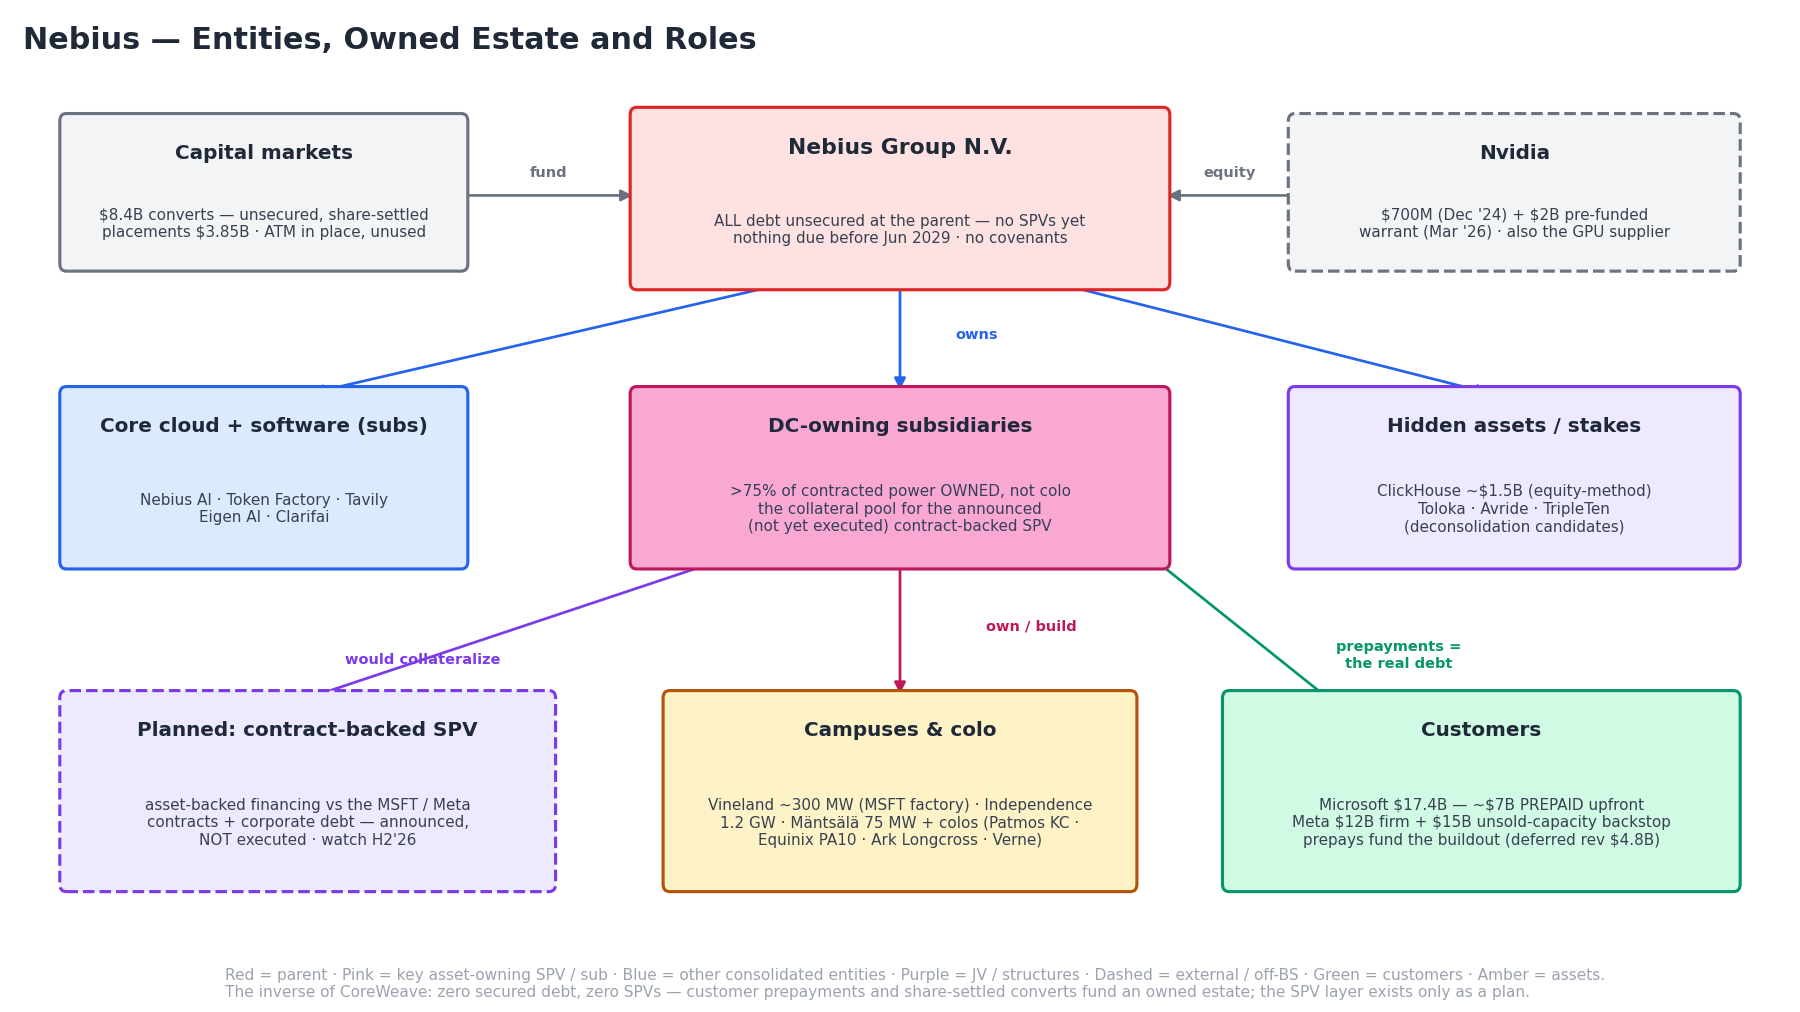
Started with $2.45B Yandex-sale cash and zero debt; built an all-unsecured, all-convertible stack in 21 months:
- Interest burden: FY25 $61.5M; CY 1Q26 $63.7M (~$255M annualized).
- Cash coupon is only ~1.9% on $8.4B principal; the GAAP effective rate (4.5–5%) is mostly non-cash accretion payable at maturity.
- Cash interest paid in FY25: $12.2M.
- Net interest only mildly negative — $9.3B of cash still earns.
- Maturity wall: nothing before Jun 2029.
- Accreted maturities: ~$0.6B (2029) → $1.8B (2030) → $3.7B (2031) → $1.8B (2032) → $2.1B (2033) ≈ $10.0B total.
- All share-settled — dilution risk, not refinancing risk. No financial covenants at all.
- Prepayments as the real debt — Nebius's biggest external funding isn't debt or equity but customer prepayments: cash upfront that funds the buildout, interest-free, non-dilutive, repaid in kind (by delivering compute). To read its true leverage, look here, not the debt line.
- Microsoft $17.4B TCV includes ~$7.0B upfront — ~40% pre-funded, and that cash builds the Vineland factory (TCV = total contract value).
- Meta 2026: $12B firm + up to $15B backstop on unsold capacity — a demand floor: Meta absorbs capacity Nebius builds but can't sell elsewhere, de-risking build-ahead.
- Deferred revenue $1.6B → $4.8B in CY 1Q26 (+$3.2B in one quarter) — the balance-sheet liability where the prepaid, not-yet-earned cash sits.
- Operating cash flow +$2.3B in CY 1Q26 — not from profit but from those prepays landing as an operating inflow; the mechanical proof that prepayments fund the fleet.
- RPO $21.3B → $33.6B (CY 1Q26) — the committed forward book (remaining performance obligations) that makes the model financeable.
- Contract-backed debt announced, not yet executed — asset-backed financing against the MSFT / Meta cash flows (the DDTL / SPV playbook) + corporate debt; watch H2'26 for the actual raise.
- Equity stack / hidden assets — equity raised at rising prices plus monetizable non-core stakes an AI-cloud multiple ignores; part of why Nebius needn't lever up:
- Placements — three raises at a rising price, so each is less dilutive than the last:
- $700M @ $21.00 (Dec 2024) — Nvidia / Accel / Orbis
- $1.15B @ $92.74 (Sep 2025)
- $2.0B @ ~$94.94 (Mar 2026) — Nvidia pre-funded warrant
- ATM program in place, unused — authorized At-The-Market equity dry powder, untapped; signals no cash pressure (prepays + converts cover it).
- ClickHouse stake remeasured to $1.5B — a fair-value markup on a real, monetizable holding, independent of the compute story.
- Toloka / Avride / TripleTen = deconsolidation candidates — subsidiaries; non-core businesses Nebius could spin off / sell down to crystallize cash and clean the story to a pure AI-cloud play.
- Customer concentration: one unnamed customer = 83% of gross AR (timing consistent with Microsoft) — the risk counterweight; the prepays and receivables lean on a single counterparty.
- Placements — three raises at a rising price, so each is less dilutive than the last:
- Read-through: NBIS finances at the lowest cash cost in the pool (~1.9%) by selling optionality on its own equity — cheap while the stock cooperates, painful dilution if the converts all land ($51–183 strikes).
IREN — prepay + A-rated SPV on a converted balance sheet
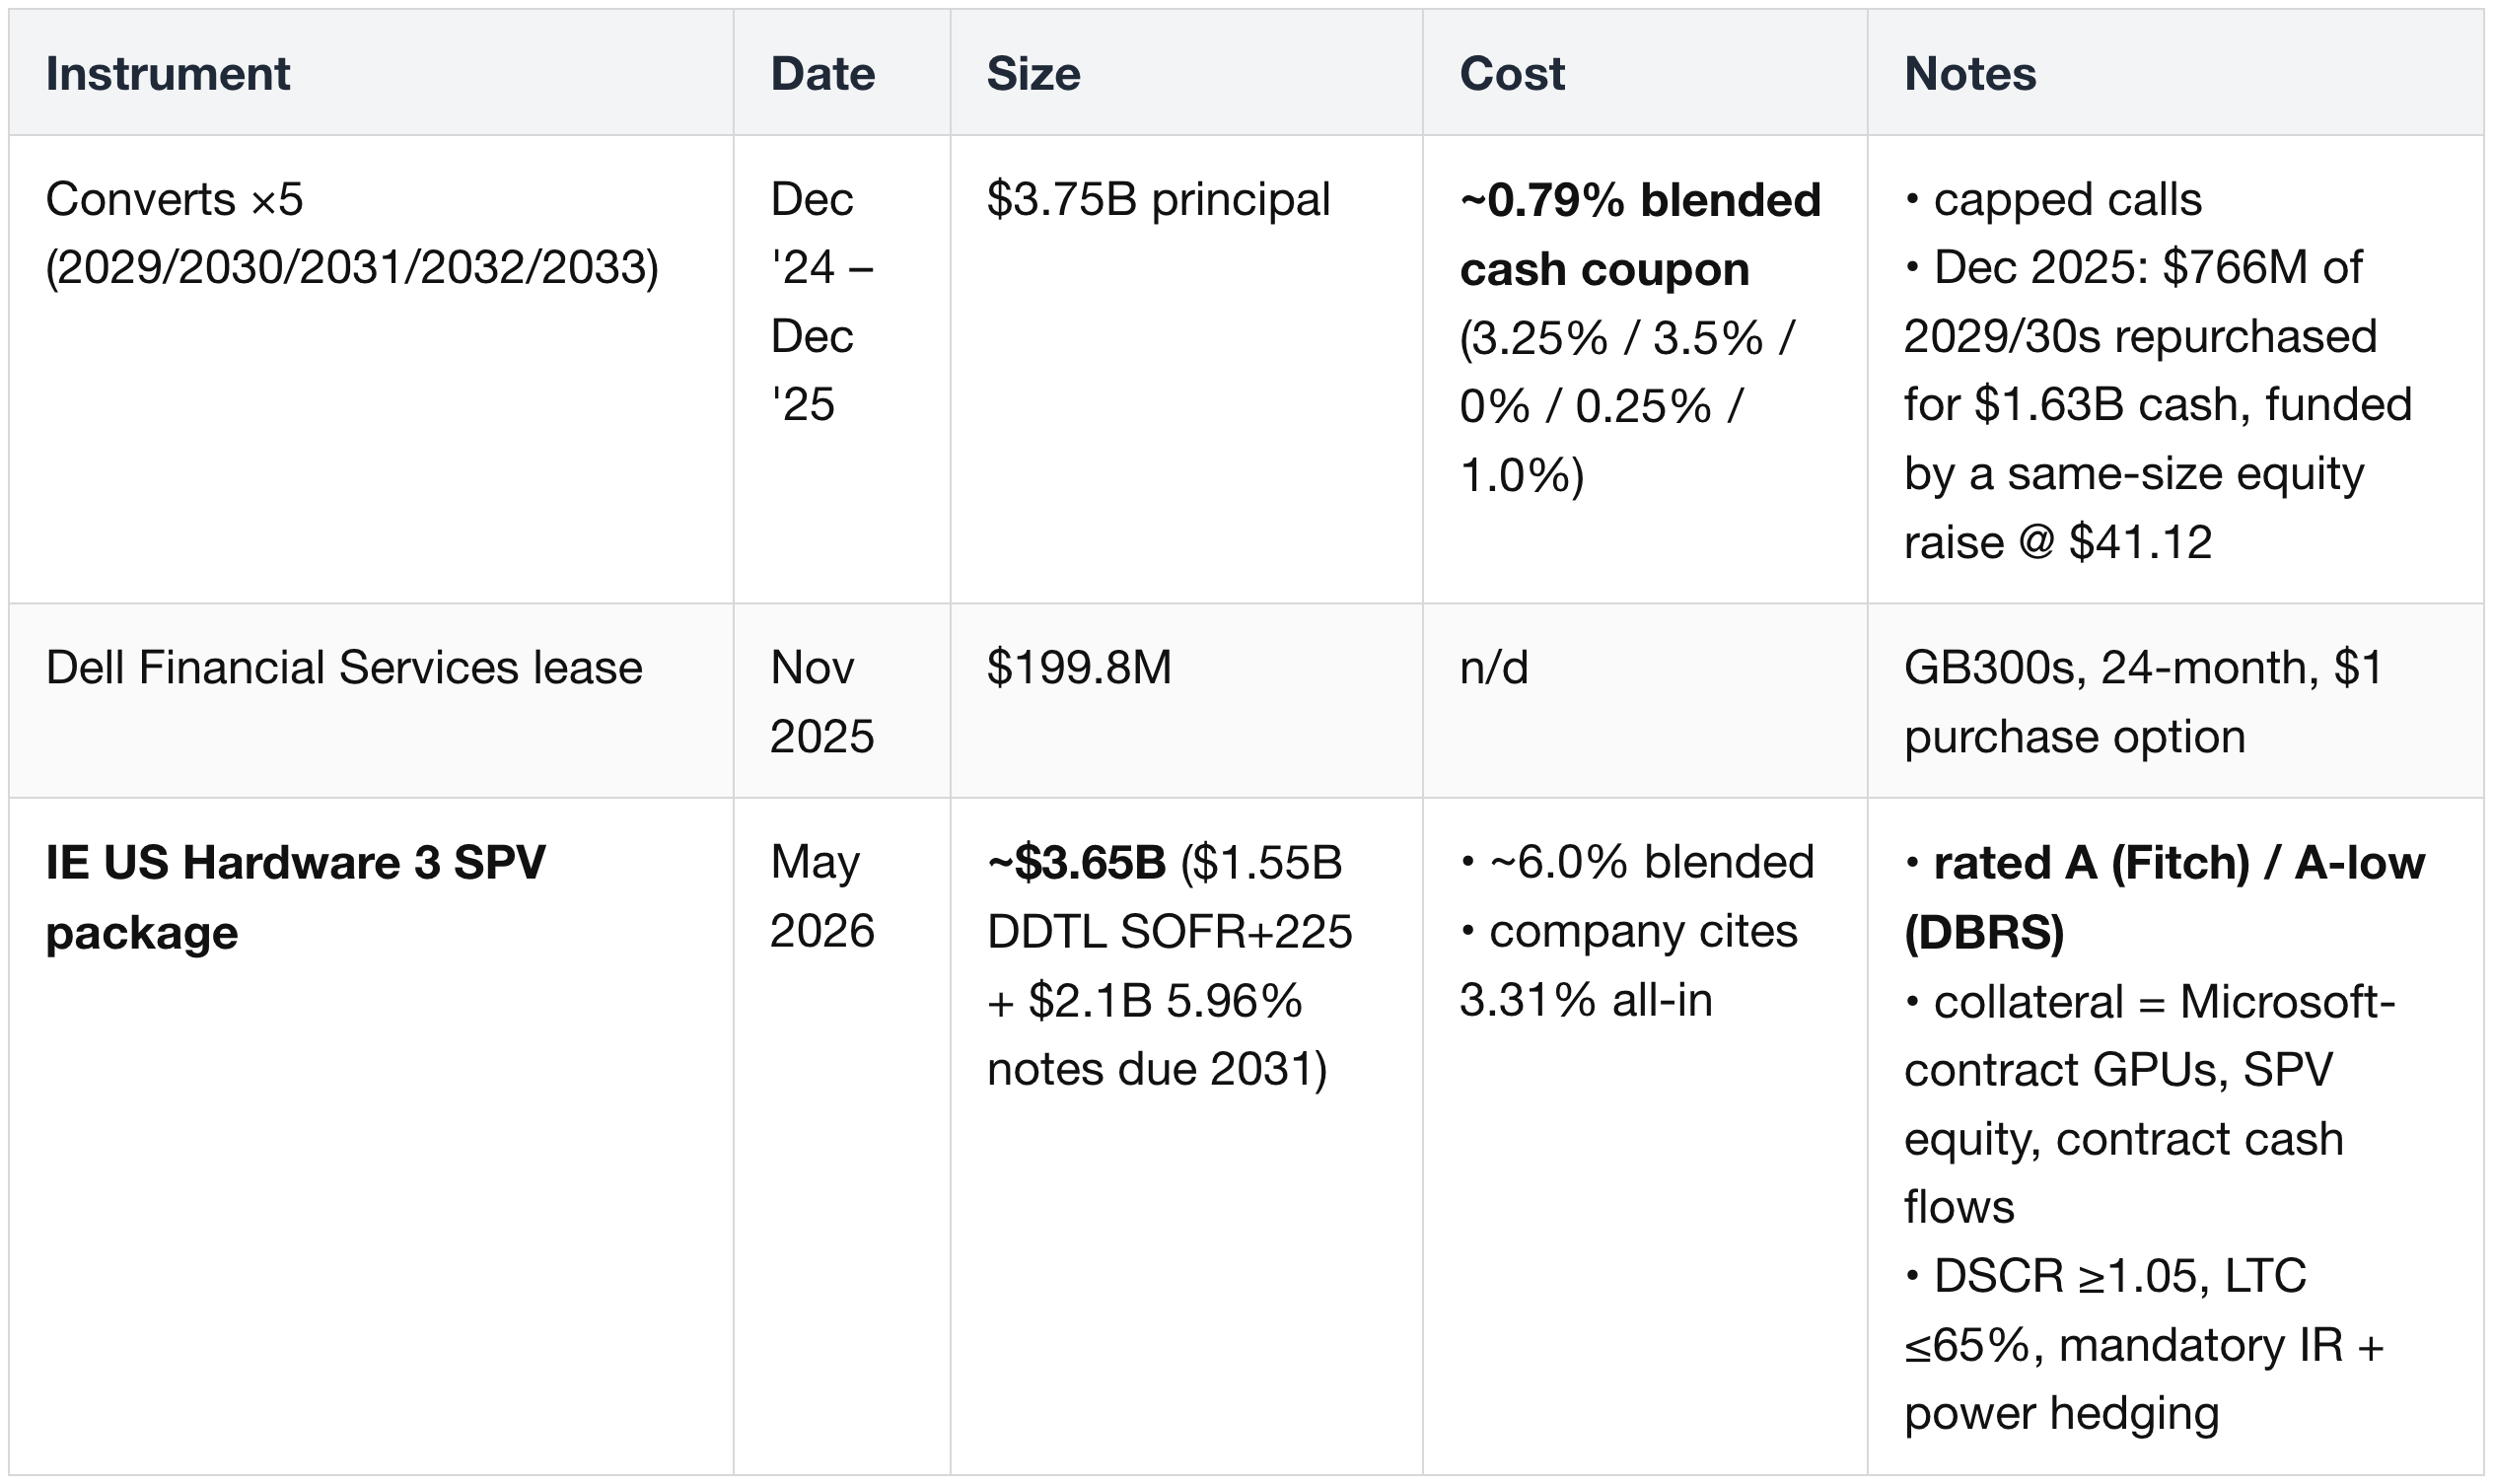
Legacy mining debt was gone by the pivot (NYDIG default settled $20M, non-recourse SPVs); the AI stack is:
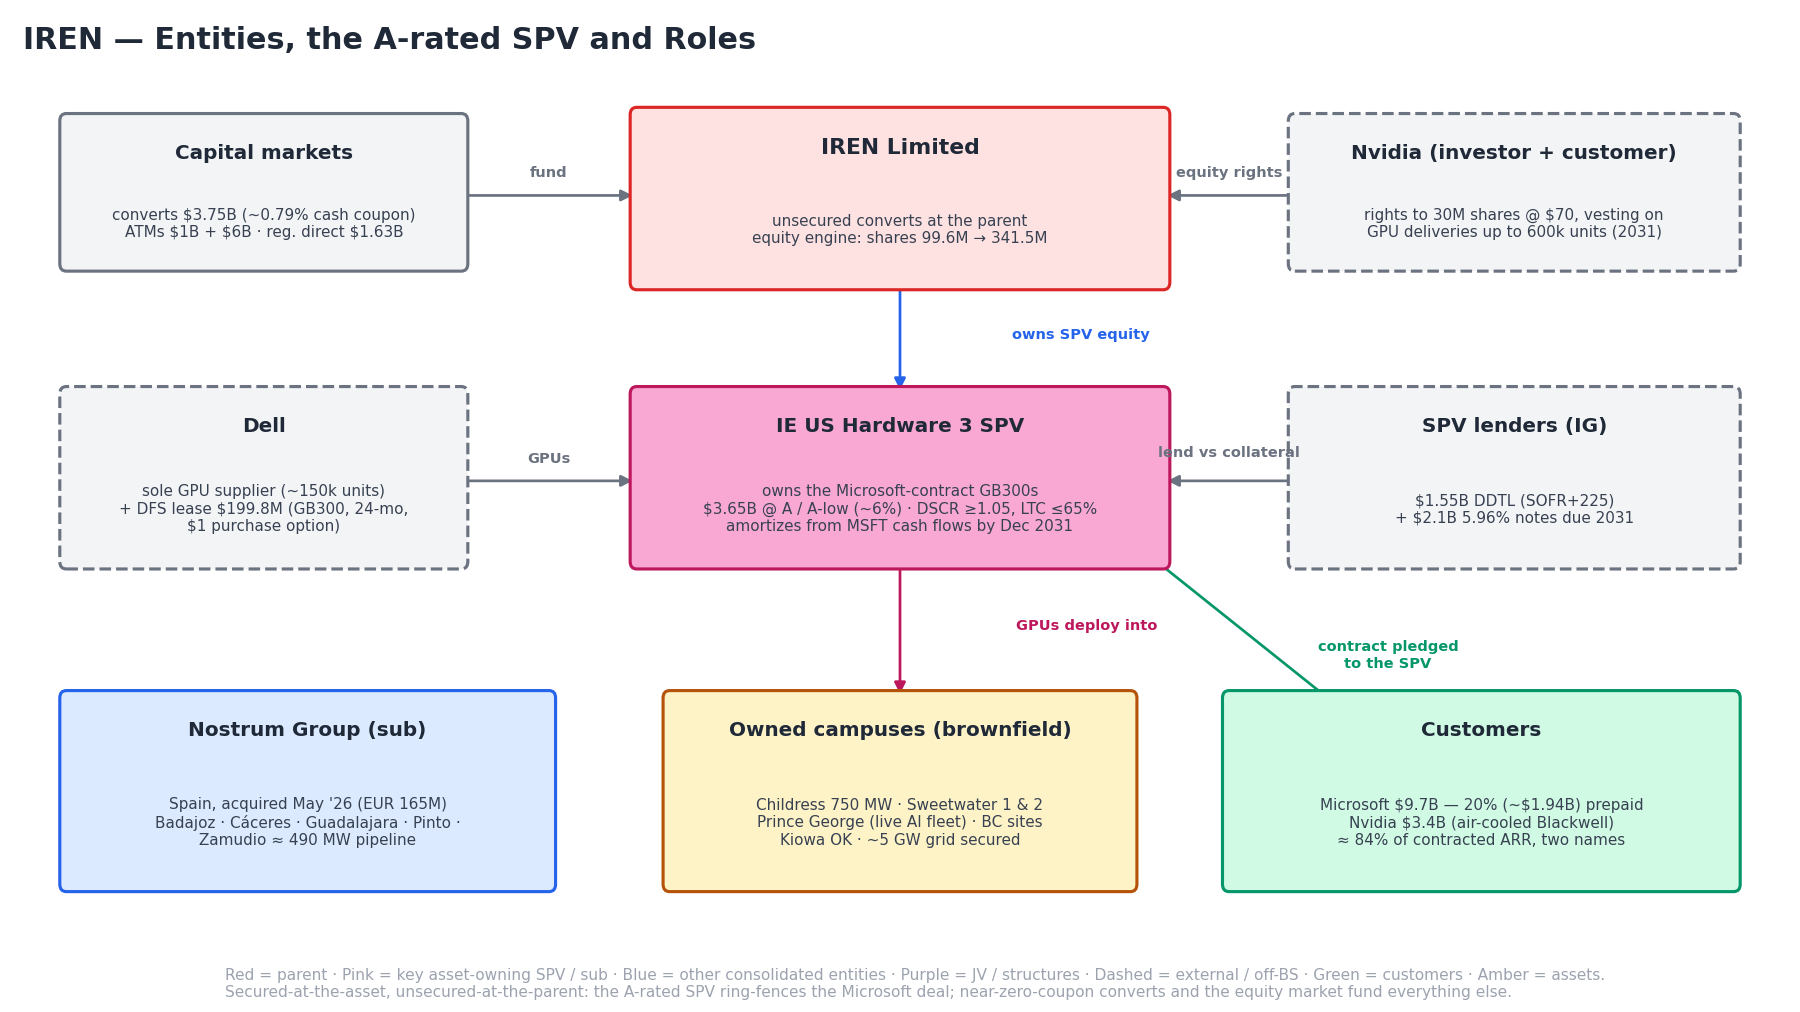
- IE US Hardware 3 SPV ↔ Nostrum Group: no connection. The SPV ring-fences the US Microsoft contract — its collateral is strictly the MSFT-contract GB300s at Childress, the SPV's equity, and that contract's cash flows; it amortizes from Microsoft payments alone. Nostrum sits entirely outside it: a separately funded corporate acquisition (EUR 165M, closed May 2026) building Spanish capacity with no US-contract linkage — SPV lenders have no claim on Nostrum, and Nostrum's buildout can't draw on the SPV. Same ring-fencing that protects the parent cuts both ways.
- Interest burden — the lightest in the pool, and uniquely net-interest-positive (IREN earns more than it pays):
- FY24 $0.1M → FY25 $11M → FY 3Q26 $14.8M (~$59M annualized) — near-zero until the pivot and still trivial vs peers (CRWV ~$2.1B, ORCL ~$5.75B). Why it stays low:
- the $3.75B of converts carry a ~0.79% blended cash coupon — holders are paid via the equity option, not interest.
- the only segment drawing down the loan — the $1.55B DDTL tranche of the ~$3.65B SPV package (the other $2.1B are notes funded upfront) — was executed May 2026 and has only just begun drawing, so most of its interest hasn't hit the P&L yet.
- Interest income $21.8M > expense $14.8M in the quarter → net interest positive — IREN earns more on its cash (equity raises + Microsoft prepays) than it pays on its near-zero-coupon debt. Uniquely in the pool interest is a contributor, not a drag — so the net loss comes from the mining→AI transition air-pocket (impairments, revenue gap), not the debt.
- Pro-forma, SPV fully drawn: up to ~$219M/yr; ~3.4% blended on the ~$7.4B stack — even at the ceiling ~3.4% (near-zero converts + the A-rated ~6% SPV) is second-cheapest after Nebius; the SPV draws to fund the Microsoft GPU capex and amortizes out of that contract's cash flows.
- FY24 $0.1M → FY25 $11M → FY 3Q26 $14.8M (~$59M annualized) — near-zero until the pivot and still trivial vs peers (CRWV ~$2.1B, ORCL ~$5.75B). Why it stays low:
- Maturity wall: effectively nothing due 2026–2028.
- The 2029 / 2030 converts ($446M) are deep in the money (strikes $13.64 / $16.81) — will convert to equity.
- SPV debt amortizes out of Microsoft cash flows by Dec 2031.
- Prepayments: Microsoft prepays 20% (~$1.94B) ahead of each tranche.
- Company framing: "$1.9B prepay + $3.6B financing = 95% of the GPU capex for the deal."
- Deferred revenue: $0.9M → $120.4M in nine months.
- Equity stack — the dilution engine of the pool:
- Weighted shares: 99.6M (FY24) → 341.5M (3/31/26).
- $1B ATM fully used; $6B ATM ~$1.06B used; $1.63B registered direct.
- Nvidia rights for 30M shares @ $70 (up to $2.1B), vesting on GPU-delivery volumes to 600k units.
- Read-through: secured-at-the-asset, unsecured-at-the-parent.
- The SPV isolates the Microsoft deal; converts carry near-zero cash coupon; the equity market pays for growth.
- Bear side: Microsoft + Nvidia ≈ 84% of contracted ARR; 5-yr zero-salvage depreciation on ~$9B of Dell hardware leaves no terminal-value margin for error.
Oracle — IG bond mass + a $260B lease shadow
Whole-company funding; the AI-era ledger (FYE May 31):
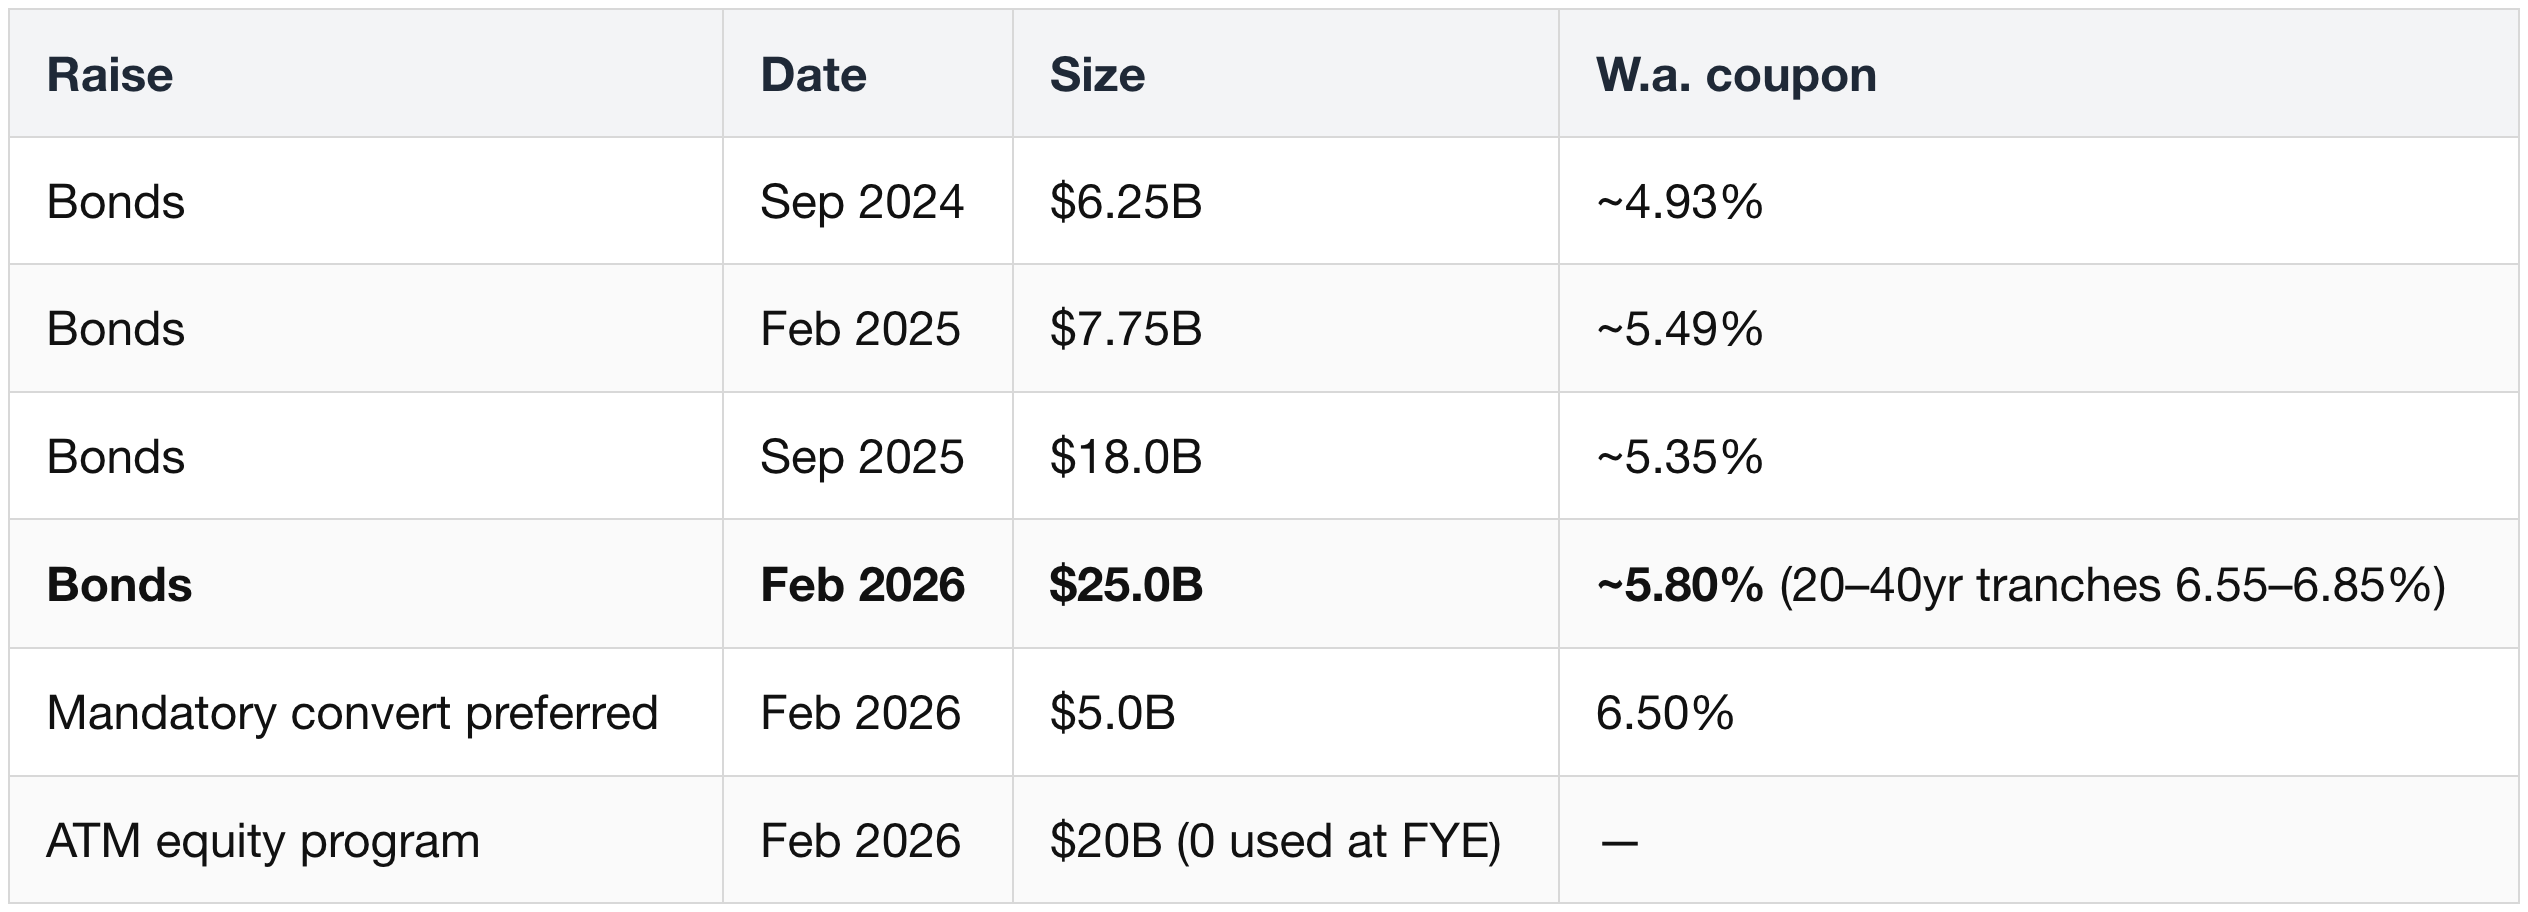
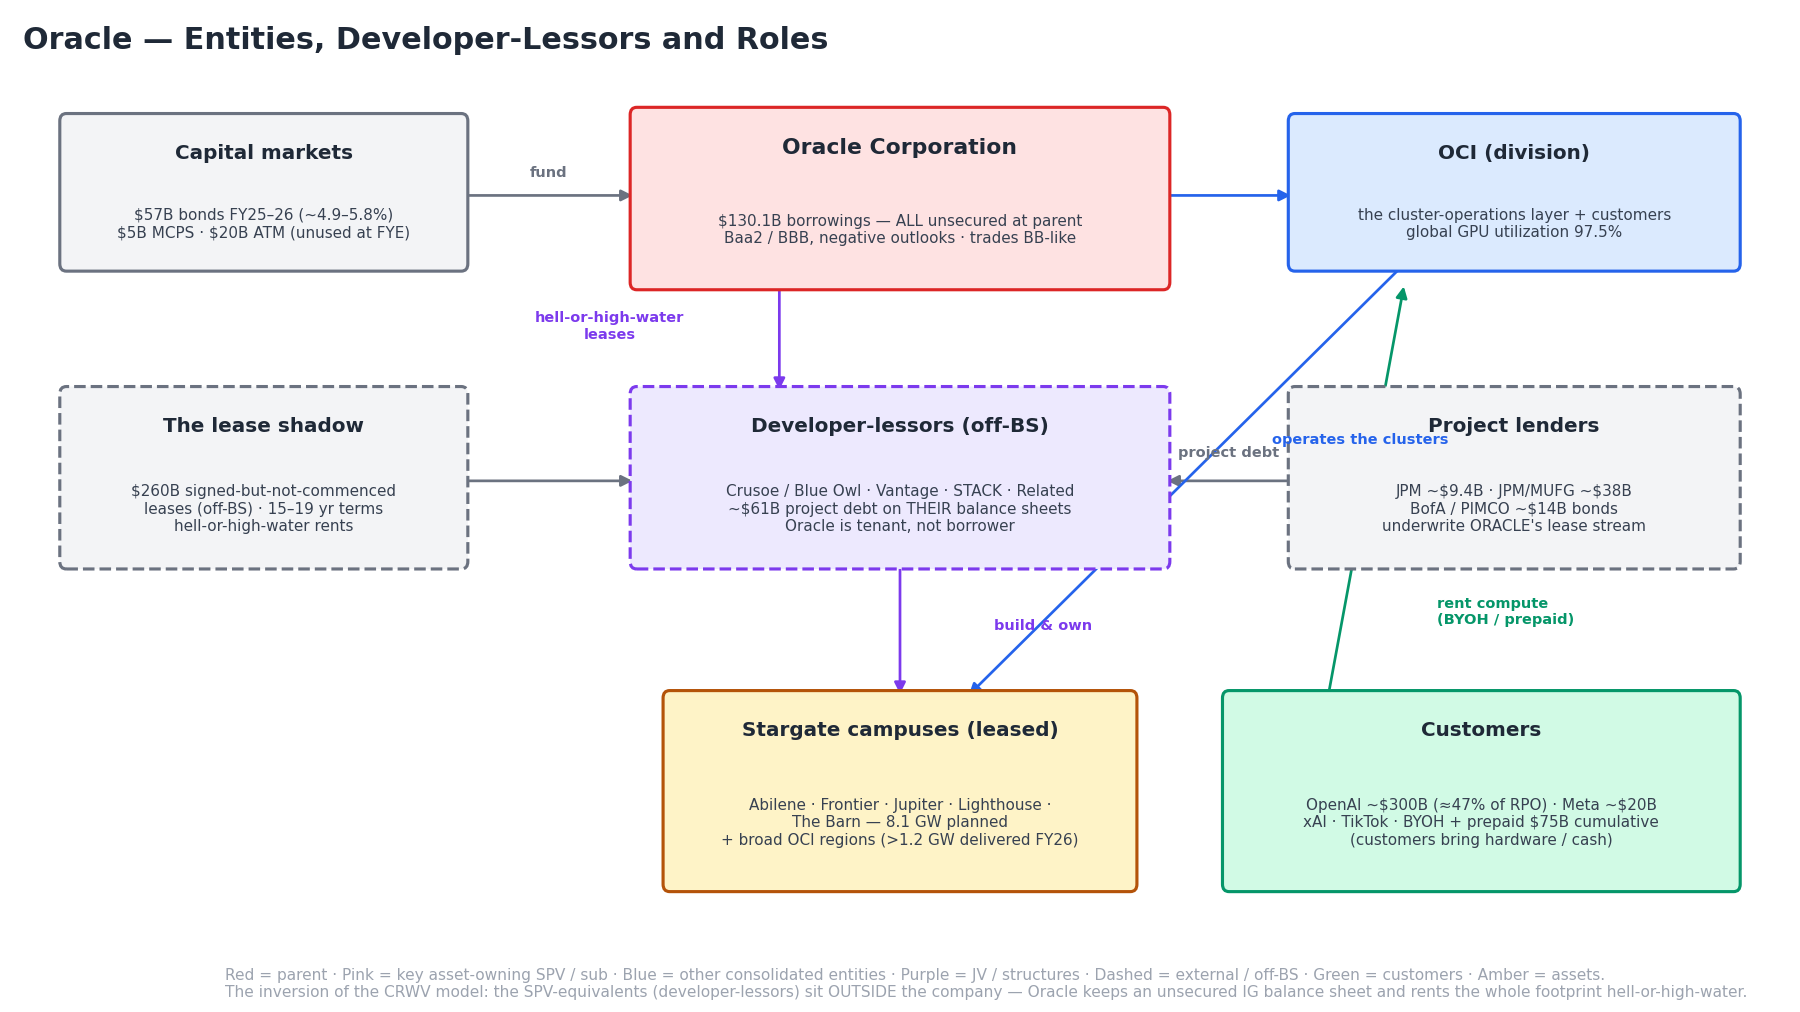
- Borrowings:
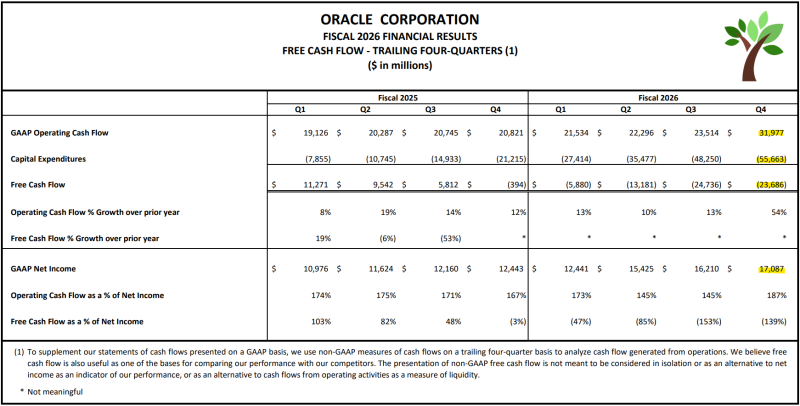
- ~$87B (FY24) → $92.9B (FY25) → $130.1B (FY26)
- finance leases $7.7B,
- operating leases $30.2B on balance sheet.
- The shadow ledger — signed-but-not-commenced datacenter leases (off-BS):
- $22.9B (5/24) → $43.4B (5/25) → $99.8B (8/25) → $248B (11/25) → ~$260B (5/26, per coverage — FY26 10-K print pending verification); 15–19 year terms.
- Behind the leases sits developer-level project debt Oracle doesn't consolidate (~$60B+, off Oracle's own balance sheet) — it never hits Oracle's books; only the lease obligation does:
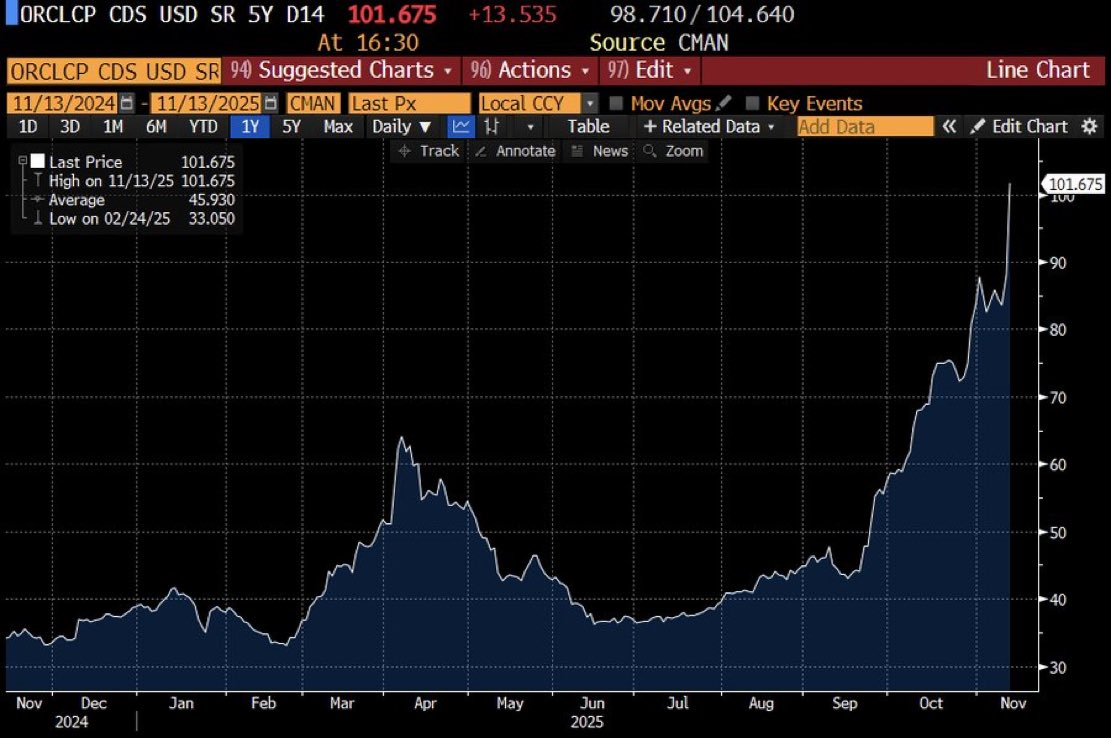
The $248B print triggered the Dec 2025 CDS scare: 5-yr CDS ~105–110bp (Nov) → 139bp (Dec 11, a 16-year high).
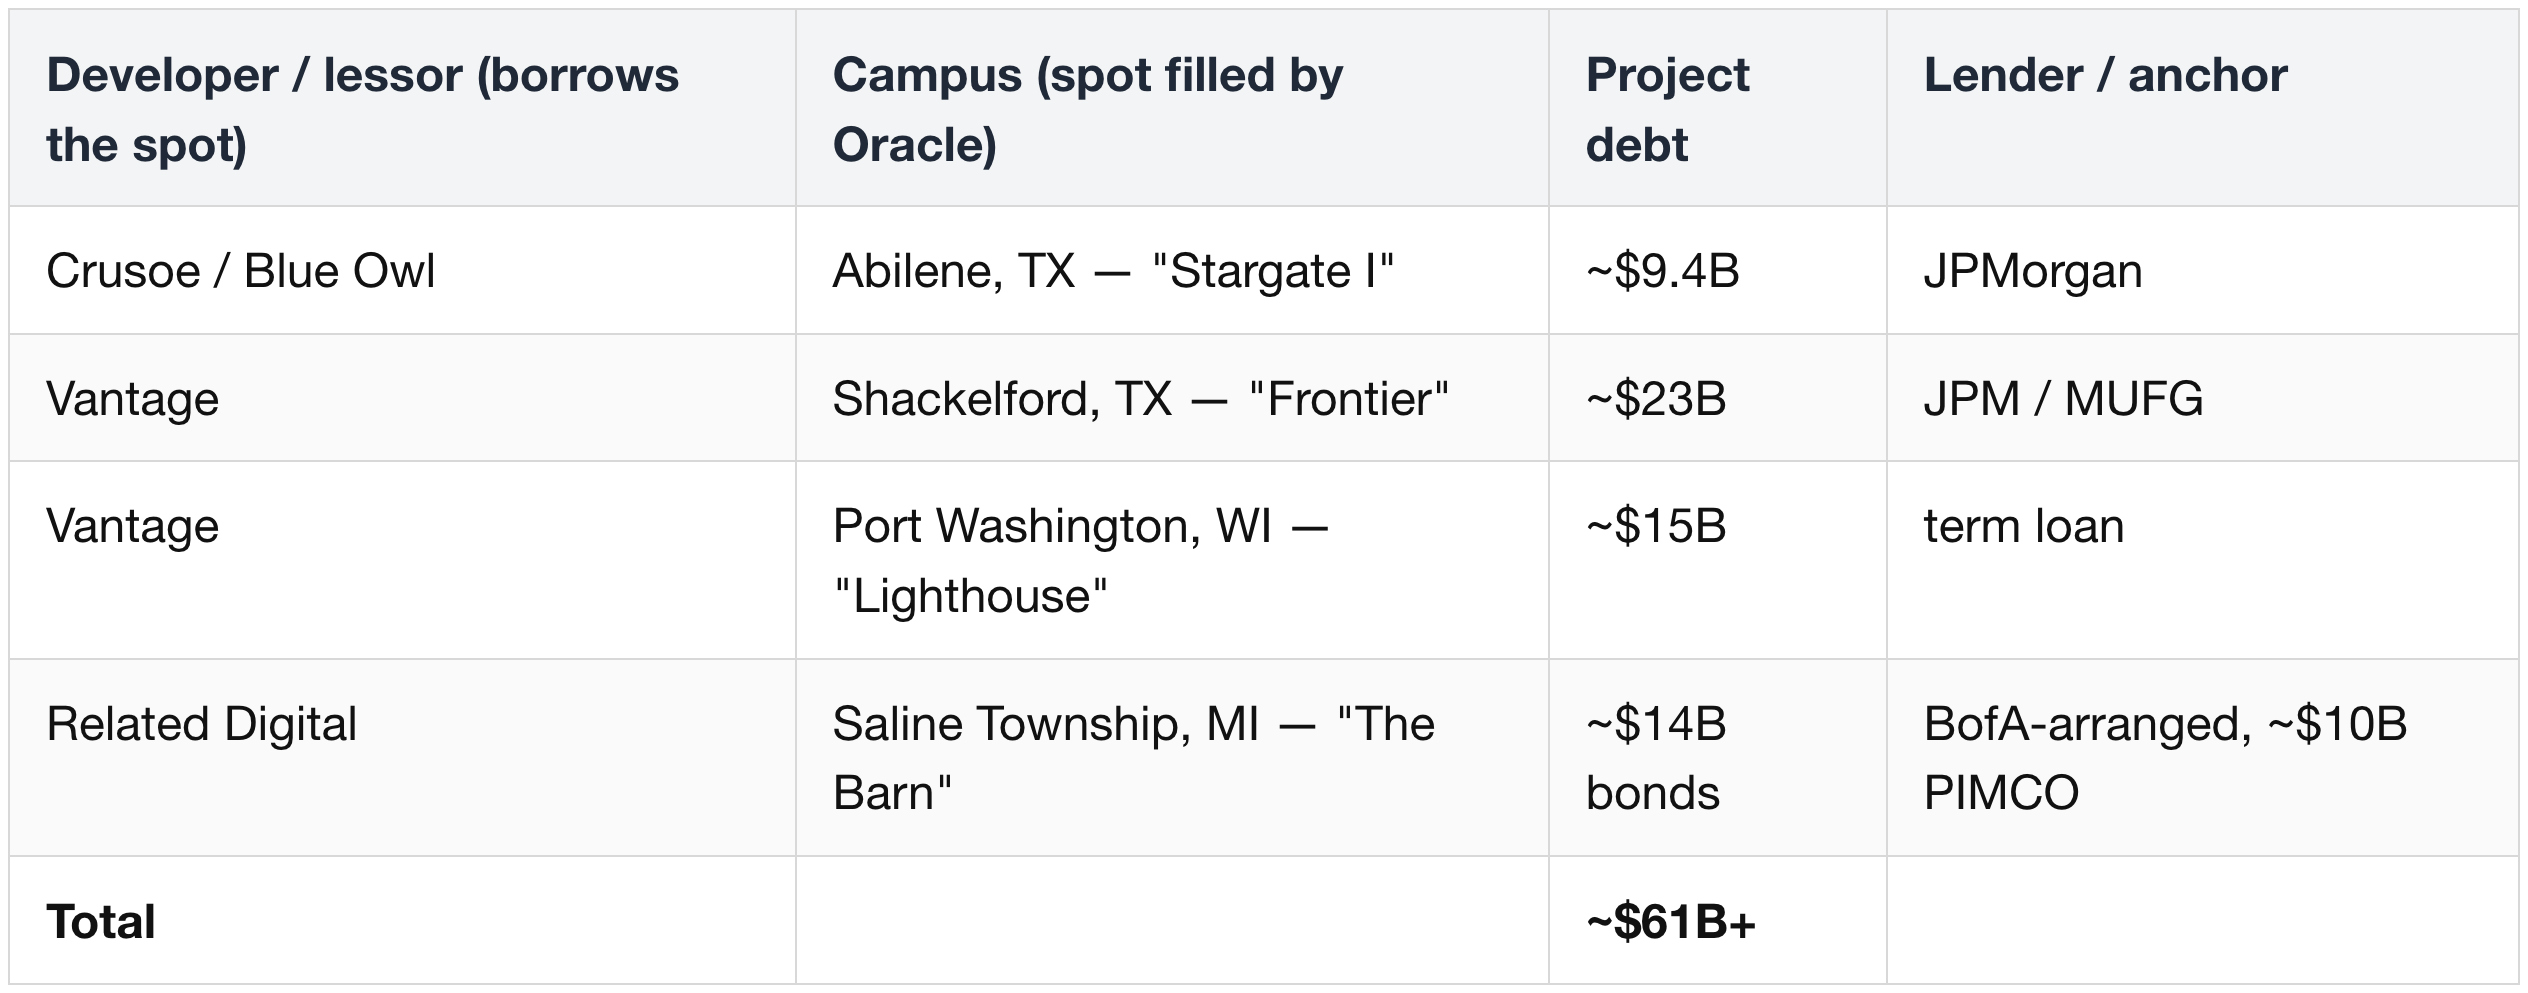
- Why it's off-books yet on-risk: the lease splits two things a normal loan keeps together — who owes the bank (the developer; Oracle is a tenant, not a borrower) vs who eats an empty building (Oracle). Oracle's rent is what repays the developer's loan, so the debt stays off Oracle's books while the utilization risk lands on Oracle.
- Hell-or-high-water clauses make Oracle pay full rent unconditionally — regardless of utilization, GPU faults, or whether OpenAI pays. So lenders (JPM, PIMCO) underwrite Oracle's IG lease stream, not the developer: the risk flows to Oracle even though the debt isn't on its books, and Oracle bears the utilization risk (empty or full, same rent, and that rent services the developer's loan).
- Understated leverage: this ~$60B+ sits in neither Oracle's $130B borrowings nor the $260B lease shadow — a third layer behind both.
- Oracle's neocloud-ness lives here — the same contract → collateralized-buildout-debt chain as CoreWeave, one rung over:
- CoreWeave finances on its own books via SPVs (GPUs + contract, non-recourse DDTLs — ~$25B visible).
- Oracle routes the identical economics through the lessors' balance sheets; the hell-or-high-water lease is what makes the developer's project debt bankable.
- Same "match debt to contract" playbook (CRWV DDTL / IREN SPV / xAI GPU SPV), just via lessor project bonds — which is why it's "the levered index of the whole trade."
- Interest burden — climbing fast, but the pressure point is the rating, not coverage:
- FY24 $3.51B → FY25 $3.58B → FY26 $4.60B — the ~$1B FY26 jump is the AI-era bonds landing ($18B Sep '25 + $25B Feb '26).
- Exit run-rate ~$5.75B/yr (FY 4Q26 $1,438M × 4) before any new debt — debt added through the year means the current pace already runs above the FY26 average; a floor that only rises if Oracle borrows more.
- Blended cost ~4.1%, marginal ~5.8% — new debt costs well above the average (kept low by old cheap bonds), so the blended rate drifts up as cheap debt rolls off. Interest rises structurally, not just with volume.
- Coverage 4.5x EBIT (~9x on the tested EBITDA basis) vs a ≥3.0x revolver covenant — ample — profit covers interest many times over; no covenant-breach risk despite the rising bill. Key numbers tabled below.
- Coverage ratio = operating profit ÷ interest expense — how many times over profit can pay the interest bill. 4.5x means EBIT is 4.5× interest. In one year, Oracle's EBIT is 4.5x that same year's interest bill.
- Covenant = a contractual condition in Oracle's revolving credit facility (revolver): coverage must stay ≥3.0x, or it's a breach — at which point lenders can restrict further borrowing or call the loan.
- Why two numbers (4.5x vs ~9x): the covenant is tested on EBITDA, not EBIT. EBITDA adds back depreciation / amortization (non-cash), and Oracle's datacenter / GPU D&A is large — so EBITDA ≫ EBIT, putting coverage on the basis the covenant actually uses at ~9x, vs the stricter 4.5x EBIT figure.
- "Ample" = ~9x sits 3× above the 3.0x floor — big headroom, so even a rising interest bill is not a near-term covenant risk.

Interest ≈ 22% of EBIT (1 ÷ 4.5). The covenant is tested on the EBITDA line — the wider ~9x — so that's the number with the real headroom. Separately, S&P's downgrade trigger is a leverage ratio (Debt / EBITDA > 3.5x), not this coverage ratio.
- Ratings Baa2 / BBB, negative outlooks (S&P downgrades above 3.5x leverage) — two notches from junk, yet the bonds already trade at BB-like spreads: the market prices more risk than the agencies rate, on the AI-capex binge + the off-BS shadow.
- Bonds rallied Jun 11 on "no additional debt funding in calendar 2026" — relief on supply (the same fear behind the Dec '25 CDS scare); shows how twitchy the market is about incremental Oracle debt:
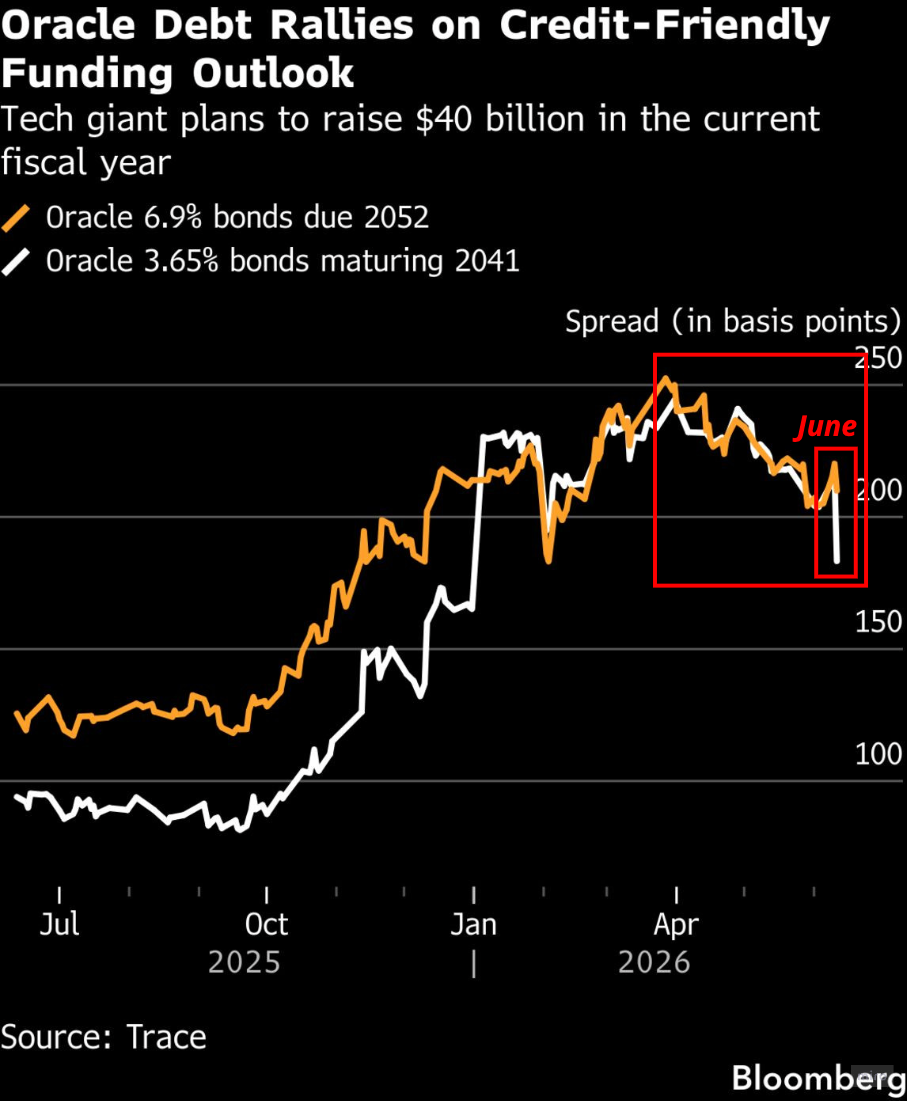
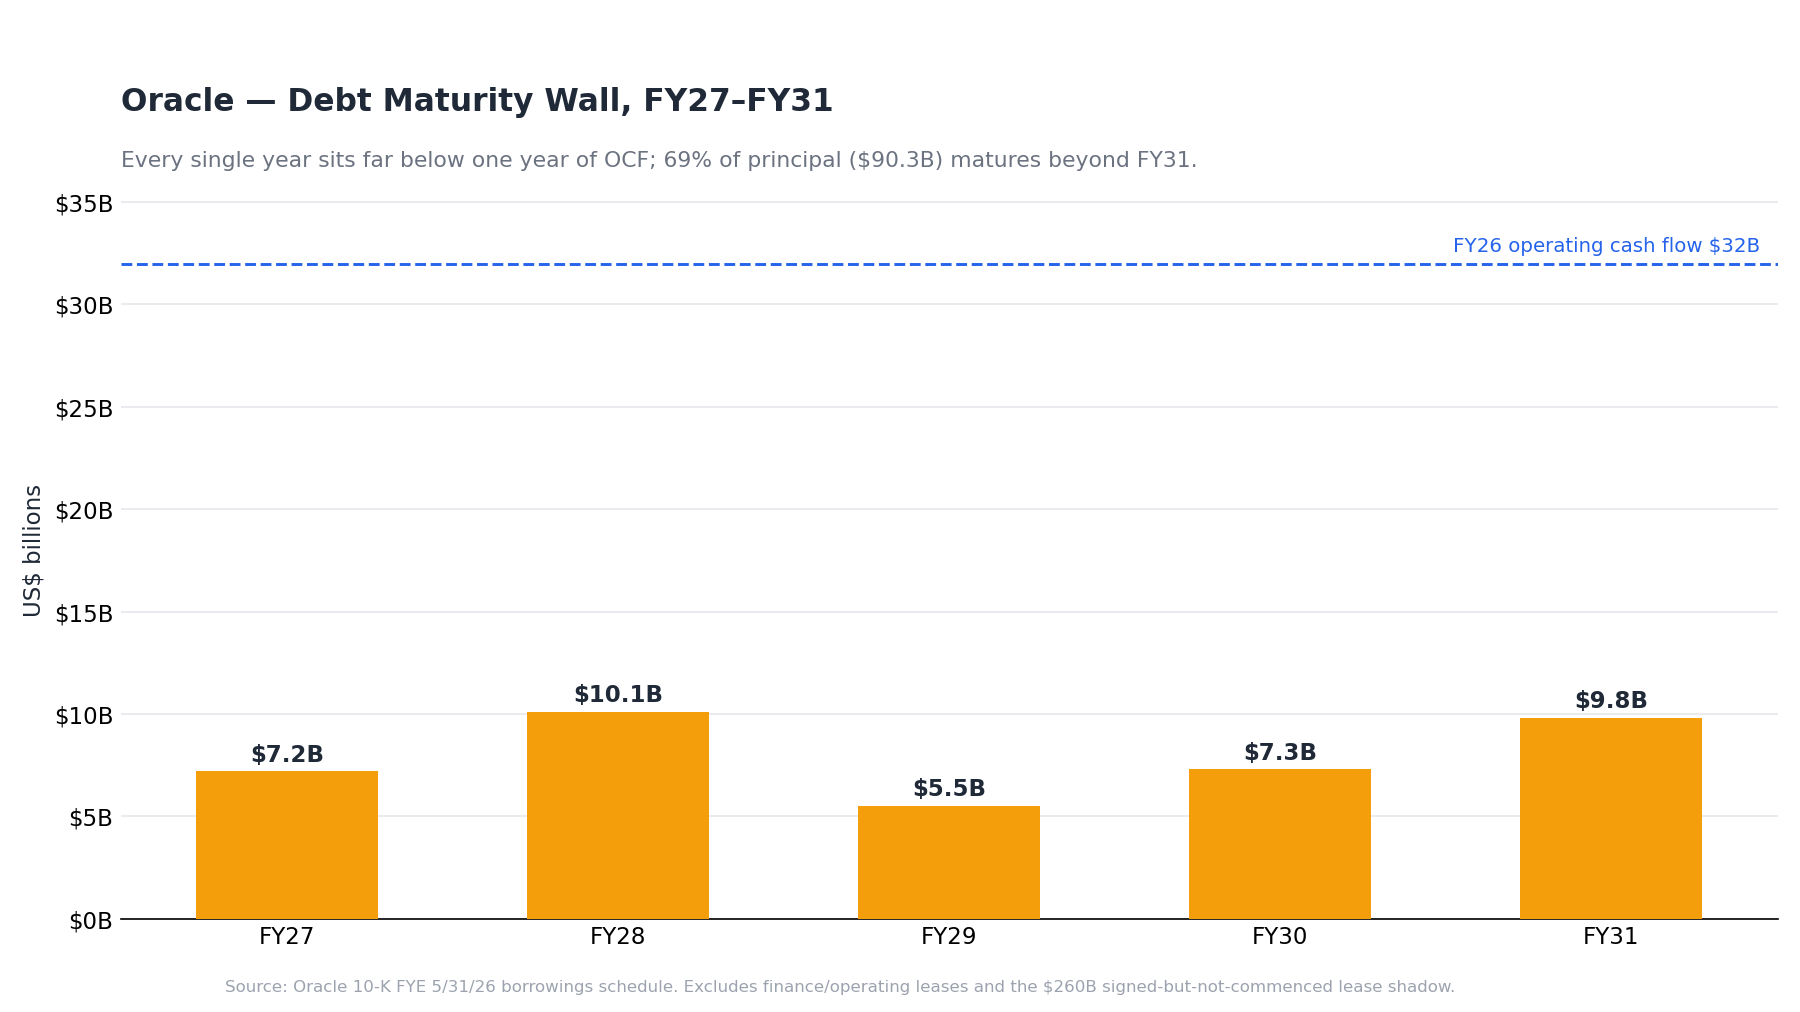
Maturity wall vs one year of operating cash flow — every annual bar sits far below FY26 OCF of $32B. Excludes leases and the $260B lease shadow.
- Maturity wall: FY27 $7.2B, FY28 $10.1B, FY29 $5.5B, FY30 $7.3B, FY31 $9.8B, thereafter $90.3B (69% beyond FY31) — long duration is the one clean advantage of IG access.
- Composition: overwhelmingly the IG bond stack — legacy low-rate-era bonds plus the AI-era raises ($6.25B Sep '24, $7.75B Feb '25, $18B Sep '25, $25B Feb '26, the last with 20–40yr tranches). Long tenors at issue are exactly why the wall is back-loaded: 69% of principal sits beyond FY31.
- How to read it: the largest single year (FY28, $10.1B) is under one-third of one year's OCF ($32B) — Oracle can retire any year's wall from cash flow alone. Rolling maturities isn't the risk; the catch is that each refi swaps a legacy coupon for the ~5.8%+ marginal rate, feeding the blended-cost drift.
- i.e. refinancing a maturing bond retires a cheap low-rate-era coupon (~3%) and reissues at today's ~6% — same principal, ~double the interest on that slice (on FY28's $10.1B, ≈ +$0.3B/yr) — so each maturity date converts cheap debt into expensive debt.
- The contrast with CRWV: CoreWeave faces $11.8B due 2026–27 against ~$13–25B revenue — its wall is a live constraint. Oracle's is not; its pressure point is funding new capex, not repaying old debt.
- Prepayments / BYOH — the FY 4Q26 inflection:
- BYOH = "bring your own hardware": the customer buys or finances the GPUs itself and brings them into Oracle's datacenters; Oracle supplies the shell, power, networking, and the cluster-operations layer as a service.
- For Oracle the deal is capex-light: it books AI-infrastructure revenue without fronting the GPU purchase.
- Margins hold — "no degradation in margin compared to our other contracts" (CEO), "similar or better margins" (CFO); and ROIC is structurally higher, since the return comes on less invested capital.
- The risk transfer: the customer owns the depreciating asset, so GPU-obsolescence risk shifts to the customer; Oracle keeps the operations fee.
- Prepaid = the customer pays cash upfront on a normal Oracle-owned deal — the financing-component prepayments: $4.6B received in FY26 (zero in prior years), $20–25B expected FY27.
- $67B of AI contracts signed in FY 4Q26 alone, majority BYOH or prepaid; cumulative $75B (~12% of RPO).
- The capex arithmetic: prepays net against reported capex to give "net cash outlay" — FY27 reported capex $90–95B; taking out $20-25B prepayment gives ~$70B net
- "Net cash outlay" is a management metric debuted this quarter: (1) gross capex minus (2) the prepaid cash from customers.
- If Oracle spends ~$92B but collects ~$22B of prepays, its own wallet is only ~$70B lighter — the customer's cash arrives before the spend it funds ("we collect money upfront, so it does not come out of our funding" — CFO).
- FY26 already worked this way, smaller: reported capex $55.7B → $48B net after ~$8B of prepayments / timing.
- The funding plan balances: ~$30B OCF + ~$40B external (≈ half the $20B ATM equity, half debt) ≈ the $70B net outlay.
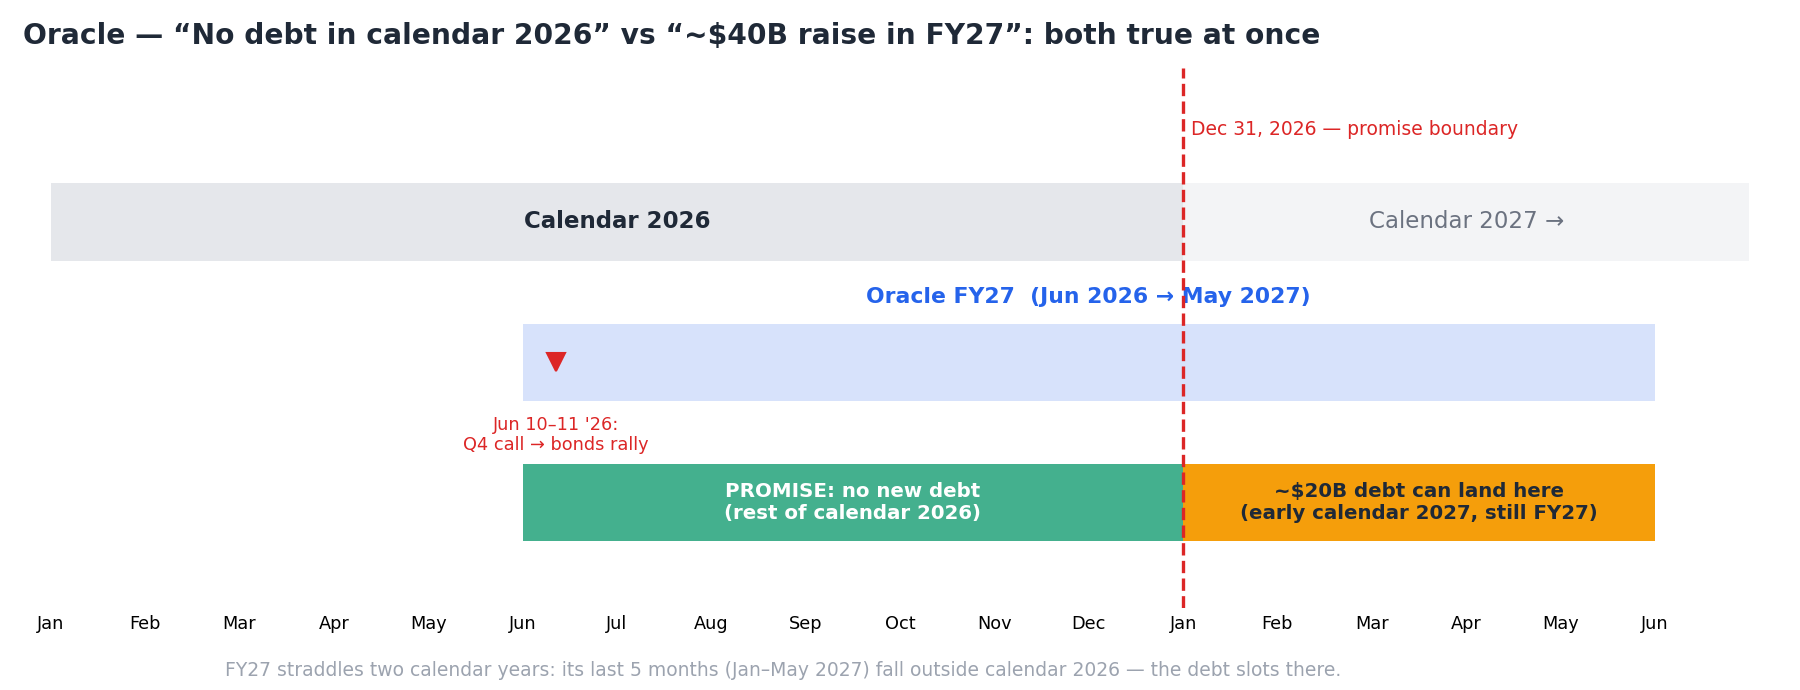
- "No additional debt in calendar 2026" reconciles with FY27 debt plans via the calendar: FY27 runs Jun 2026–May 2027, so the ~$20B debt half of the raise can land in early calendar 2027 while the promise holds — both statements are true at once.
- Why it matters: BYOH + prepay is customers bringing capital to Oracle — the same customers-finance-the-supplier pattern as Nebius's $7B upfronts and IREN's 20% Microsoft prepay, and the strongest evidence that cluster operations, not GPU ownership, is the scarce skill.
- BYOH = "bring your own hardware": the customer buys or finances the GPUs itself and brings them into Oracle's datacenters; Oracle supplies the shell, power, networking, and the cluster-operations layer as a service.
Funding plan ≈ $30B OCF + $40B external (incl. the $20B ATM), with "no additional debt funding in calendar 2026."
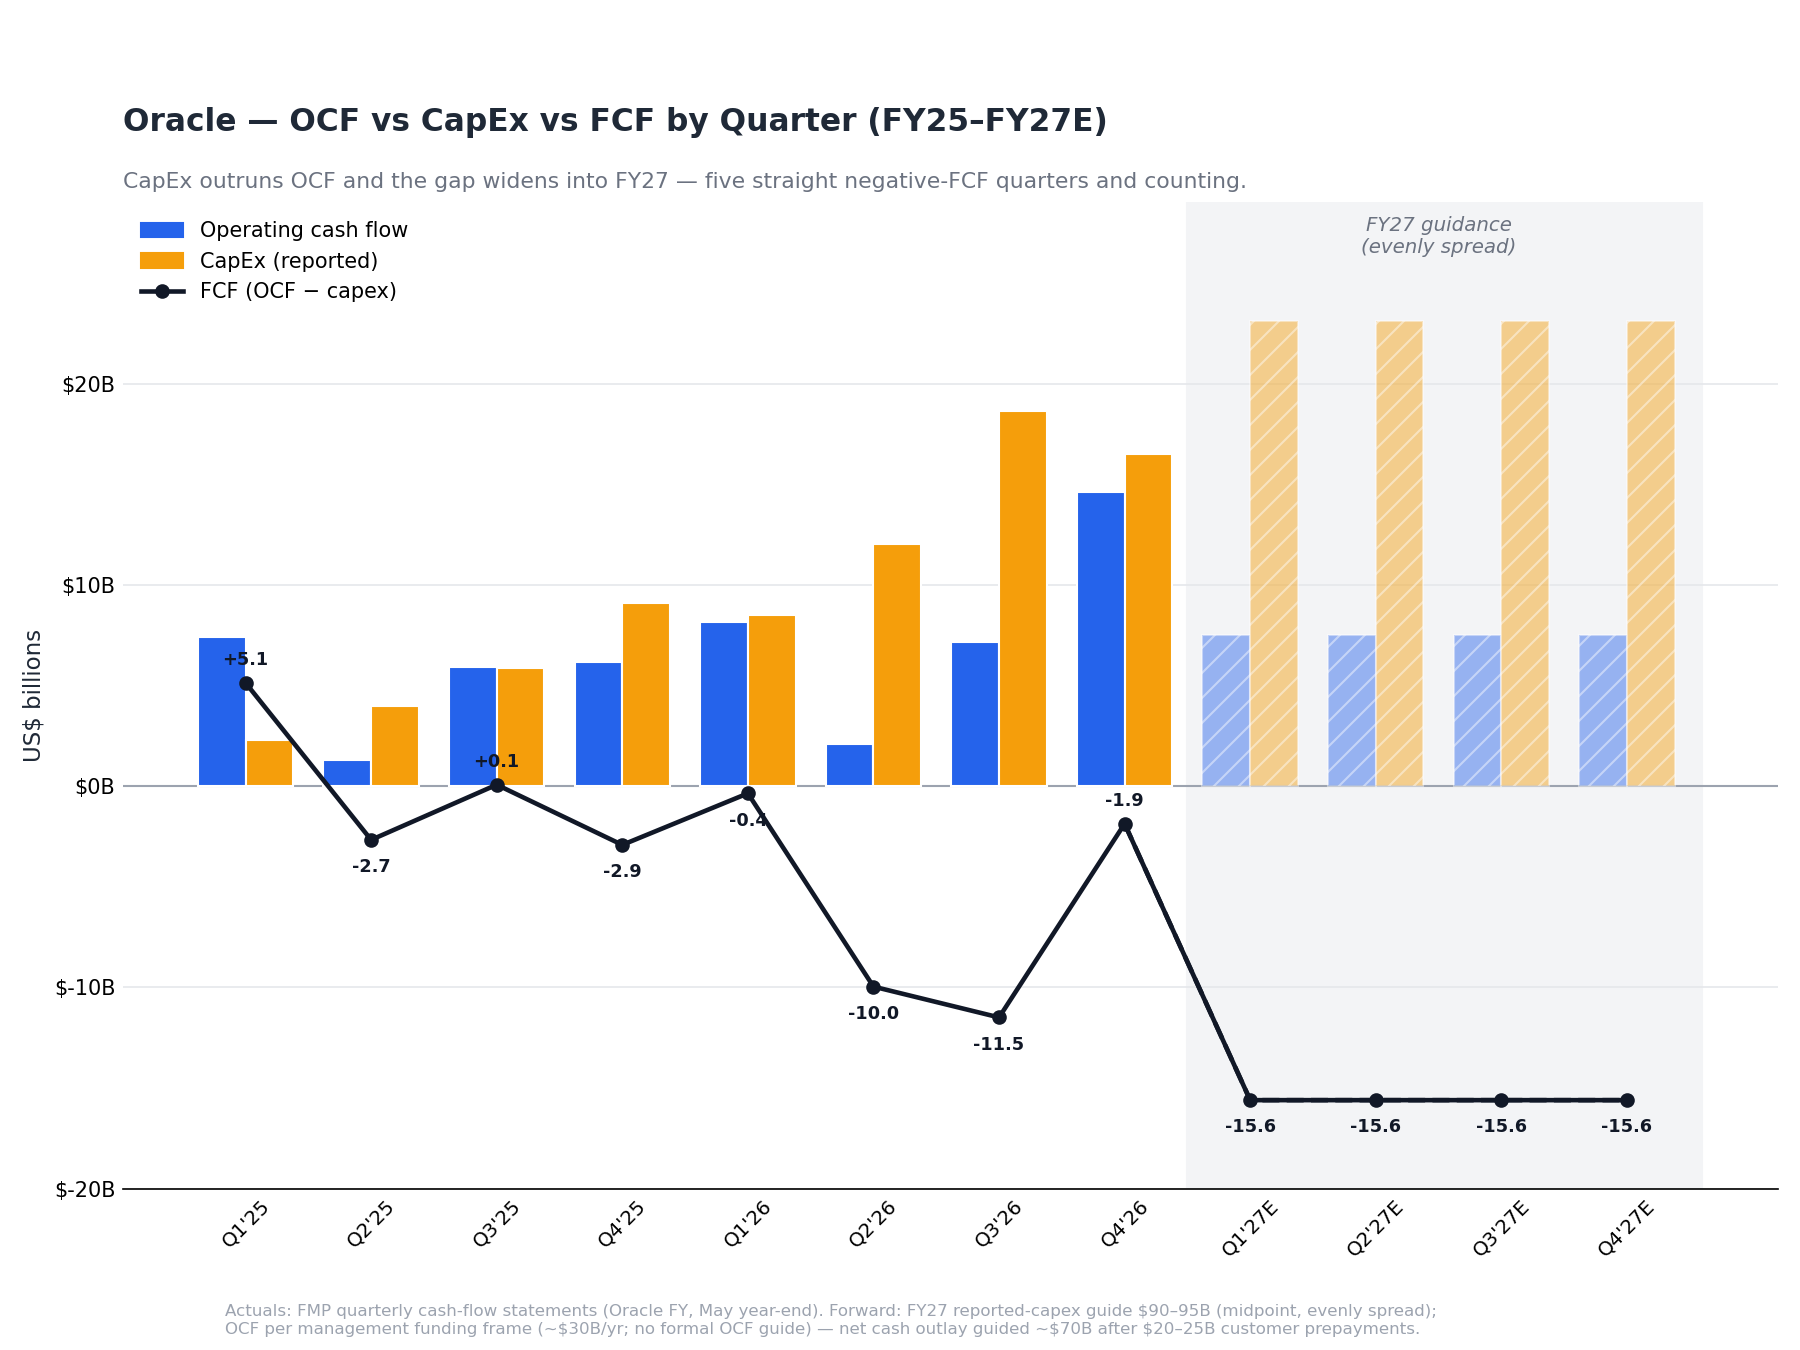
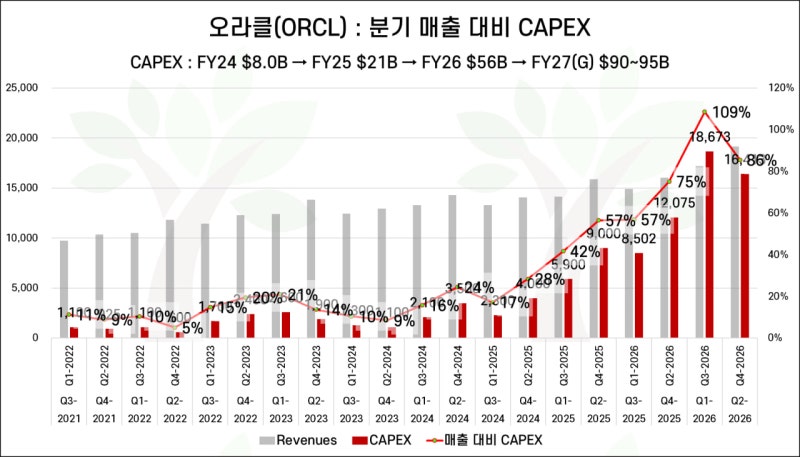
OCF vs reported capex vs FCF, FY25–FY26 actuals + FY27 guidance (capex $90–95B reported / ~$70B net of prepays, evenly spread; OCF per the funding frame ~$30B/yr — no formal OCF guide). The FCF hole persists by design: capex is committed against record RPO.
- FCF reality: TTM FCF −$23.7B (OCF $32.0B vs capex $55.7B); five consecutive negative quarters.
SpaceX — Starlink cash + the biggest IPO ever
The financing arc is a one-year climb down the credit ladder — xAI's junk-financed, off-balance-sheet GPU stack gets folded into SpaceX and refinanced far cheaper as the merged entity's credit re-rates. It's the same cost-of-capital compression that drives the whole neocloud thesis, run at warp speed.
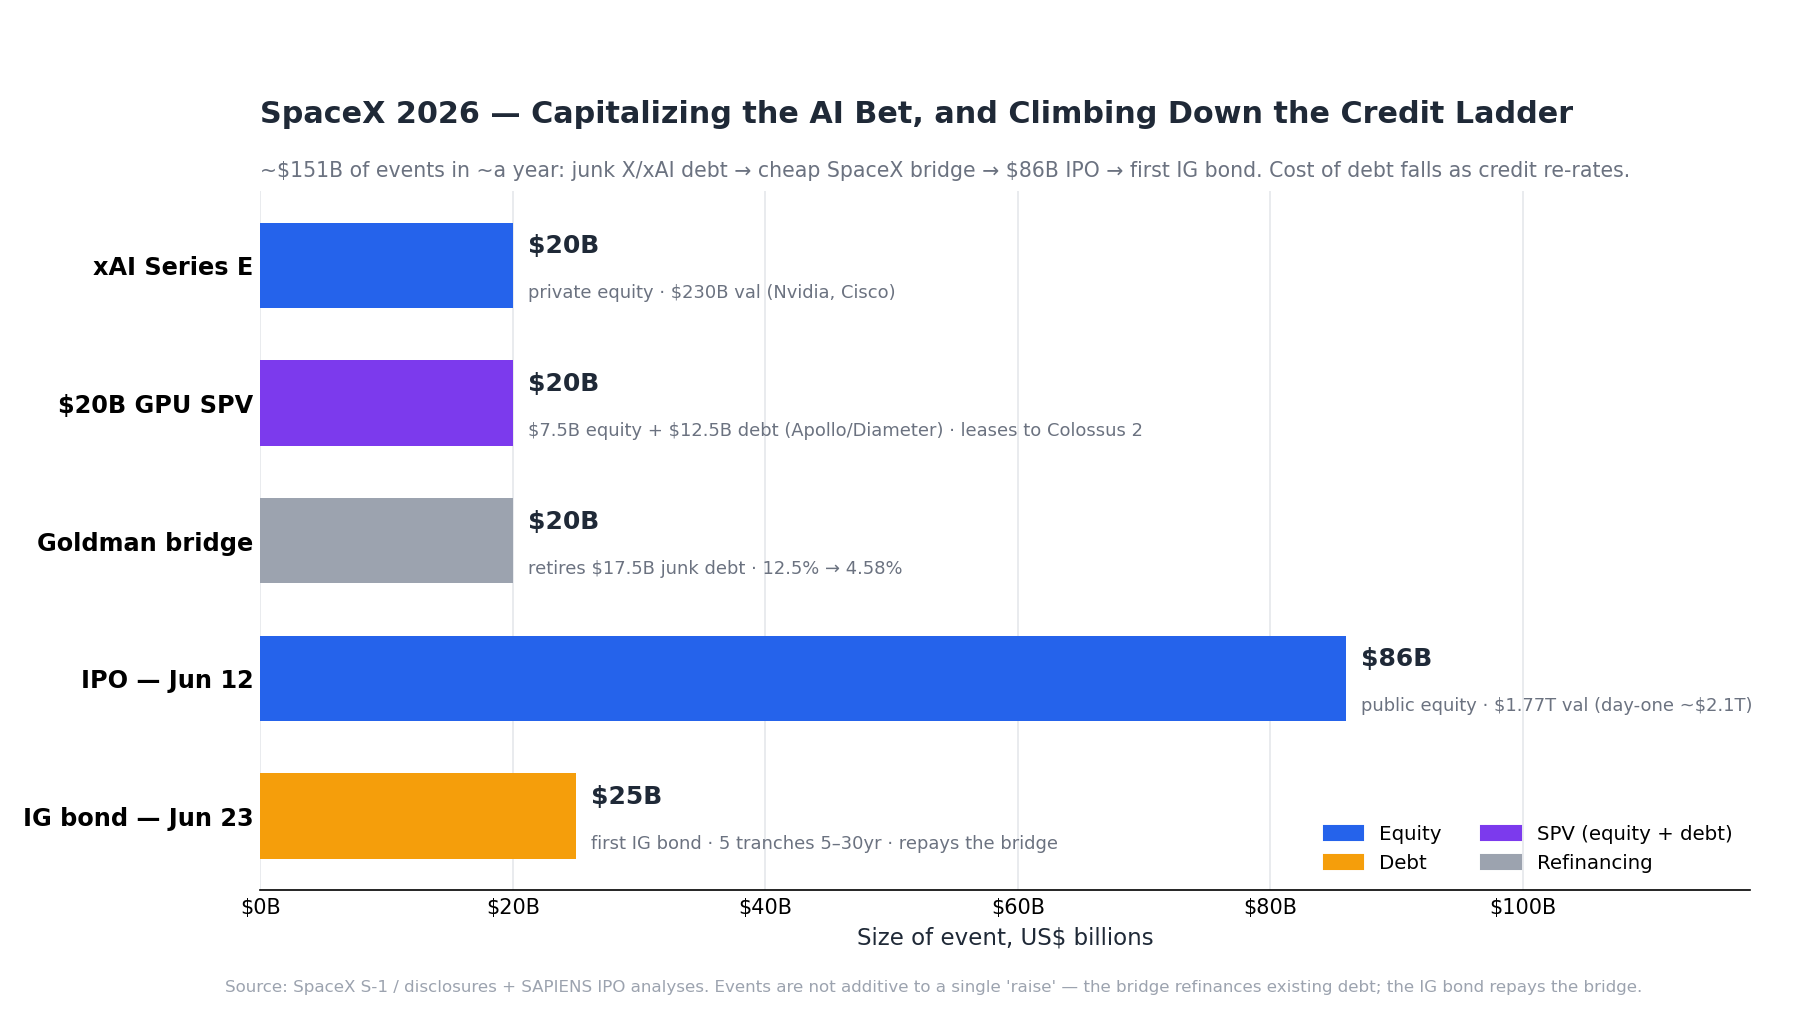
The 2026 capital events by size and type. The bridge refinances junk X/xAI debt at 12.5% down to 4.58%; the $86B IPO dwarfs everything; the $25B IG bond terms out the bridge. Events aren't additive — the bridge refis existing debt, the IG bond repays the bridge.
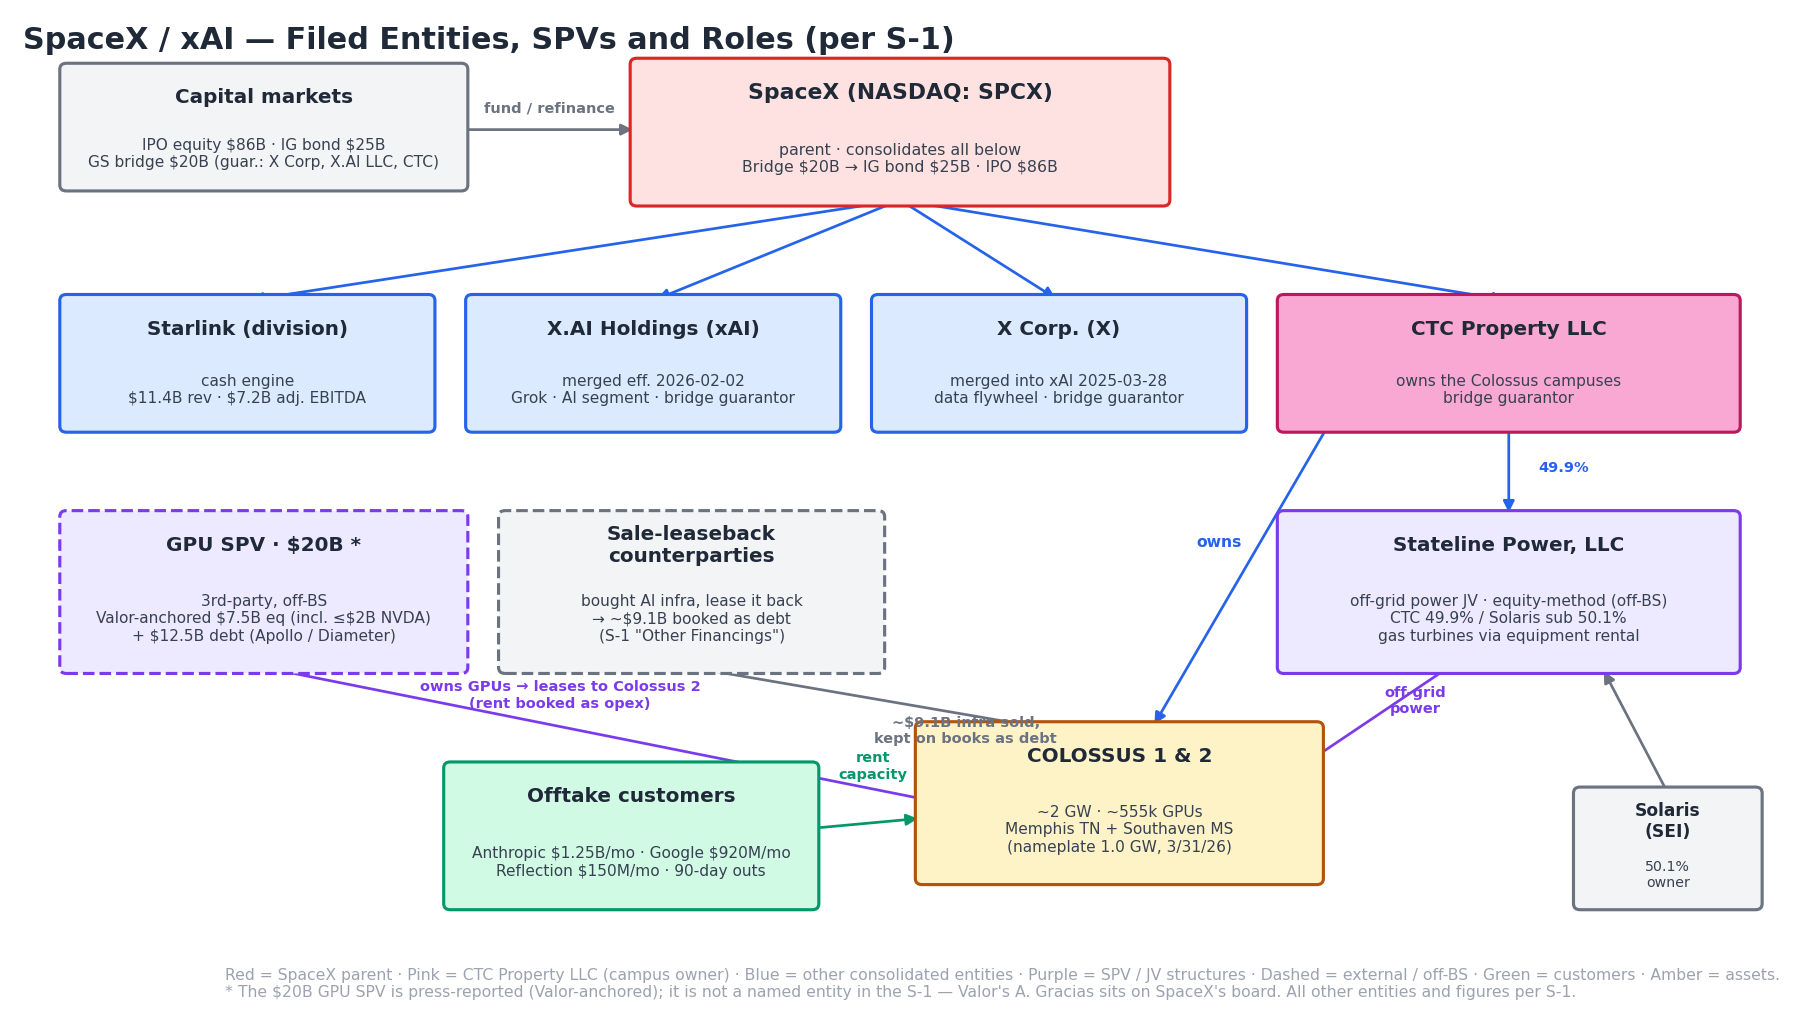
- Filed entity map (S-1). SpaceX consolidates xAI / X / CTC Property LLC — all three guarantee the bridge.
- CTC owns the Colossus campuses and holds 49.9% of the Stateline Power JV (Solaris 50.1%, off-grid gas, equity-method = off-BS).
- Off-balance-sheet: the ~$20B GPU SPV leasing chips into Colossus 2 (rent = opex), and ~$9.1B of failed sale-leasebacks kept on the books as debt.
- Offtakes rent capacity monthly, with 90-day outs.
Pre-merger xAI stack (funds the fleet now being resold):
- $20B GPU SPV (Valor-anchored): $7.5B equity incl. up to $2B Nvidia + $12.5B debt led by Apollo / Diameter — leases chips to Colossus 2, off-balance-sheet, opex-booked.
- A special-purpose vehicle owns the ~$20B of GPUs and leases them to Colossus 2. Because the SPV (not xAI) holds the chips, the debt never lands on xAI's balance sheet and the cost flows through as rent (opex), not capex or debt — the same "match the financing to the asset, keep it off the parent" trick as CoreWeave's DDTL SPVs and Oracle's lessors. This is xAI's version.
- "Fleet now being resold" = these SPV-financed chips are the ~555k-GPU Colossus fleet now rented to Anthropic / Google — the stranded-capacity resale (§5).
- xAI Series E: $20B @ $230B valuation (Nvidia, Cisco among investors) — the last big private equity round before the merger.
SpaceX-level 2026 (post-merger, consolidated):
- $20B Goldman-led bridge retiring $17.5B of 12.5% X/xAI junk debt at an effective 4.58% — halved annual interest to ~$900M.
- A bridge loan is short-term debt to tide over until permanent financing arrives.
- The win is the rate: X/xAI's standalone junk debt cost 12.5%; folded into SpaceX's stronger credit it refinances at ~4.58%, cutting ~$1.3B/yr of interest. This is the merger's immediate financial payoff — SpaceX's balance sheet absorbs and re-prices X/xAI's expensive debt.
- CY 1Q26 balance sheet: ~$30B debt / $16B cash (~4.3x adj. EBITDA) + ~$9B of AI-infrastructure obligations booked as failed sale-leasebacks.
- A failed sale-leaseback: xAI sold GPUs/infra and leased them back, but retained too much control for it to qualify as a true sale, so accounting treats it as a loan — the asset stays on the books and a ~$9B financing liability is recorded. Effectively hidden leverage on top of the $30B.
- IPO Jun 12, 2026: ~$86B raised at $1.77T (day-one ~$2.1T) — the equity leg: deleverages and funds the buildout (on the ~4.5% free float noted above, so it trades thin).
- $25B inaugural IG bond, Jun 23, 2026 (five tranches, 5–30yr) — repays the bridge, funds the AI buildout.
- SpaceX's first-ever investment-grade bond — the permanent, cheap long-term debt the bridge was bridging to.
- Full sequence: junk X/xAI debt (12.5%) → SpaceX bridge (4.58%) → IPO equity → IG bond — three rungs down the credit ladder in a single year.
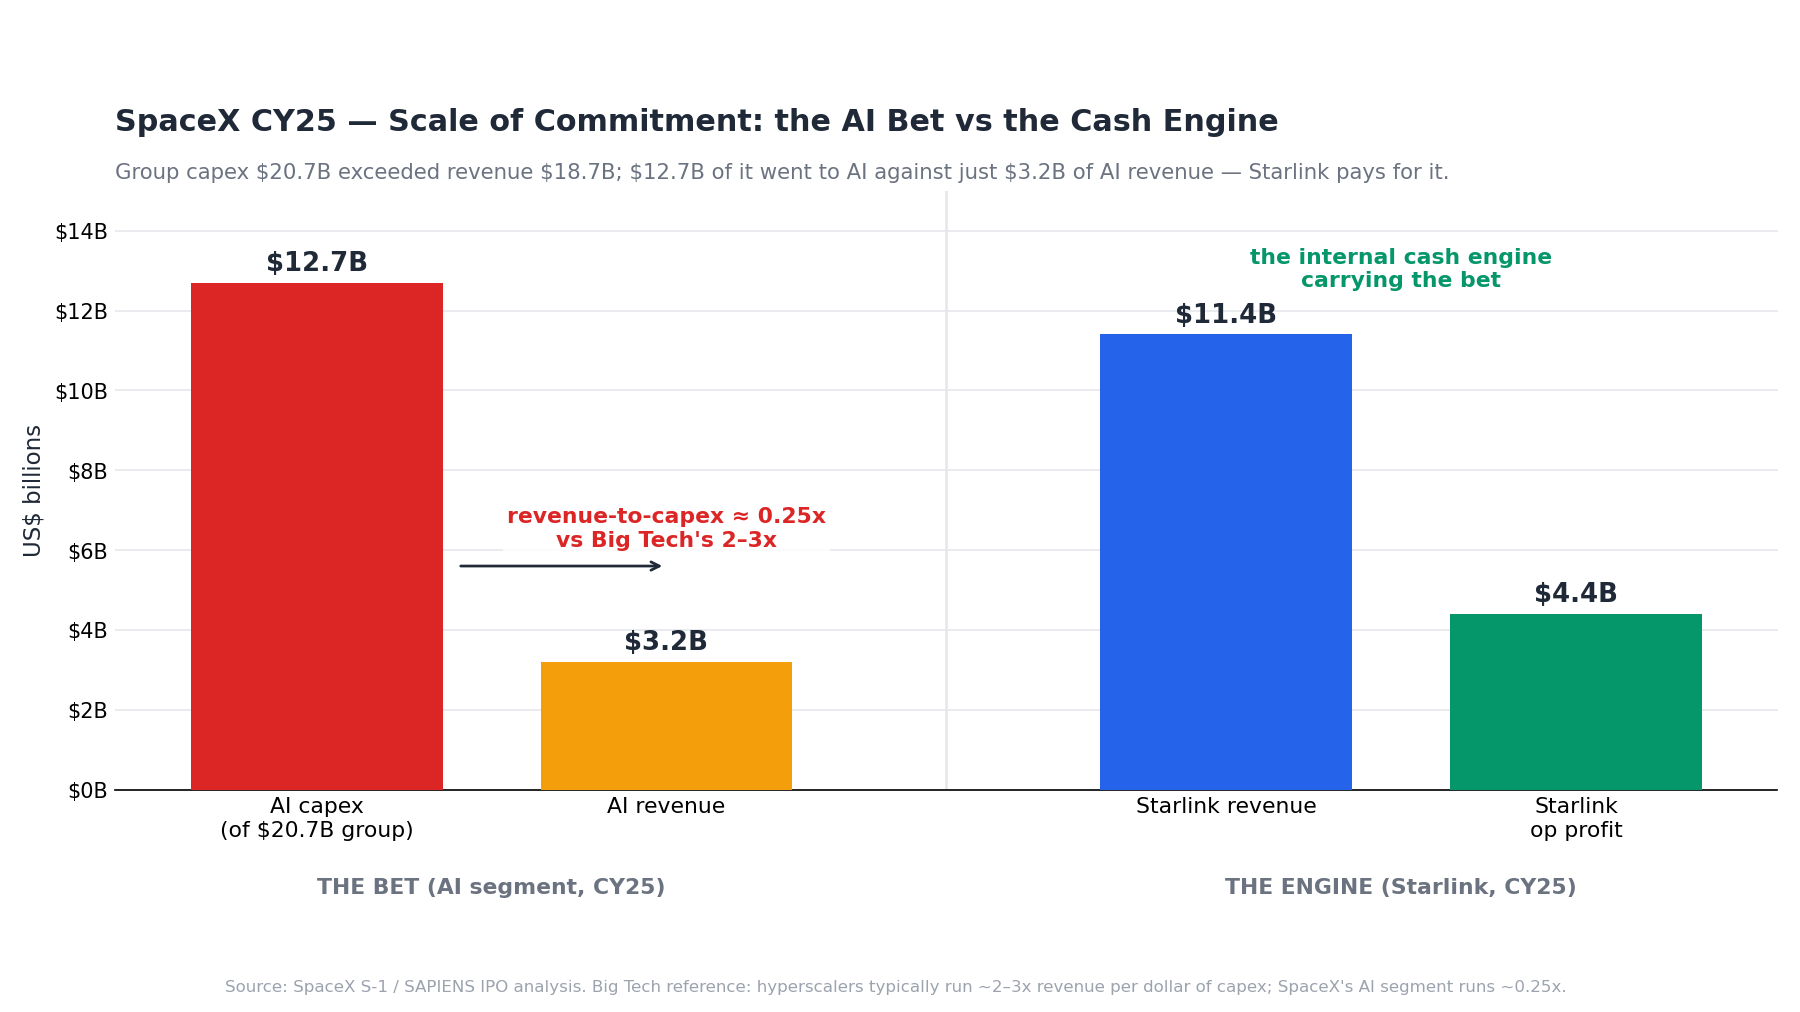
The bet vs the engine, CY25: $12.7B of AI capex against $3.2B of AI revenue (~0.25x, vs hyperscalers' ~2–3x per capex dollar) — funded by Starlink's $11.4B revenue / $4.4B operating profit.
- Scale of commitment: 2025 capex $20.7B, of which $12.7B AI infrastructure — against AI-segment revenue of only ~$3.2B (25% revenue-to-capex vs Big Tech's 2–3x). Starlink ($11.4B revenue, $4.4B operating profit) is the internal cash engine carrying the bet.
- No customer prepayments of note — the offtakes bill monthly. Bankability rests entirely on counterparty quality (high: Anthropic, Alphabet) and the 90-day termination clauses, which cut both ways (§5).
(4) Cross-company comparison
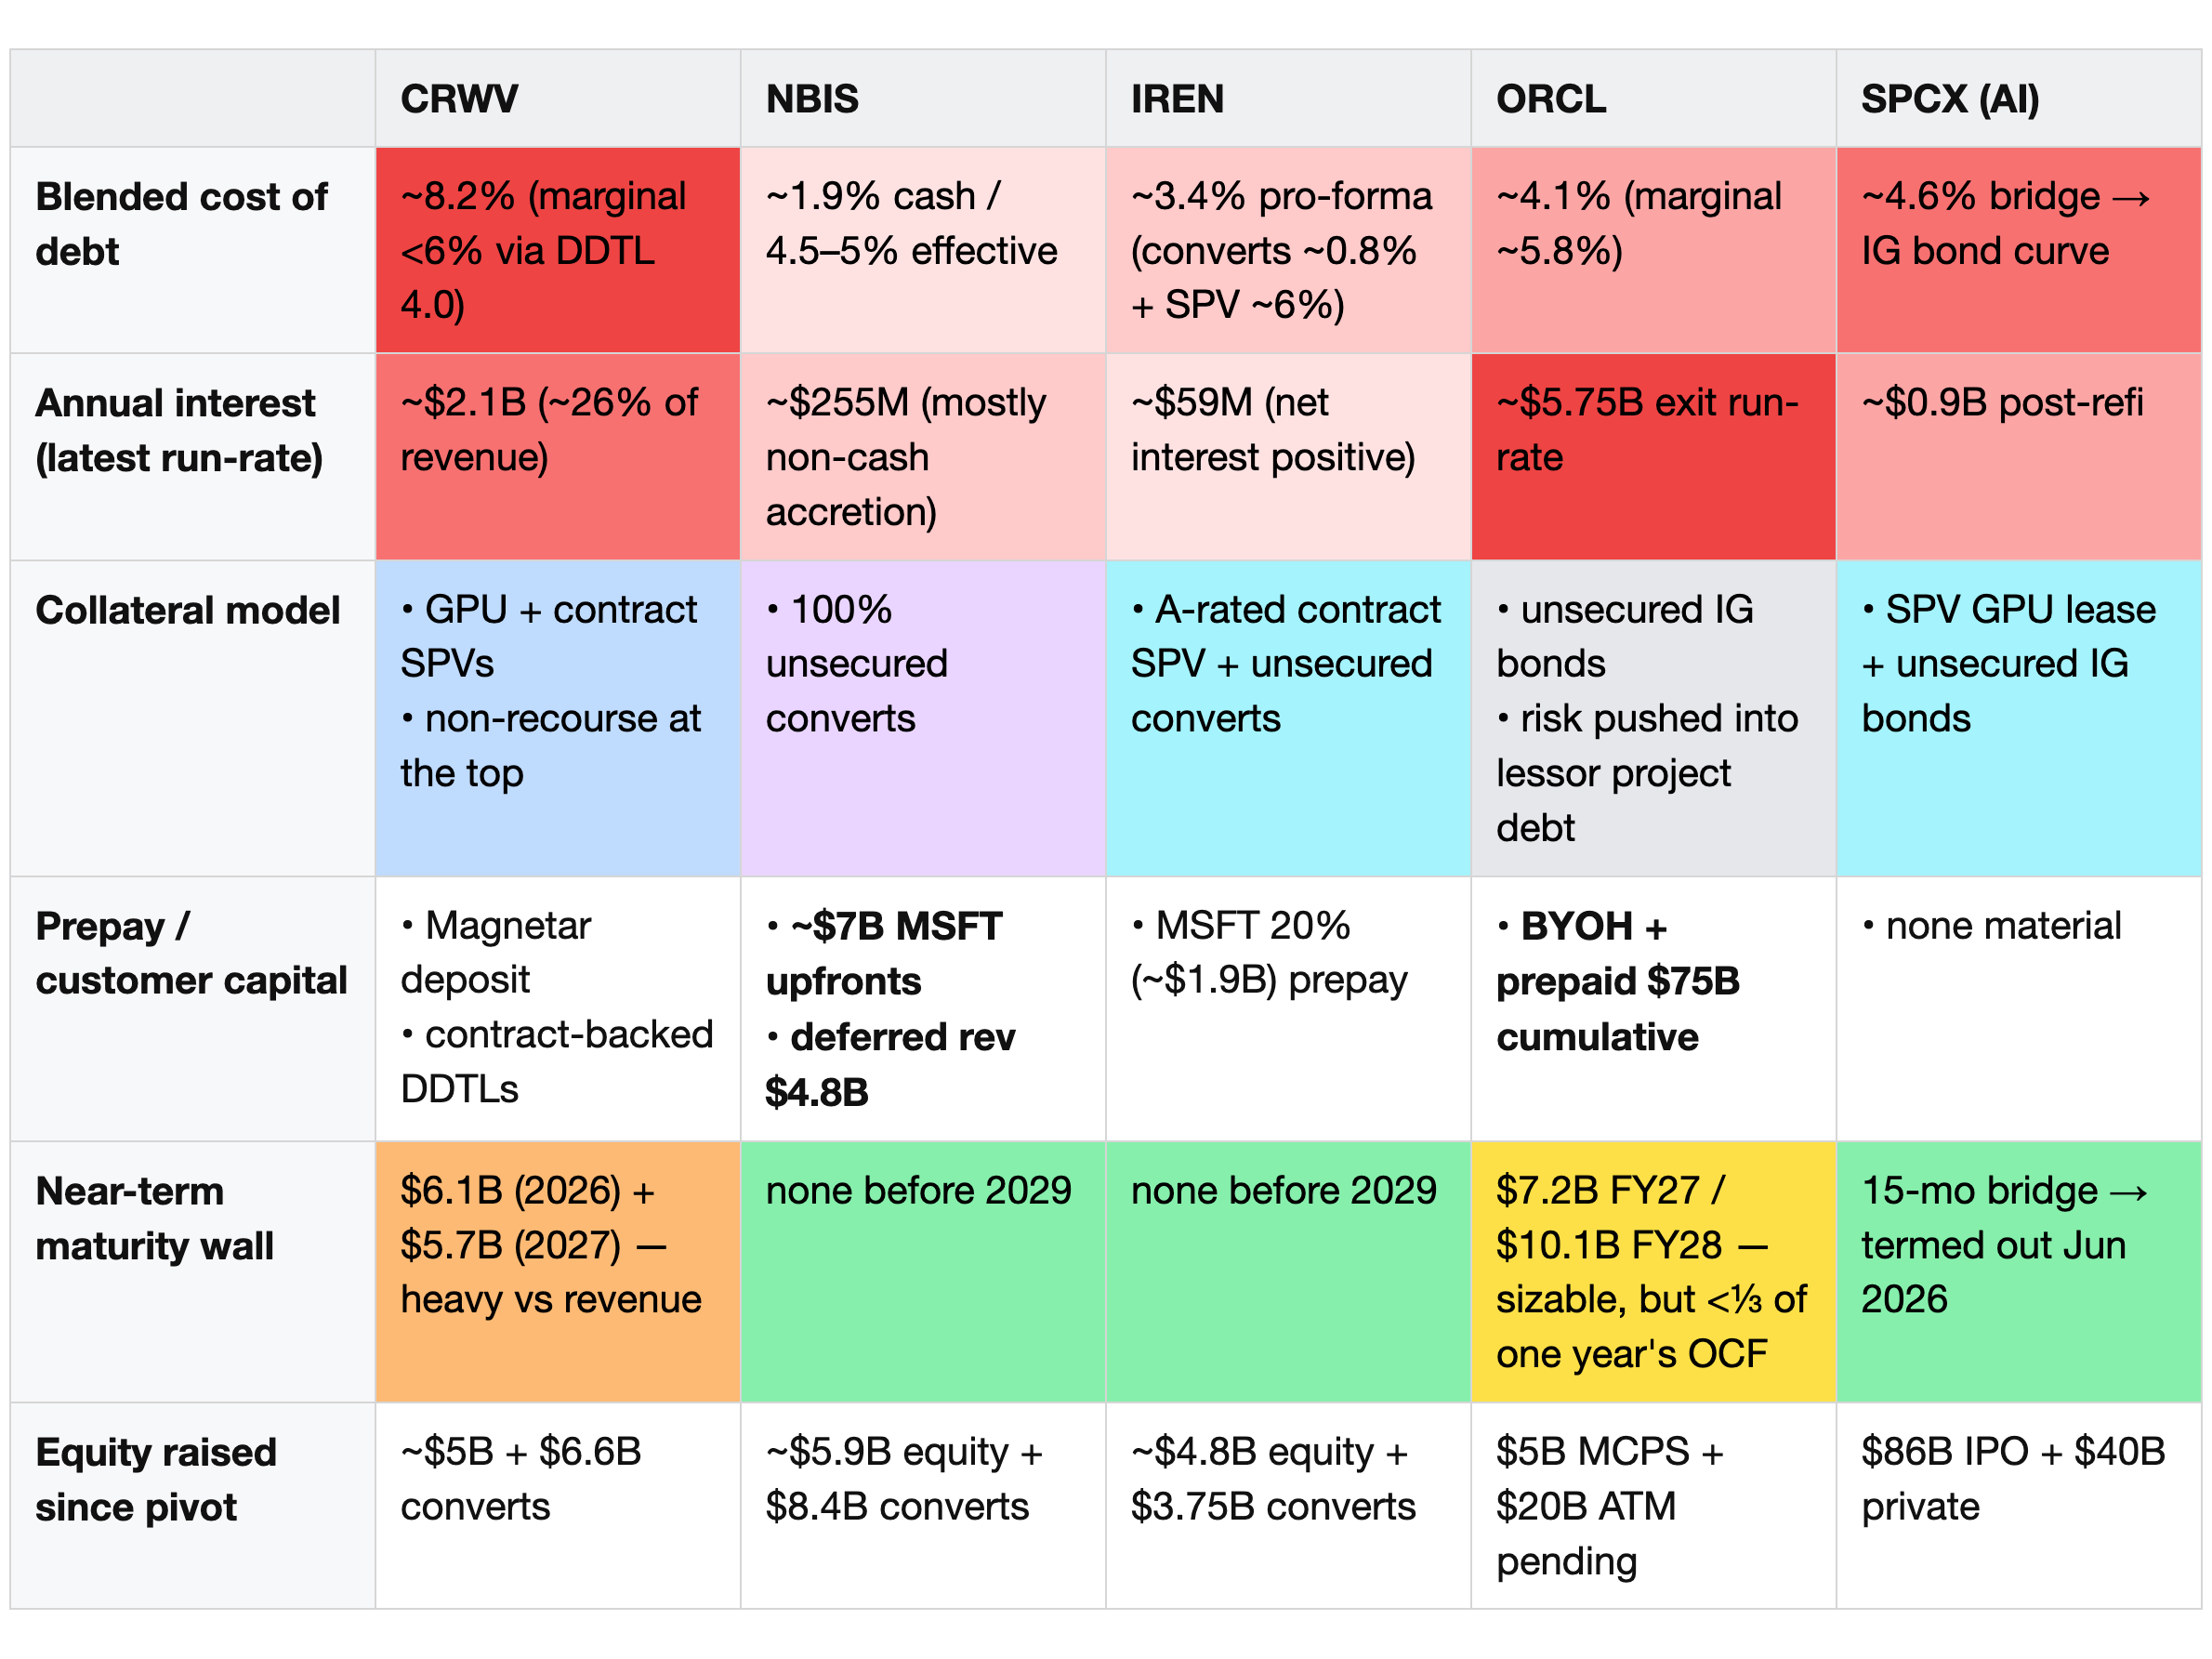
Color key
- *Gradient rows (blended cost of debt, annual interest): single red scale, deeper = heavier burden.*
- *Collateral model (categorical): blue = contract-secured SPV, cyan = hybrid (secured SPV + unsecured layer), purple = fully unsecured, gray = unsecured at the parent with the risk shifted off-BS (Oracle's lessor project debt).*
- *Maturity wall (categorical): orange = heavy near-term vs cash generation, yellow = sizable but comfortably covered, green = clear until 2029+ / termed out.*
The pool's capital stacks converged on one architecture: match the debt to the contract, not the company.
- CRWV's DDTLs, IREN's SPV, Oracle's lessor project bonds, and xAI's GPU SPV are the same instrument at different rungs of the credit ladder.
- Each is a claim on a named customer's take-or-pay cash flows, secured by the GPUs serving that contract.
The cost-of-capital hierarchy (hyperscaler 4–5% vs neocloud 8–10%+) is compressing exactly as contracts season.
- CRWV went from 15% to sub-6% in 32 months; IREN debuted at A-rated ~6%.
- That compression is the ROIC−WACC spread widening from the WACC side ⎯ the bull case thesis of Neoclouds.
(5) GPU depreciation — who assumes what
The hyperscaler baseline — the sector norm the neoclouds' schedules are judged against (server & network equipment lives; GPUs sit inside these pools):
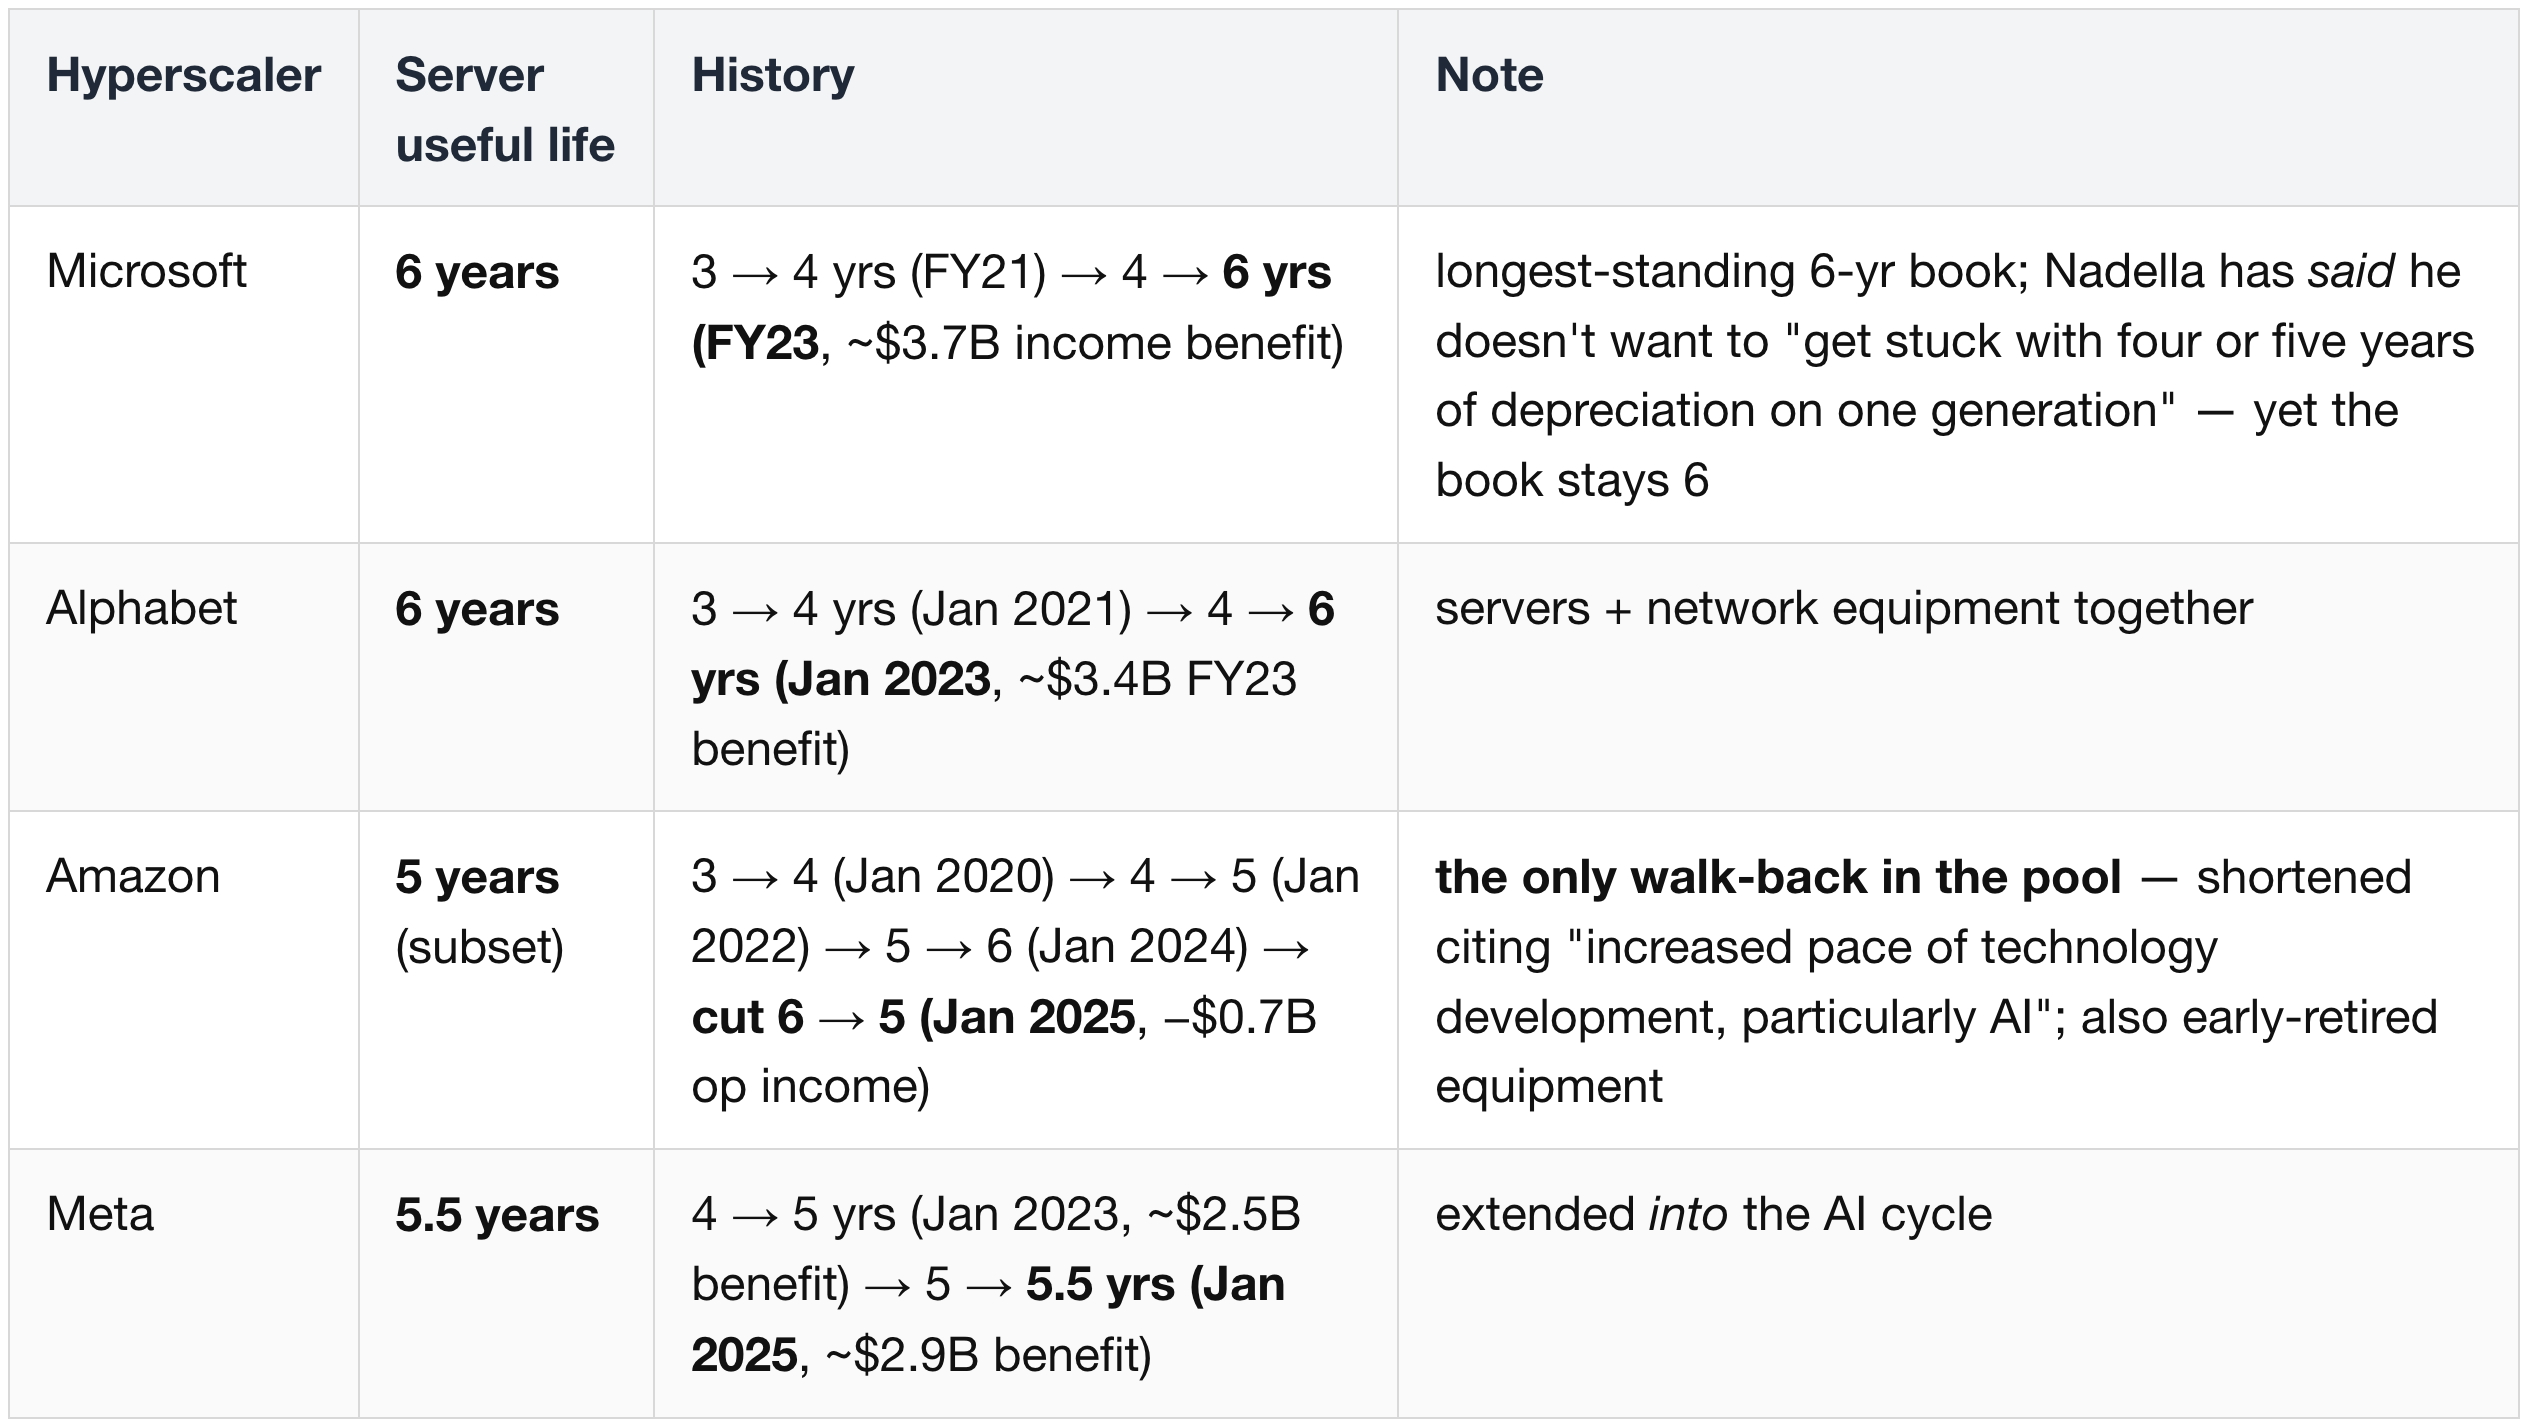
- The pattern: a decade of near-uniform extensions (each worth billions of non-cash earnings), with Amazon as the lone reversal — cutting to 5 years in Jan 2025 because of AI's replacement pace, the direction every bear says the whole sector should move.
- The bear quantification: Michael Burry's Nov 2025 estimate — hyperscalers + Oracle collectively understating depreciation by ~$176B over 2026–28 via extended lives.
- Read against the neocloud table below: CoreWeave and Oracle sit at the top of the hyperscaler range (6 yrs) on fleets that are far more GPU-concentrated than any hyperscaler's blended server pool.
The neoclouds:
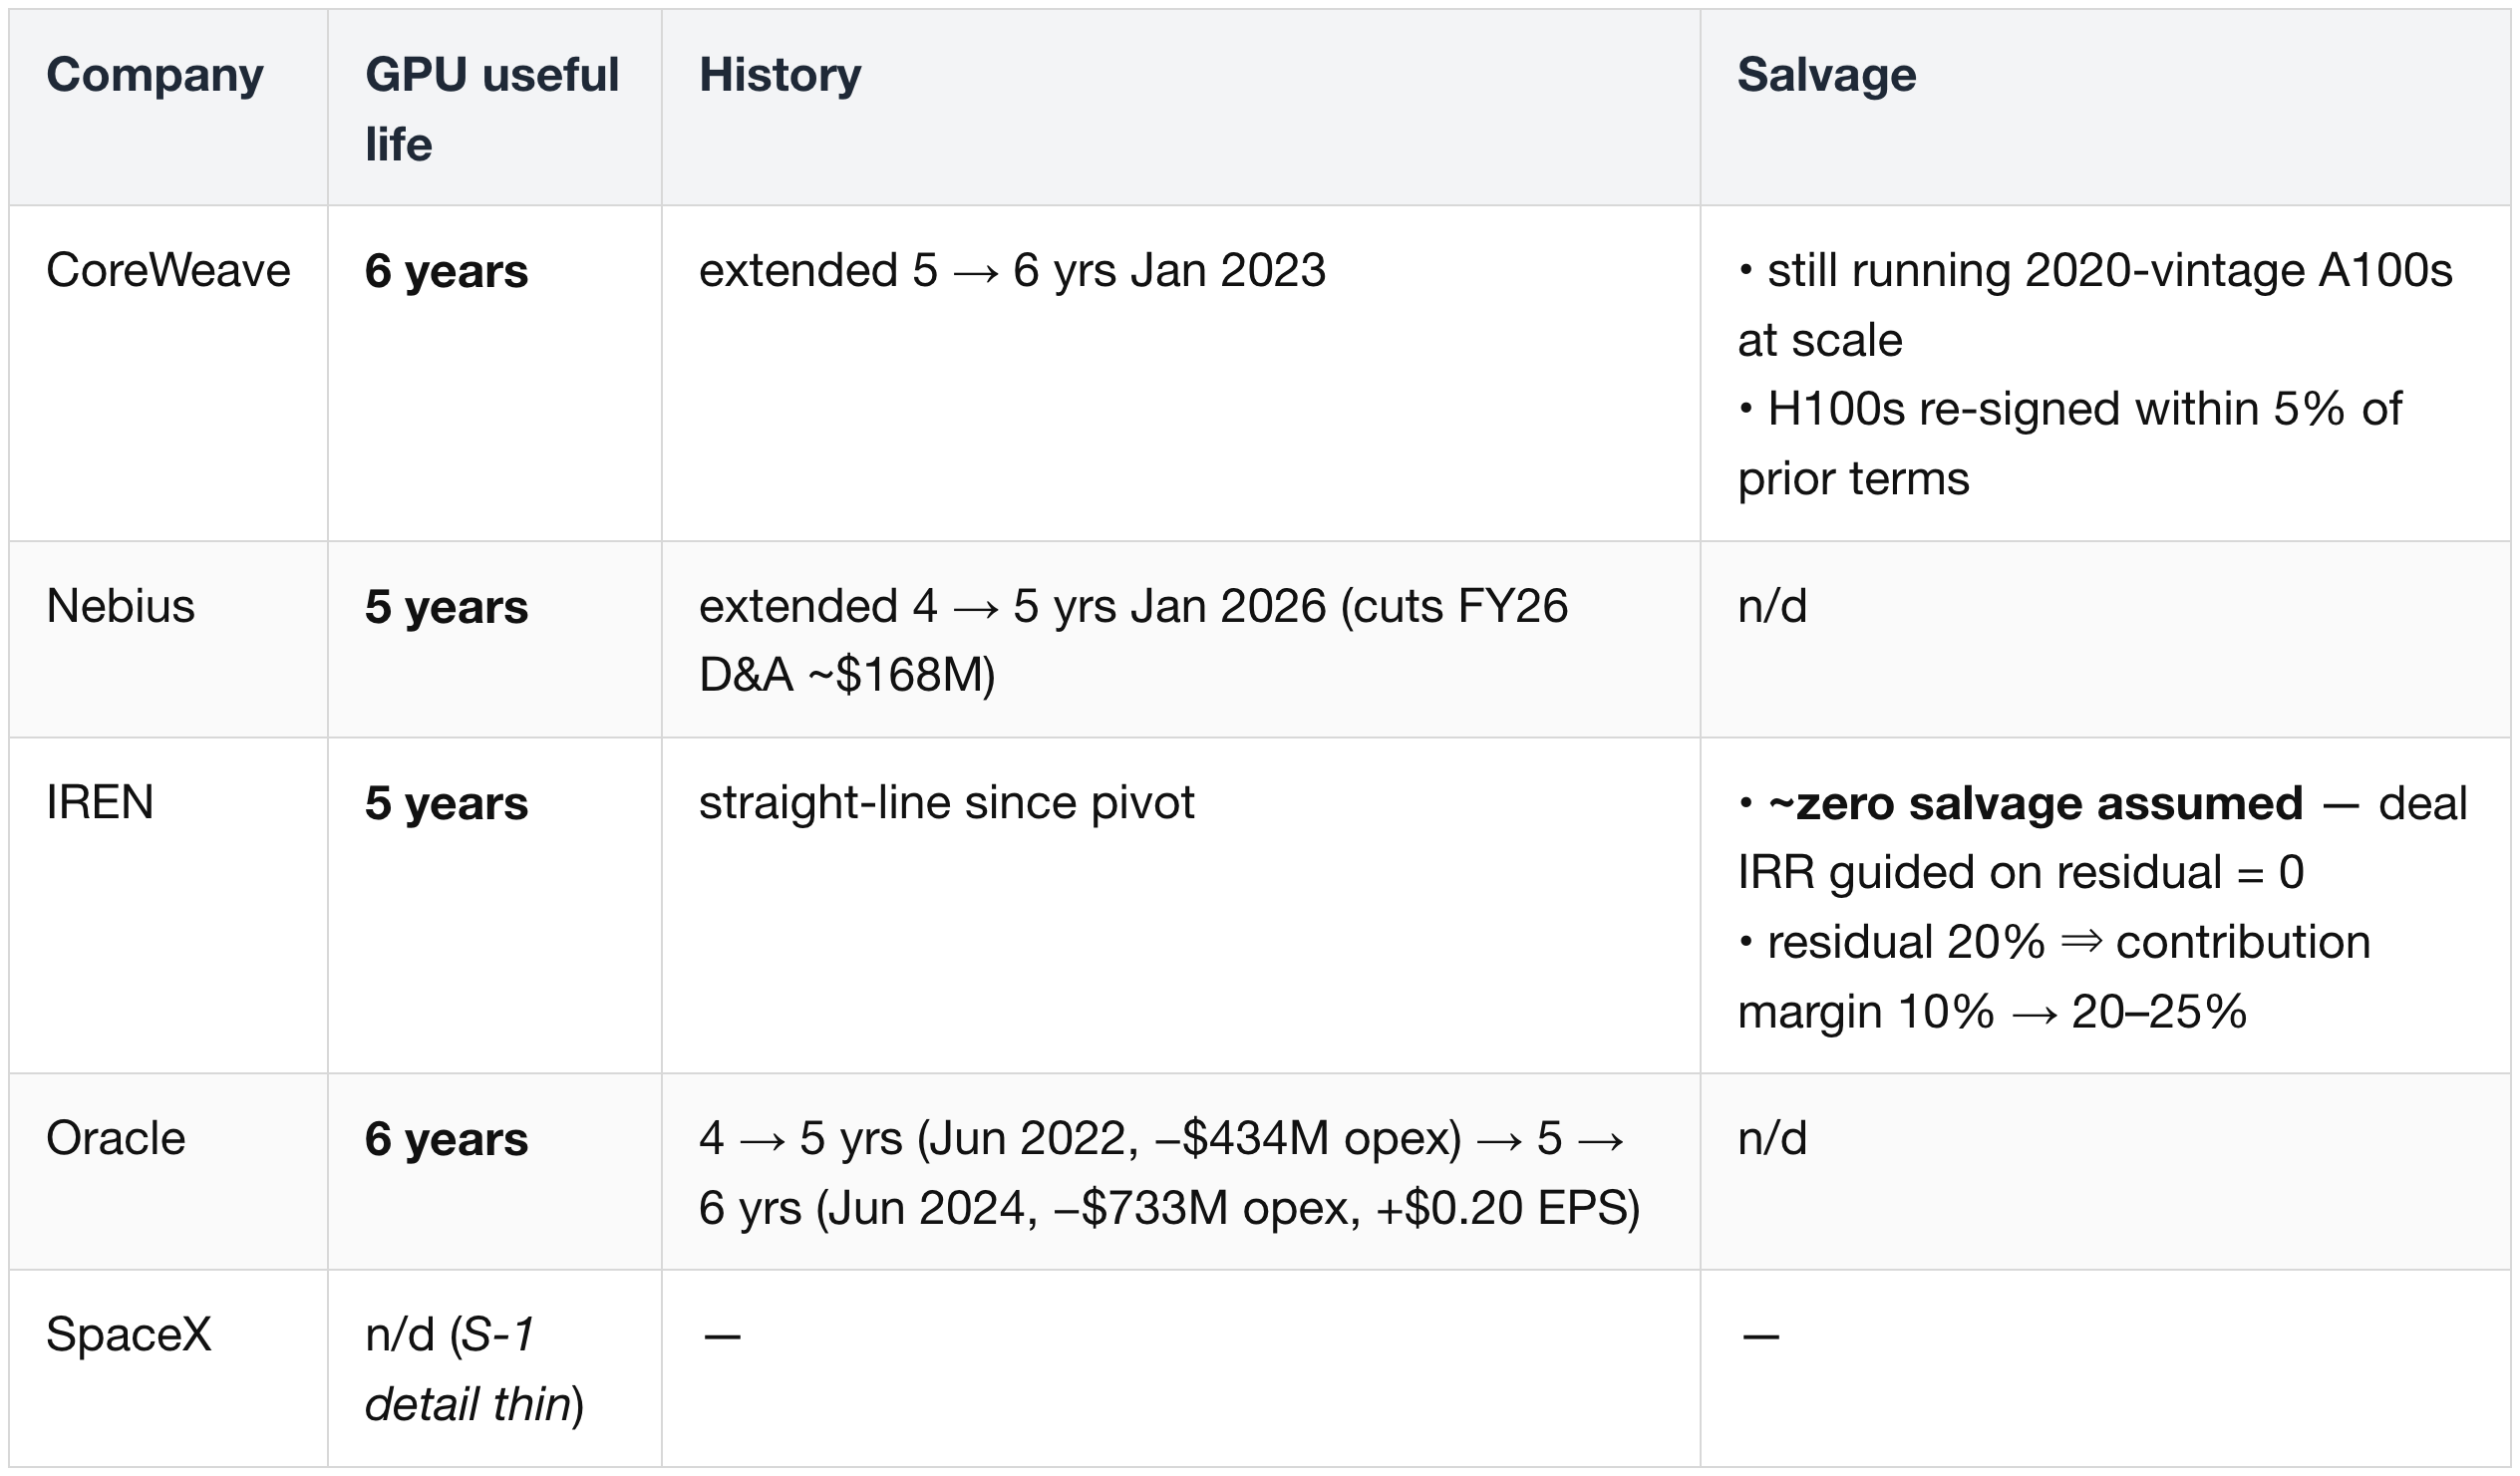
- Two consequences:
- ROICs are not comparable off the shelf. A 5-yr zero-salvage book (IREN) reports structurally lower margins than a 6-yr book (CRWV, ORCL) on identical hardware and identical contracts.
- Every extension (ORCL twice, NBIS once) front-loads reported earnings while the physical fleet ages. The market's suspicion of "depreciation games" is legitimate — the H100 rental rebound below is currently the only hard evidence arbitrating it.
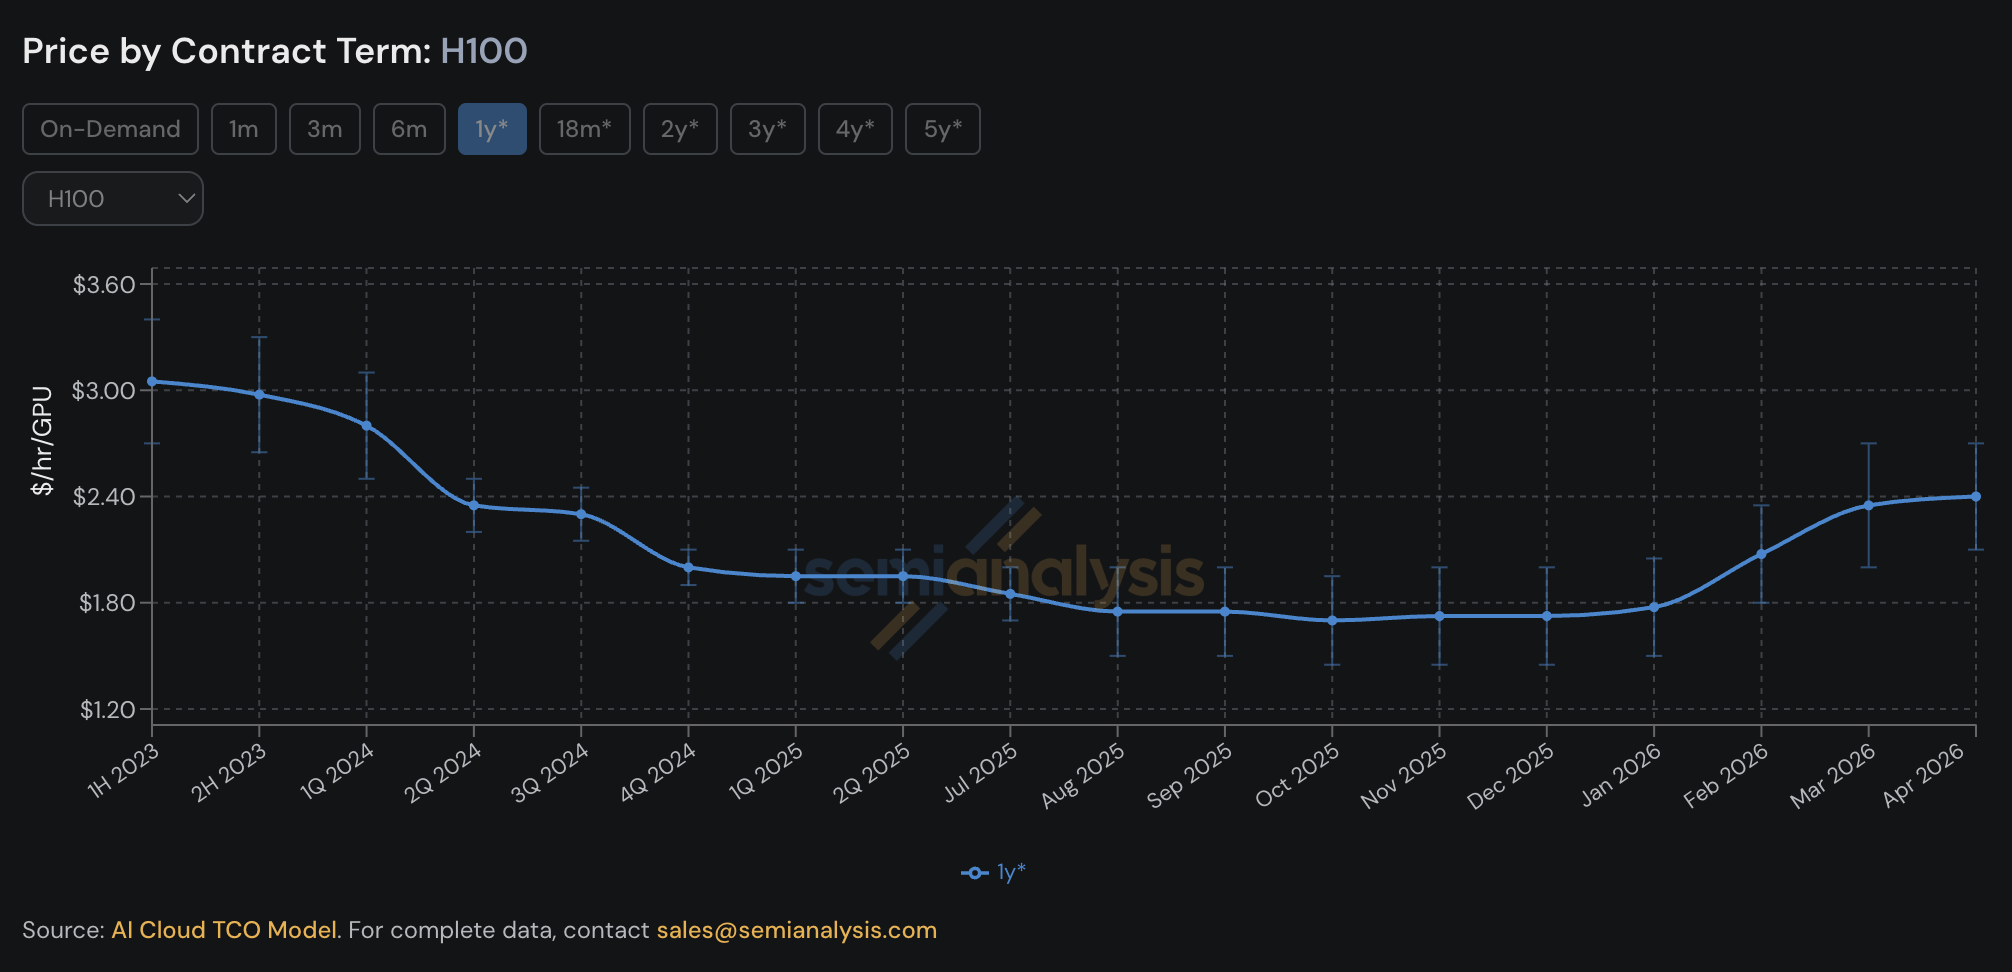
- H100 1-yr contract pricing: ~$3.05/hr (1H CY23) → trough ~$1.70 (Oct 2025) → ~$2.35 and rising (Mar 2026, +~40% off the trough).
- Inference demand is defending old-gen pricing and utilization — AWS's Jassy: A100 servers sold out, never discontinued a chip.
- Rising old-gen rents stretch the runway N; they do not make the spread perpetual.
(6) Valuation
The bull case — "the spread is real and persistent."
- The entire bull vs bear question: is there a durable spread between return on capital (ROIC) and cost of capital (WACC), and is it widening or compressing?
- What sustains the spread:
- Product / operating excellence — a better cloud commands premium pricing, widening the spread directly.
- The operating team — supplier relationships (Nvidia, OEMs) plus a delivery track record; customers pay for the certainty that scarce silicon becomes delivered, on-time compute.
- Allocation scarcity — in a shortage, Nvidia allocation is itself the scarce good; you pay the neocloud to get in line.
- Performance surplus — each Nvidia generation improves ~an order of magnitude but can't be priced that way (antitrust, customer revolt), so surplus passes downstream; the first-in-line neocloud captures the largest slice.
- Growth is intrinsic value — with IRR above WACC and demand effectively infinite, every deployed dollar is a positive-NPV project; the business is gated by capital and build speed, not by demand. This is why a neocloud can look "ridiculous" on P/B or P/E and still be cheap.
- The circumstances under which it works — the bull case is conditional, not structural:
- The spread is not perpetual: hyperscaler self-build, competing neoclouds, and a normalizing capex cycle push ROIC → WACC.
- The realistic model is two-stage — a wide spread over a finite runway of N years, then ROIC = WACC (new deployment adds book but no value).
- So the whole debate reduces to two questions:
- (1) can it sustain the spread (product + relationship moats vs the bear case that it's a shortage artifact), and
- (2) can it keep deploying (capital access + construction speed).
- Current evidence stretches N: H100 rents rising three years post-launch means near-zero economic depreciation and positive residual value — but that is a shortage artifact; it lengthens the runway, it does not make the spread perpetual.
- Valuation follows directly: not forward multiples, not book — EV = deployed capital + the capitalized spread on it + the PV of the spread on each future capital tranche.
NBIS vs CRWV — the numbers
(EV basis: CY 2Q26 / Mar 31 balance sheet rolled to YE-2026; ARR = exit-2026 run rate):
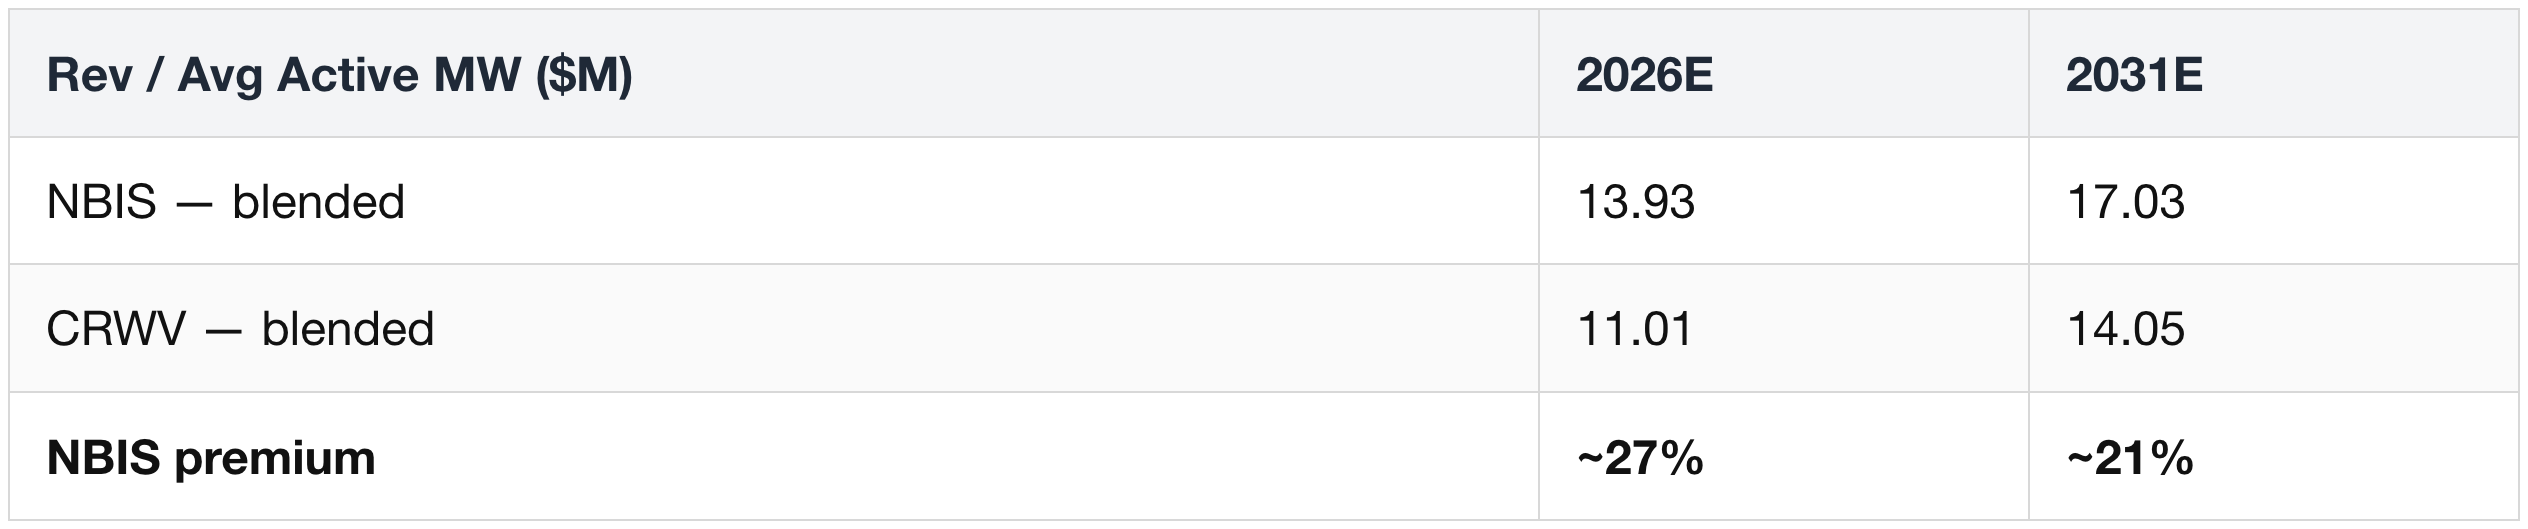
The Rev/MW premium (~27%) holds on committed-only contracts too ($13.06M vs $11.03M) — not a spot-pricing artifact; it reflects Nebius's product/engineering bet (value on top of raw rental, a technology moat for when the shortage eases).

The on-demand mix is why NBIS is the higher-beta name: ~half its base reprices with GPU market dynamics (its short-term Rev/MW $15.03M runs above its own committed $13.06M), so a shortage lifts margins — and a glut cuts them.
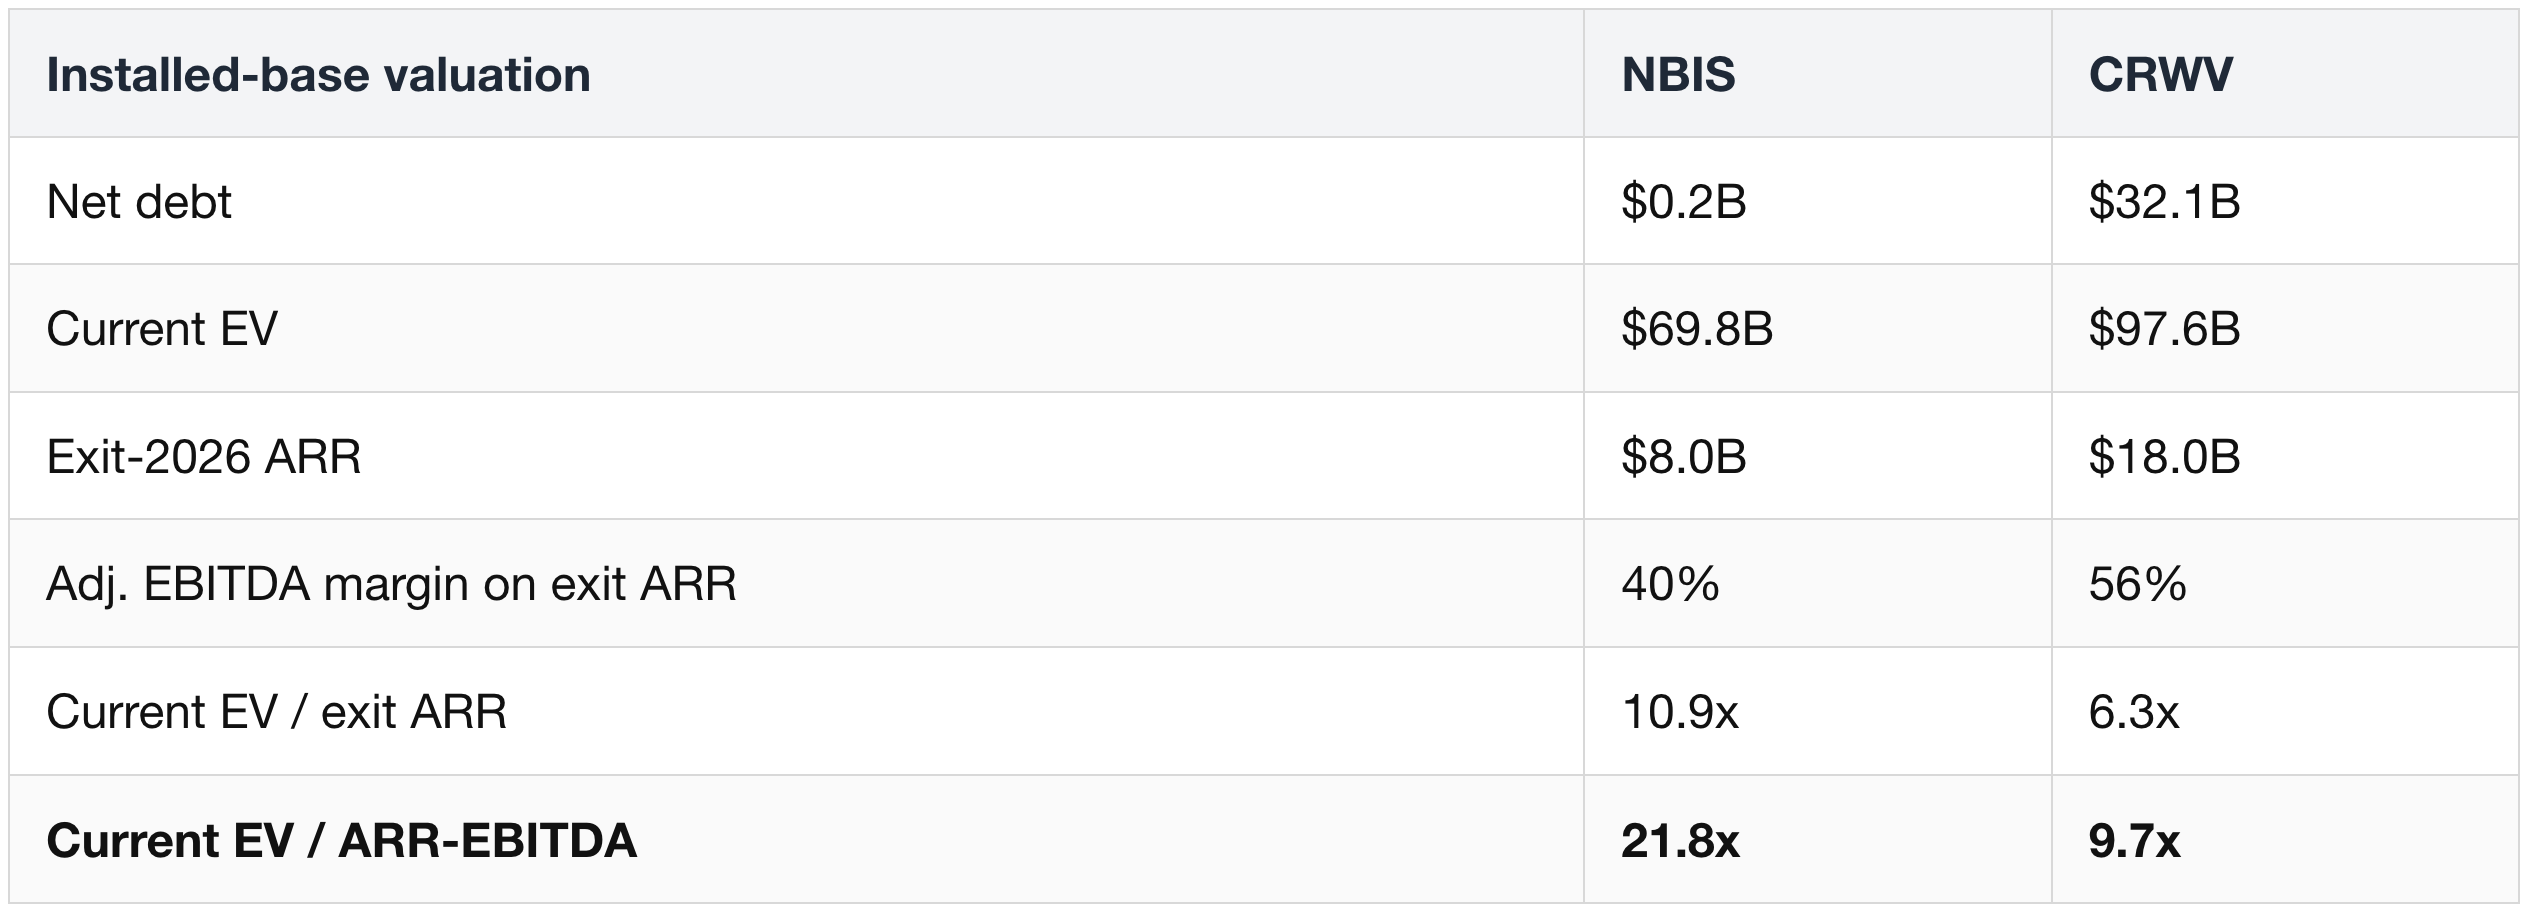
What each is valued for:
- CRWV = paying for assets you can see
- its EV is supported by the installed, contracted base (the deployed-capital spread term).
- More debt, but the lower-beta version of the bet: no flawless-execution assumption is required.
- NBIS = paying for deals not yet done
- far less debt but ~2.5x the EV/EBITDA on its installed base;
- the premium is the growth term, capital not yet deployed. You're underwriting execution.
- The trade-off in one line: balance-sheet risk you can underwrite (CRWV) vs execution risk you can't (NBIS).
The template for valuing any other neocloud — three questions, in order:
- Which value term is the price sitting on?
- Split EV into deployed-capital spread vs undeployed-growth term.
- The more of the price that rests on capital not yet deployed, the more execution you're underwriting (IREN prices in undeployed capital like NBIS; ORCL is the levered index of the whole trade).
- What's the Rev/MW, and why?
- Revenue per megawatt is the quality line — chip generation priority (VR200 vs Blackwell ≈ ~20% premium), product layer, and contract mix all show up here before they show up in margins.
- How long is runway N vs the depreciation life?
- The spread's PV hangs on N;
- old-gen rental prices are the live arbiter (rising = N stretching, rolling over = every book in the pool is over-lived at once).
3. The Compute Deal Ledger
The contracts are the industry's true balance sheet — they are what converts GPUs from speculative inventory into financeable infrastructure.
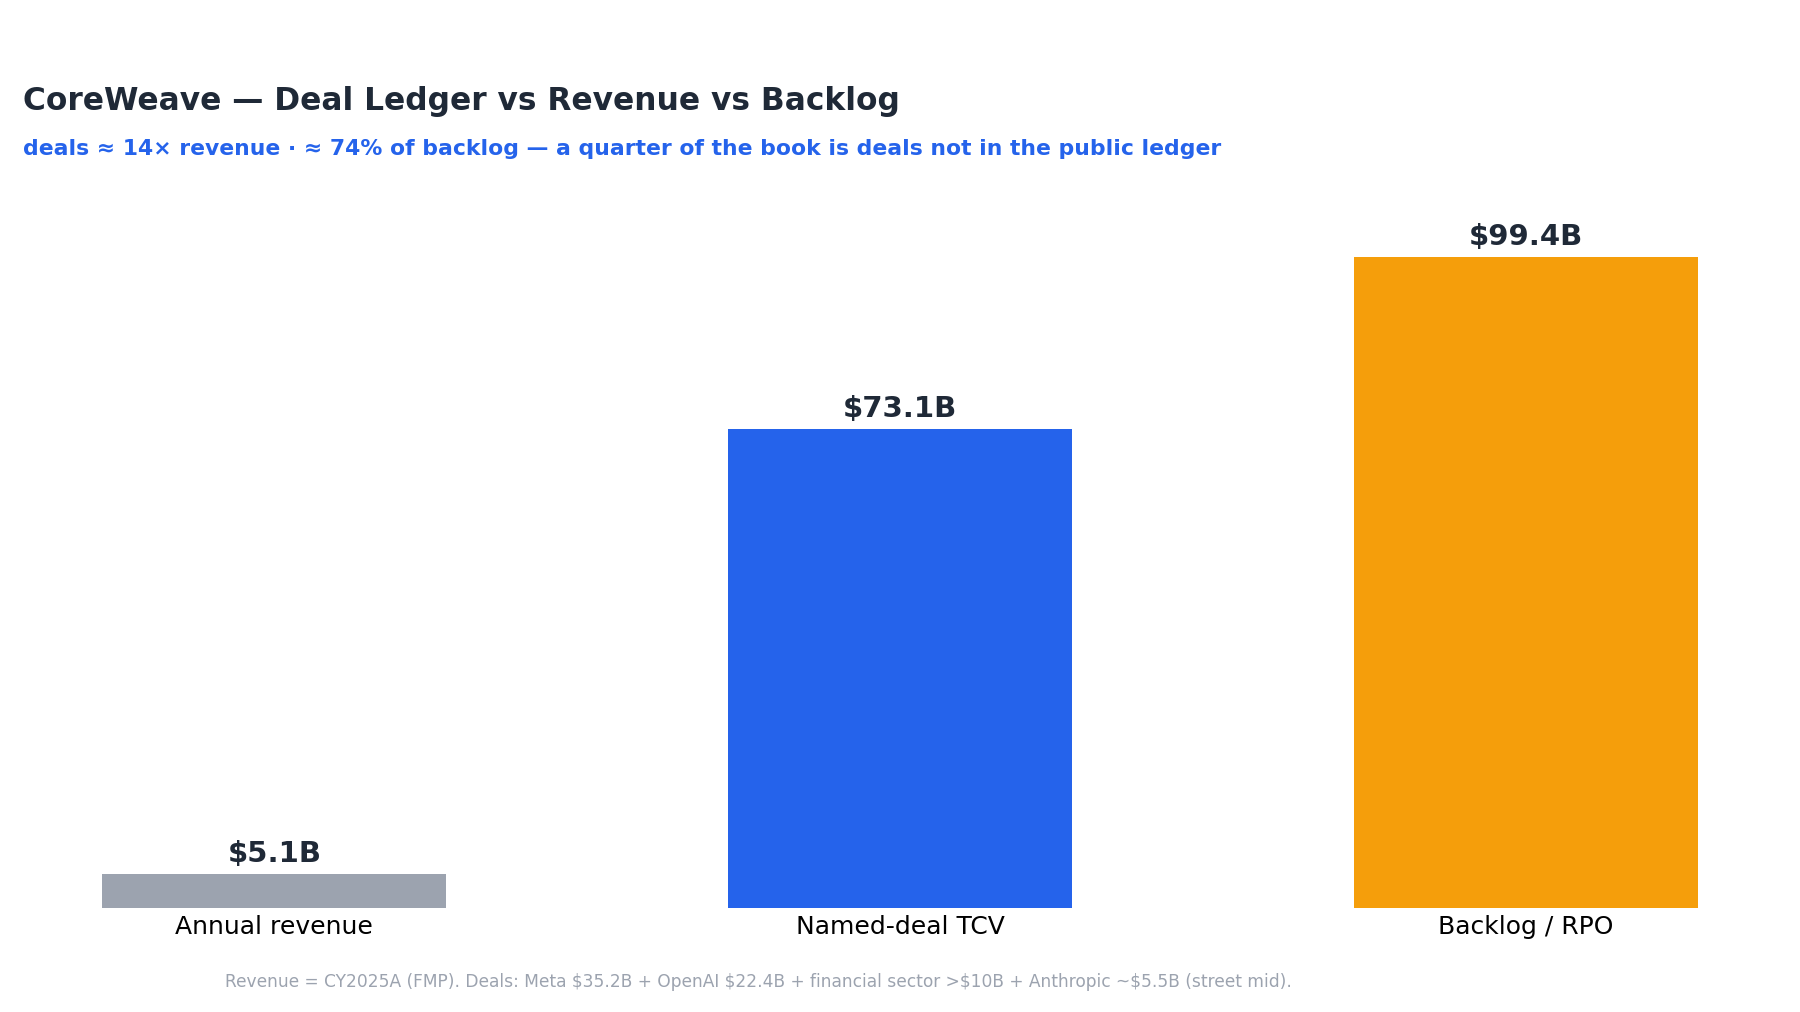
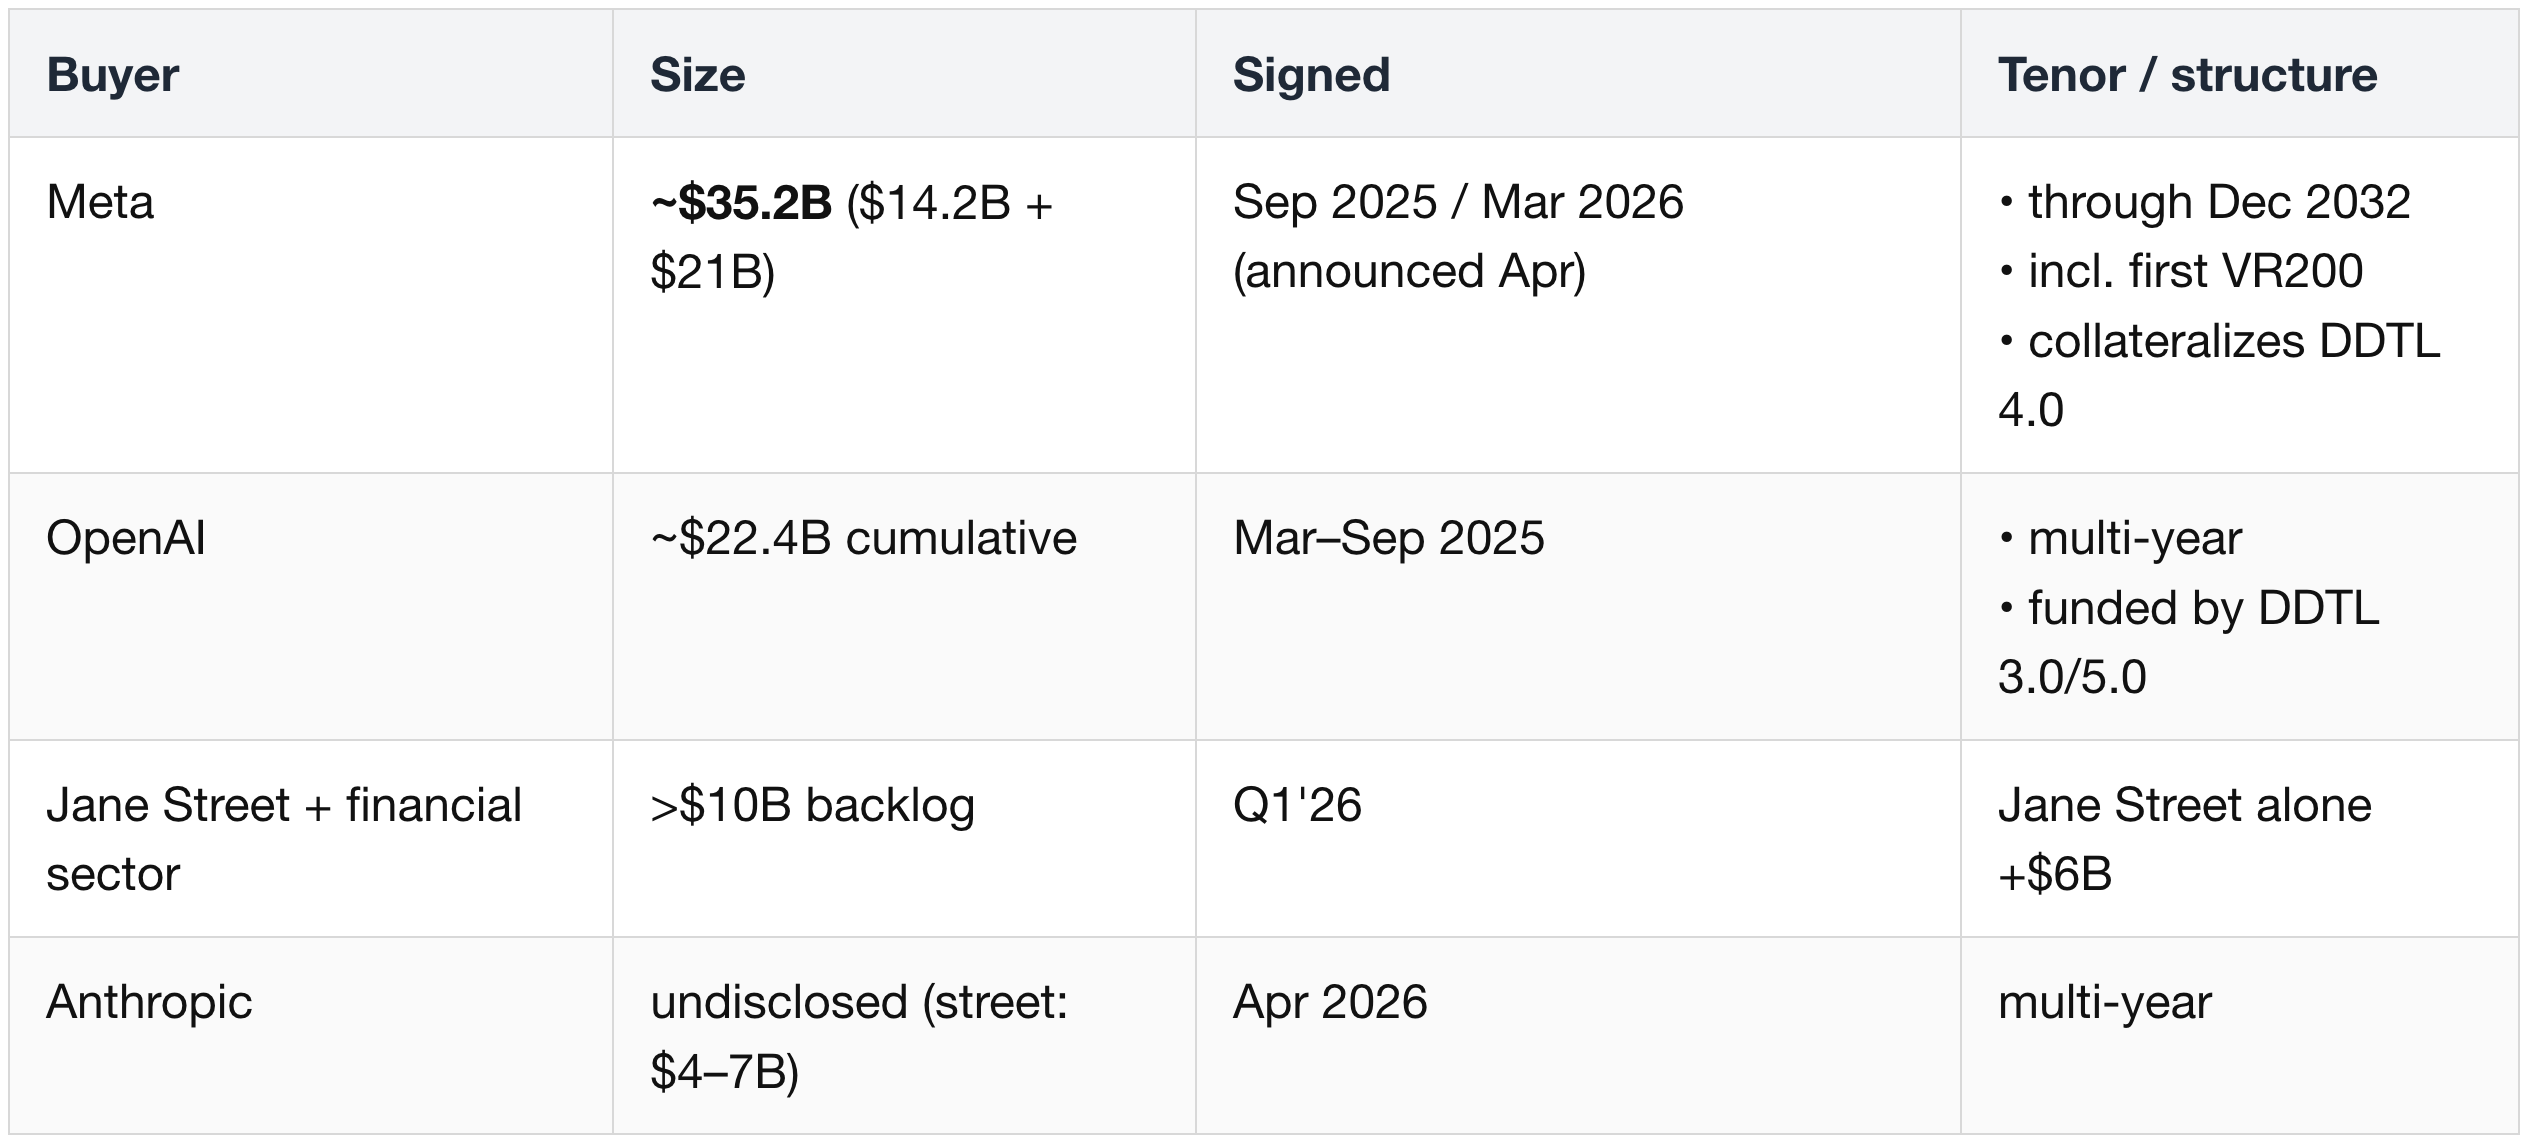
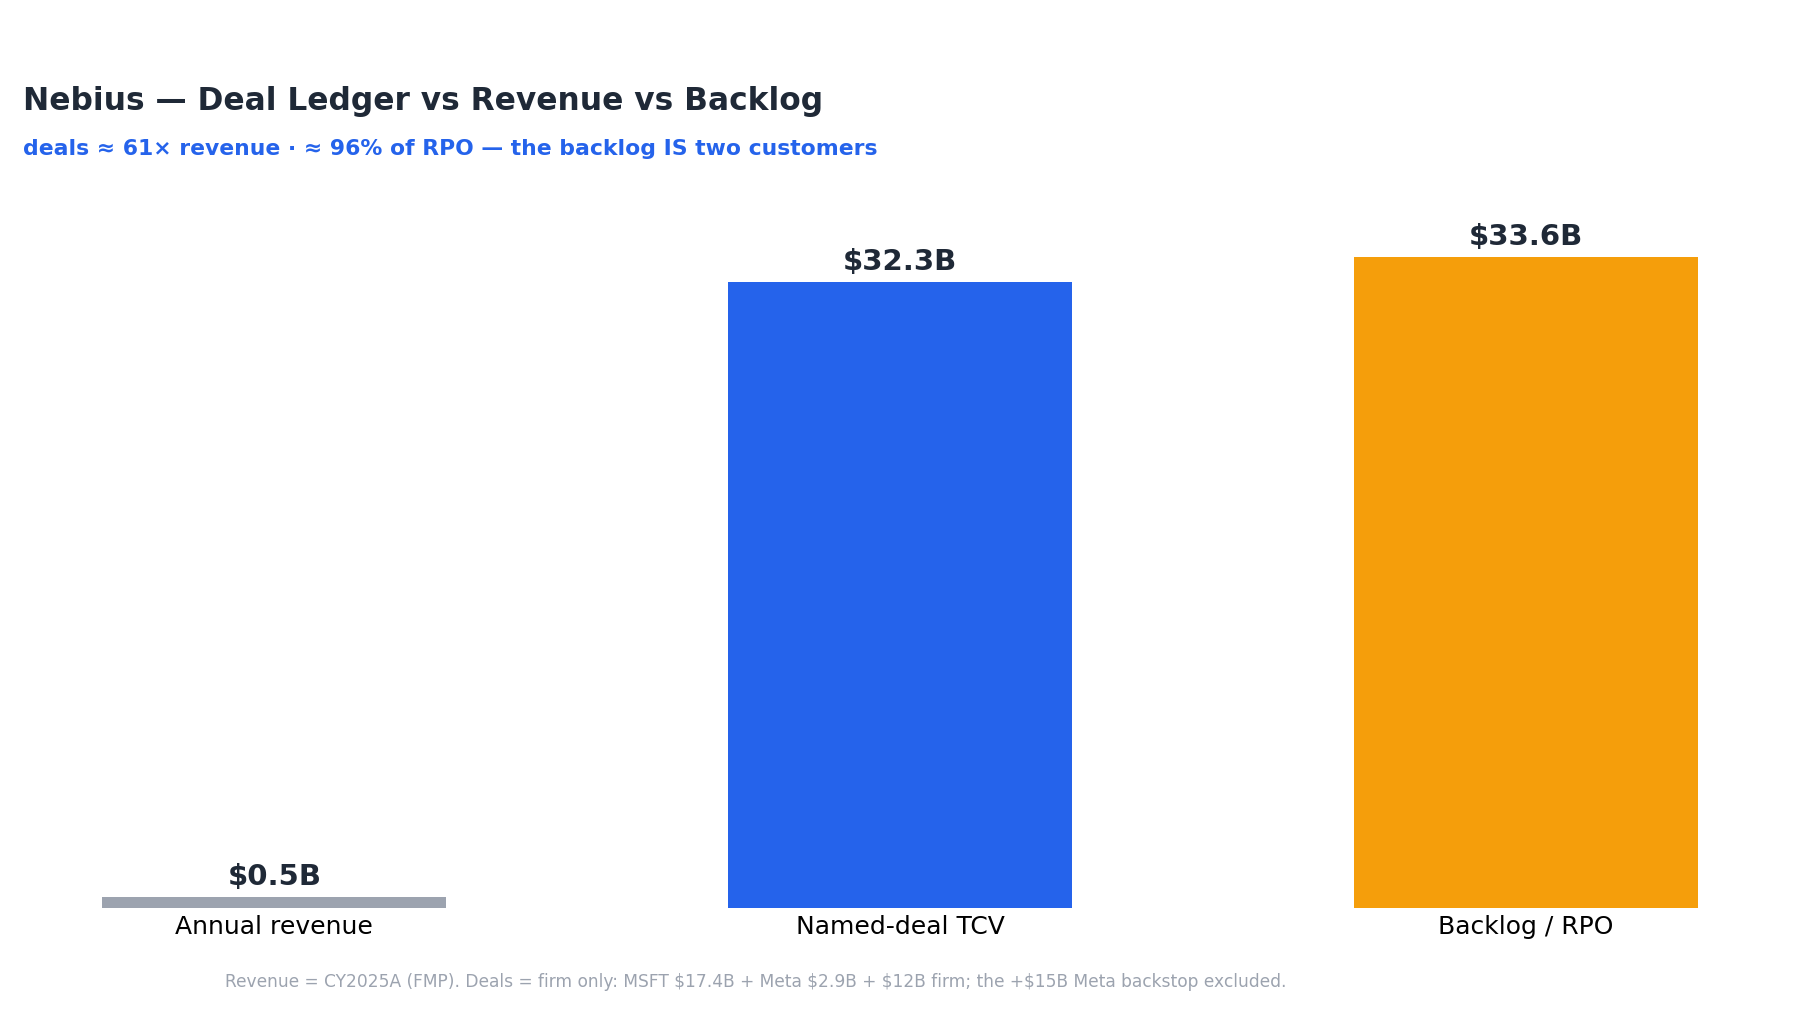
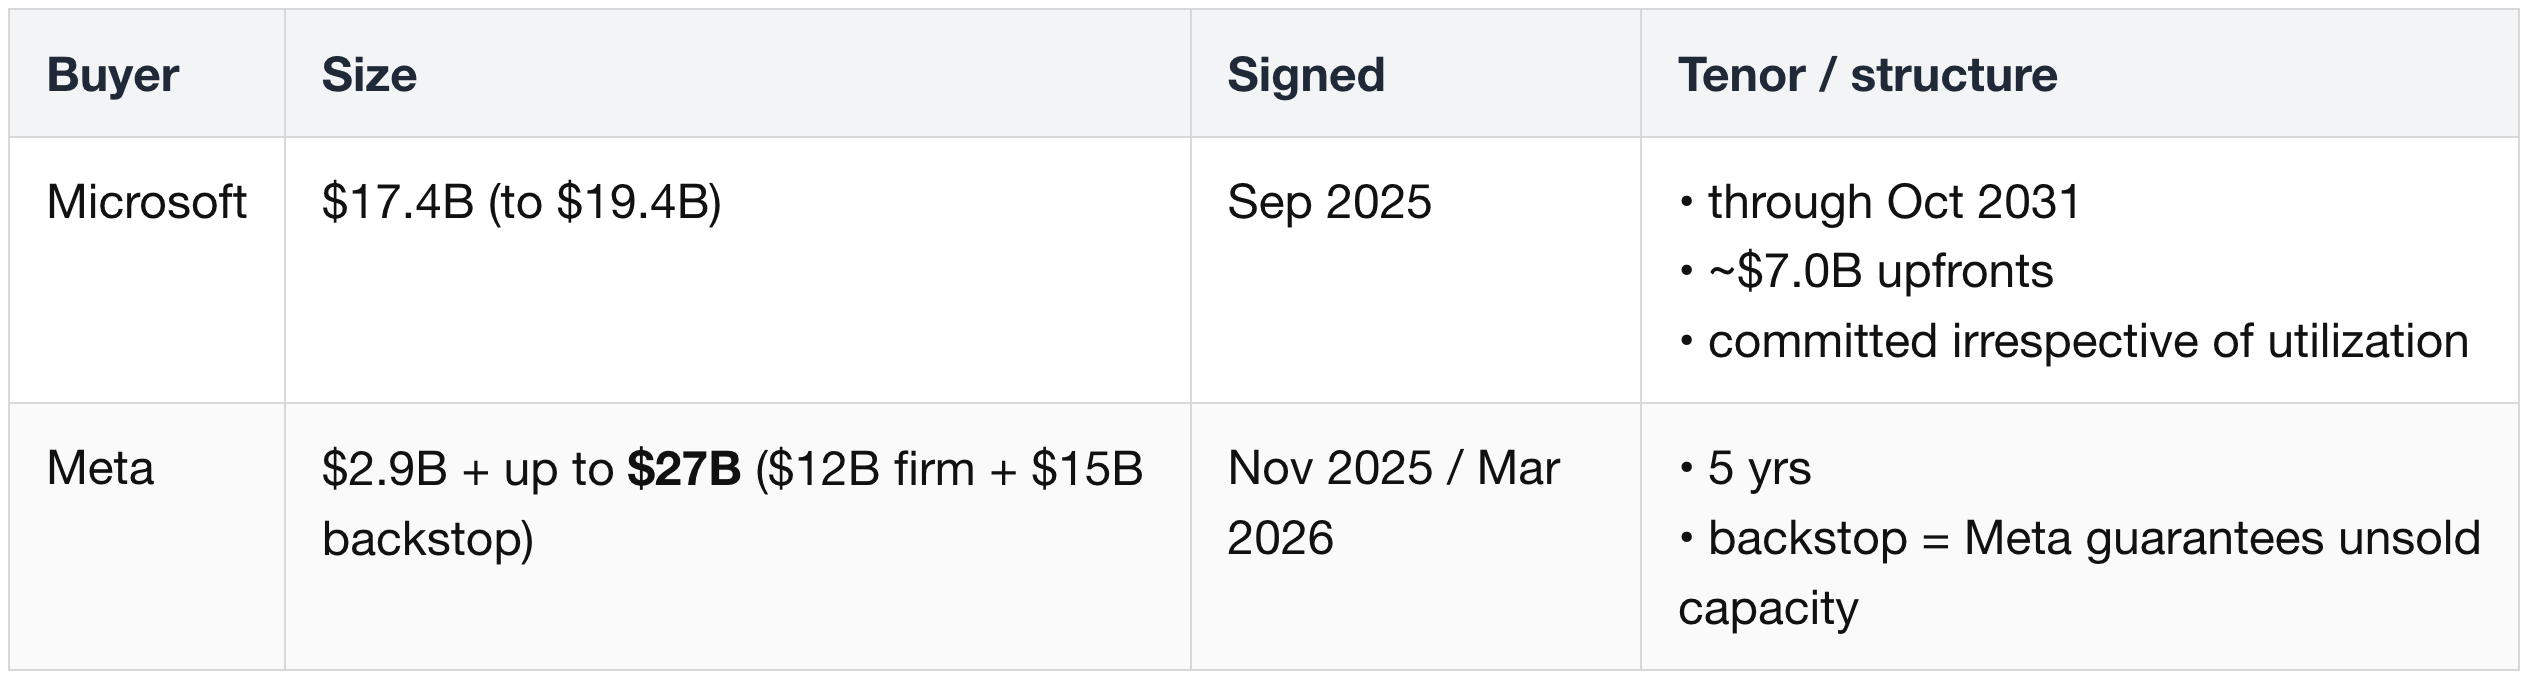
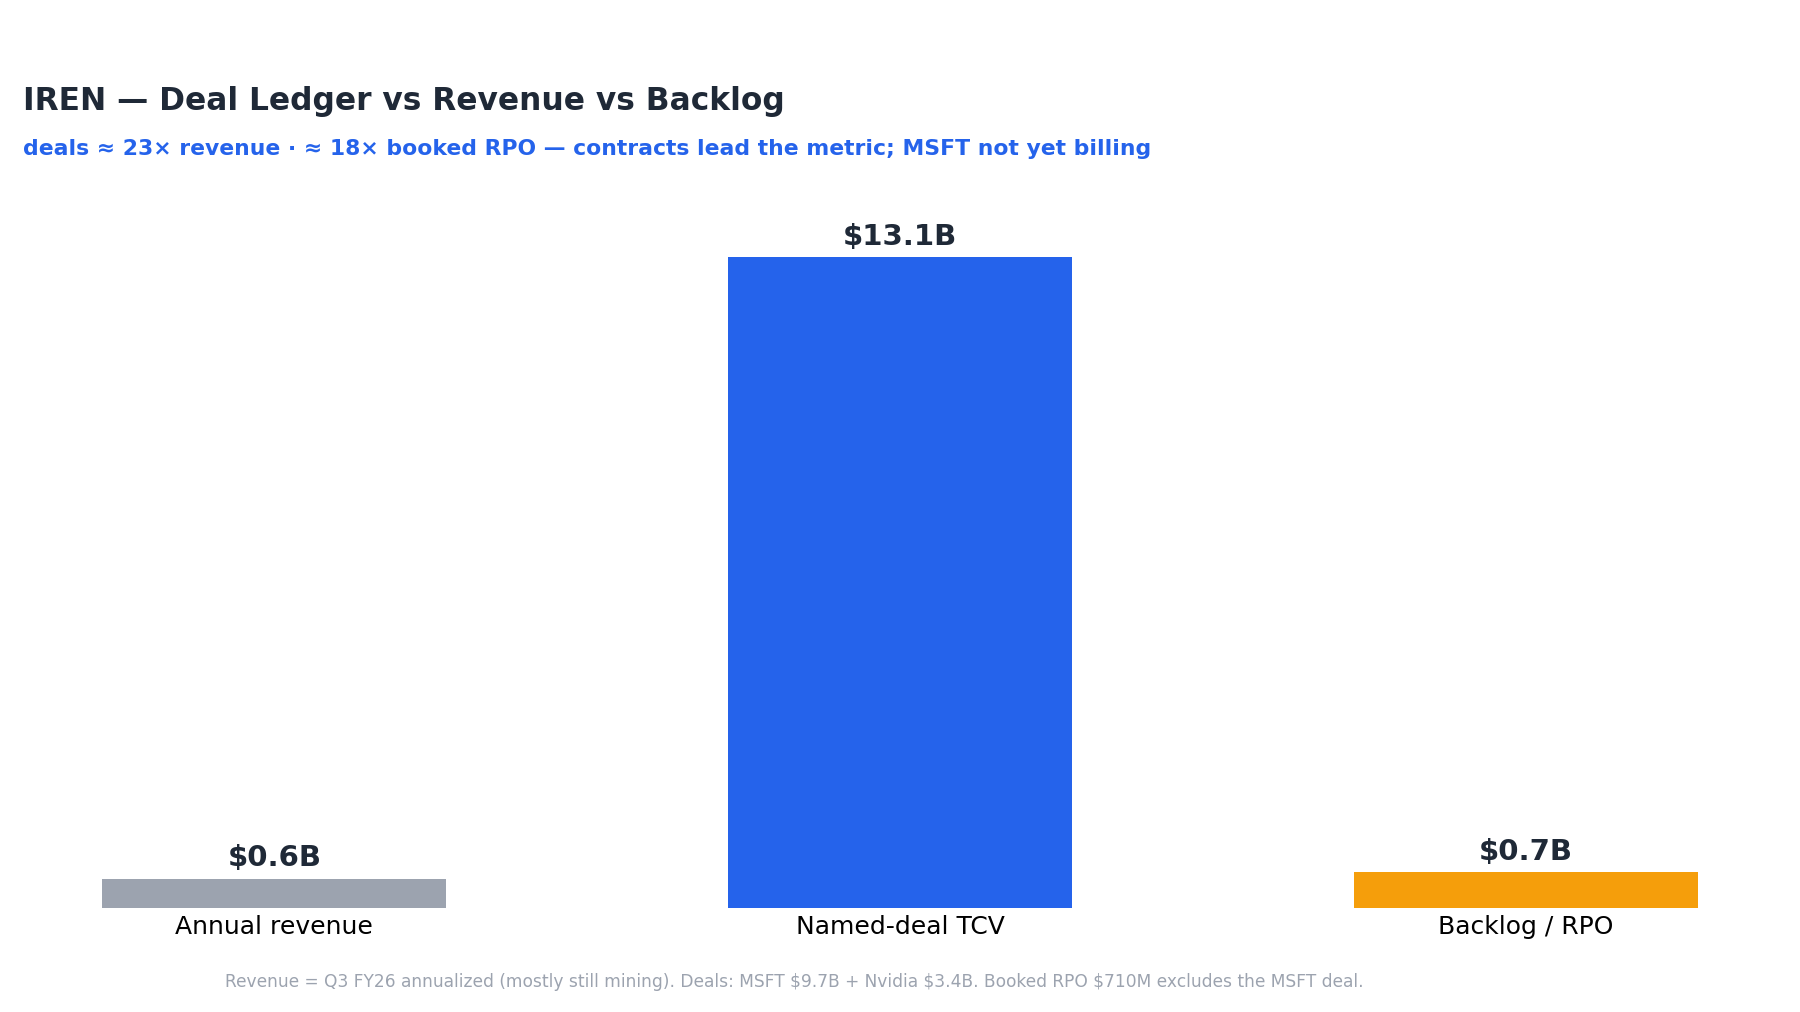
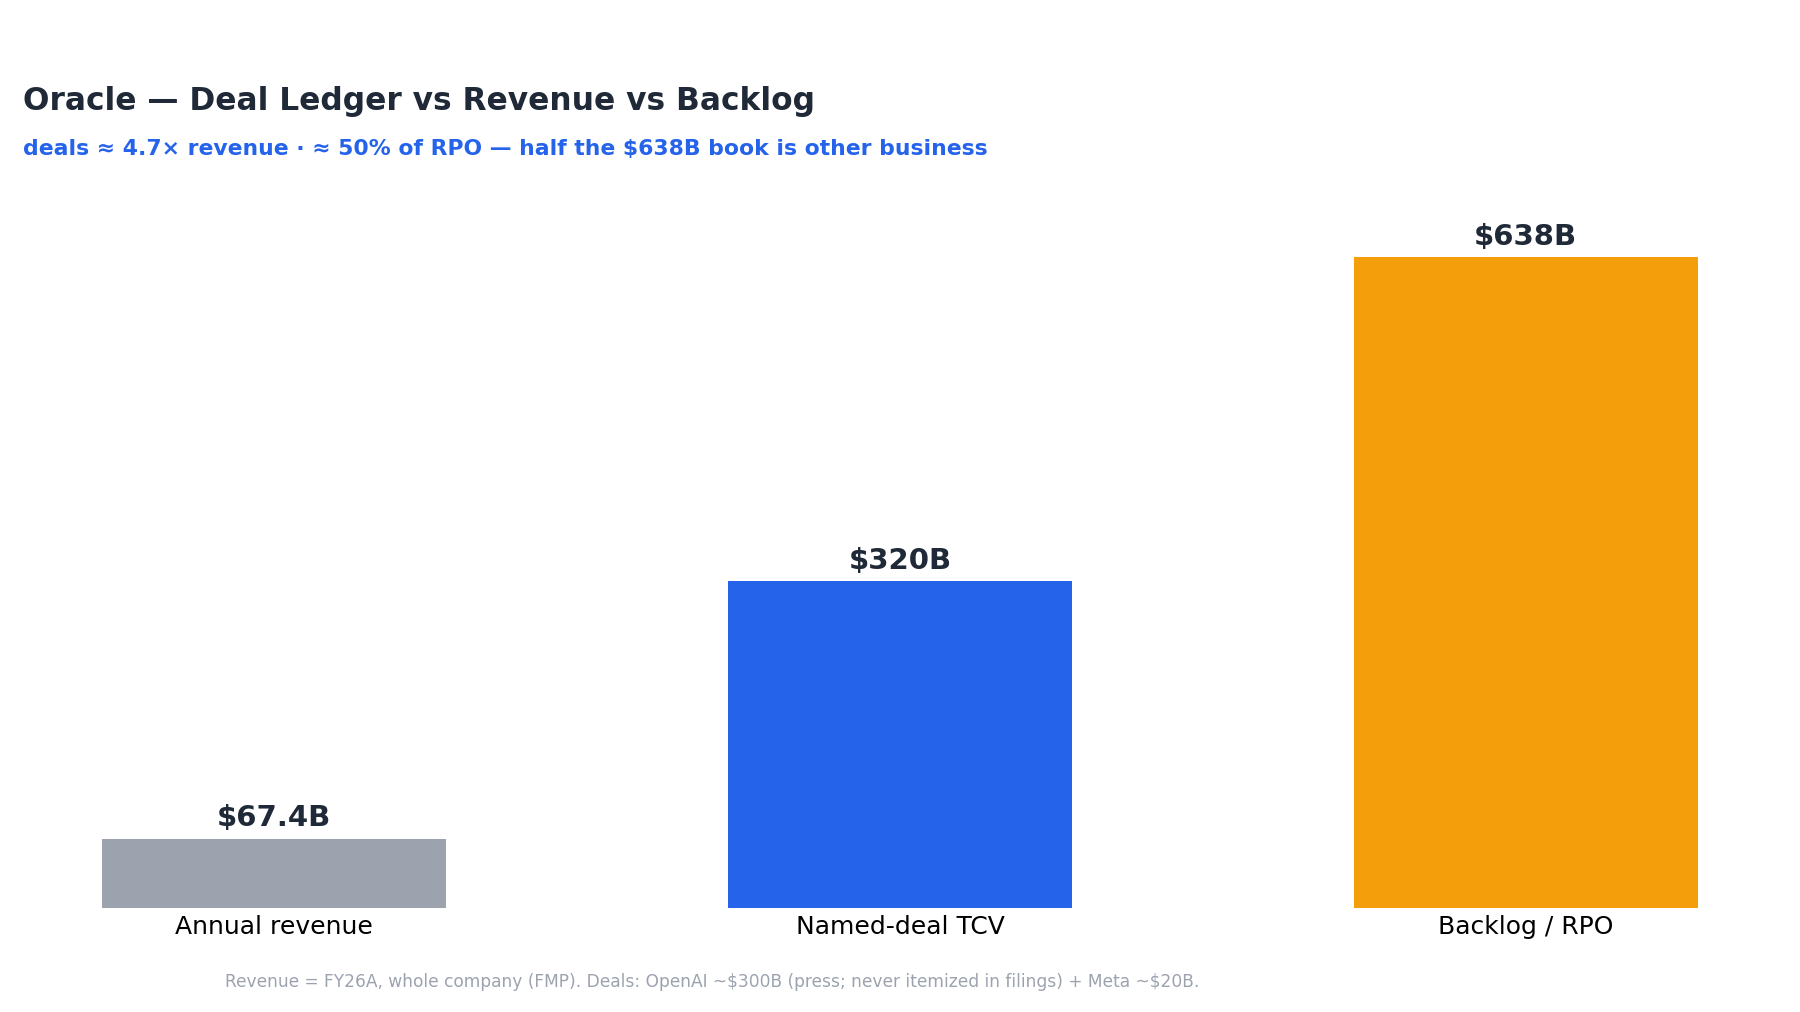
Each company block opens with a scale check — the multi-year deal TCVs against one year of revenue and the reported backlog. The deals-to-backlog gap is the per-company tell.
CoreWeave — the widest buyer base
Nebius — Microsoft-anchored, Meta-backstopped
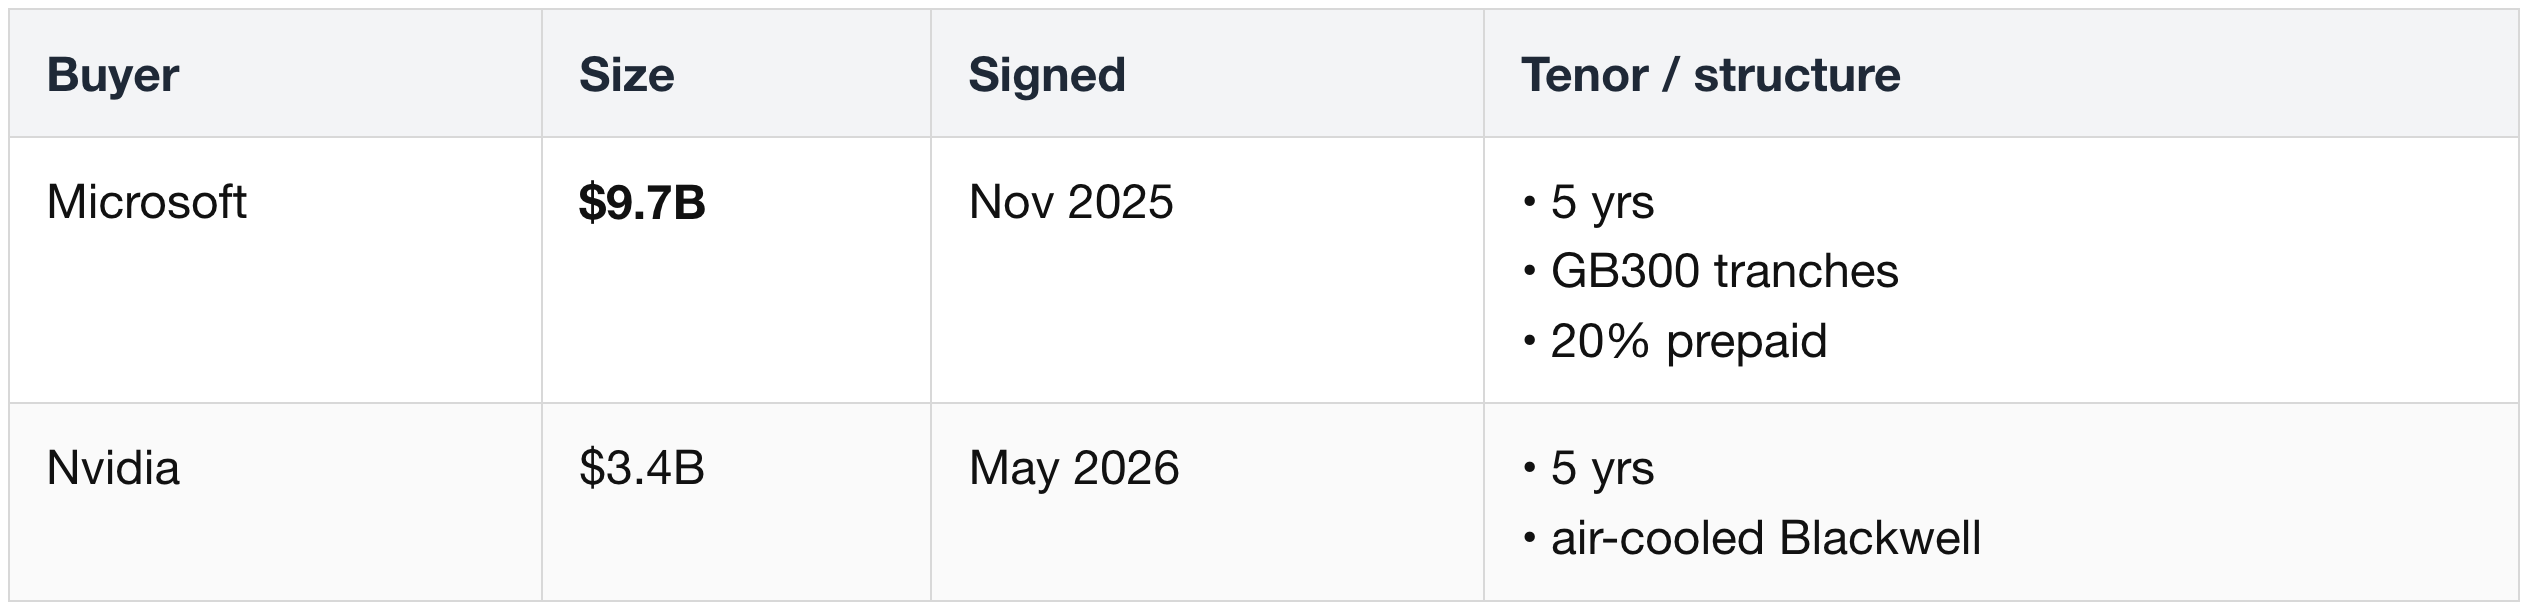
IREN — two customers, 84% of contracted ARR
Oracle — the largest single contract in the pool

SpaceX — biggest run-rates, weakest commitments
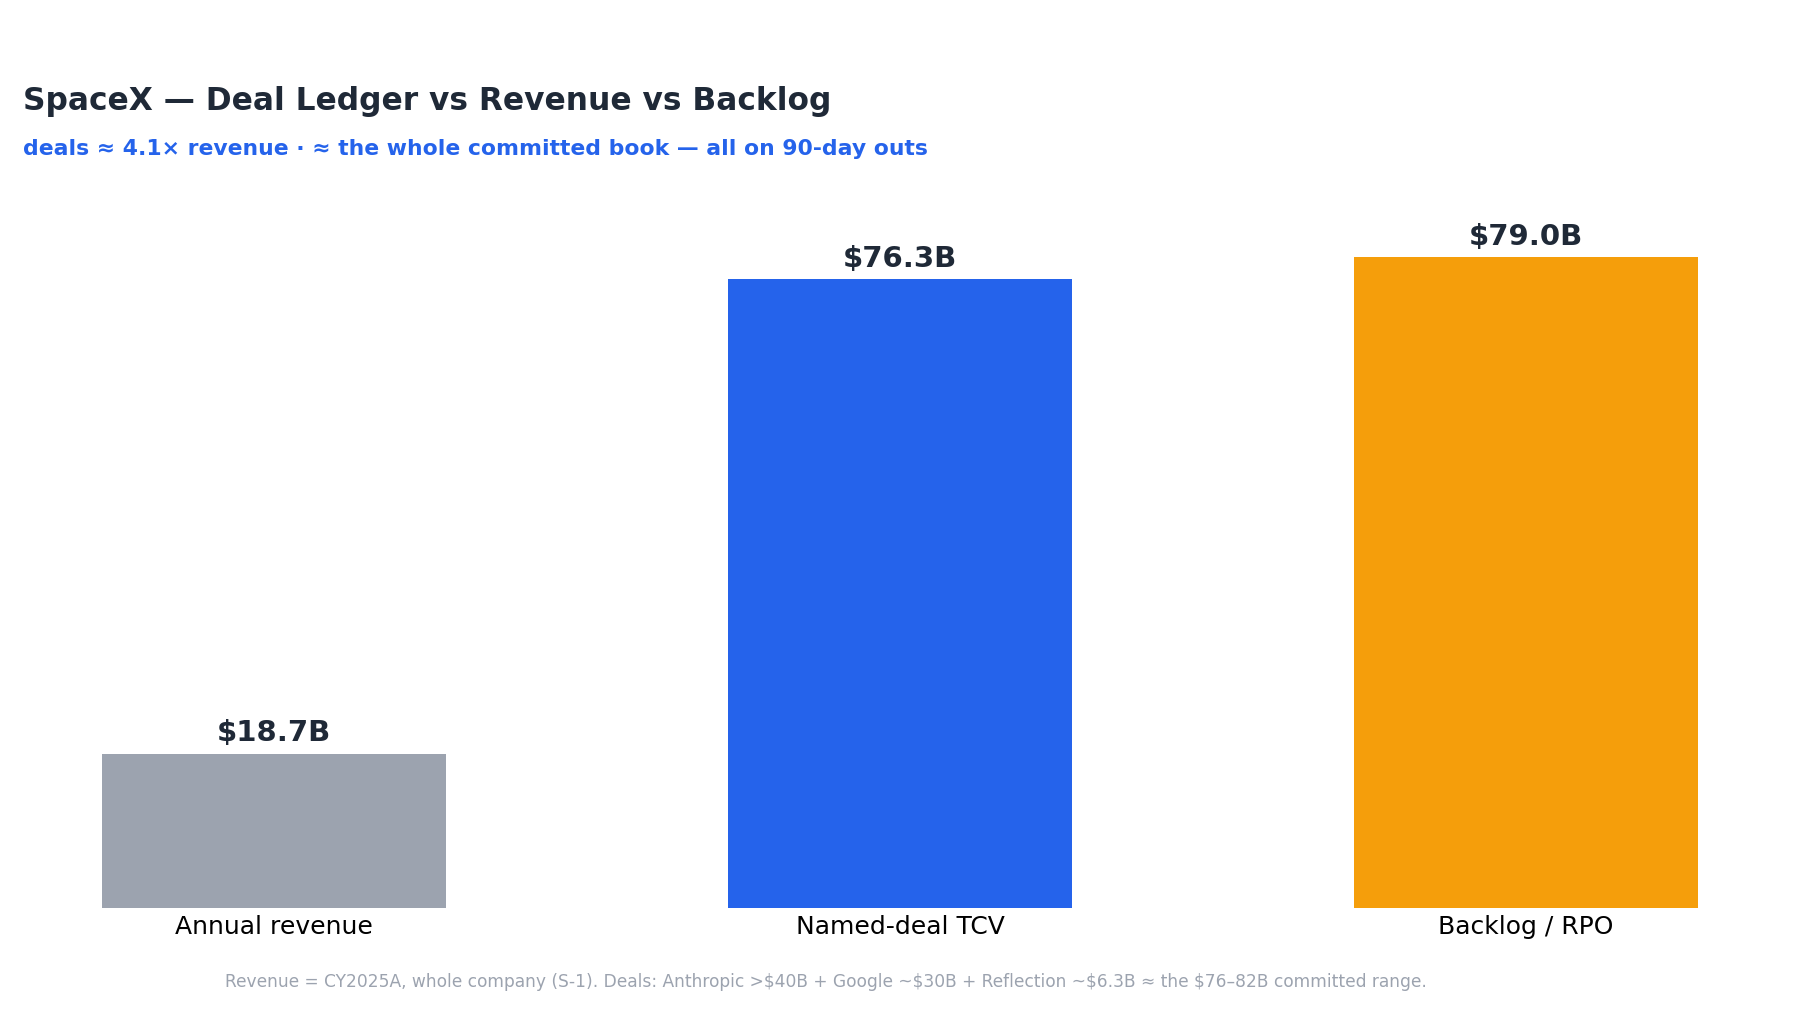
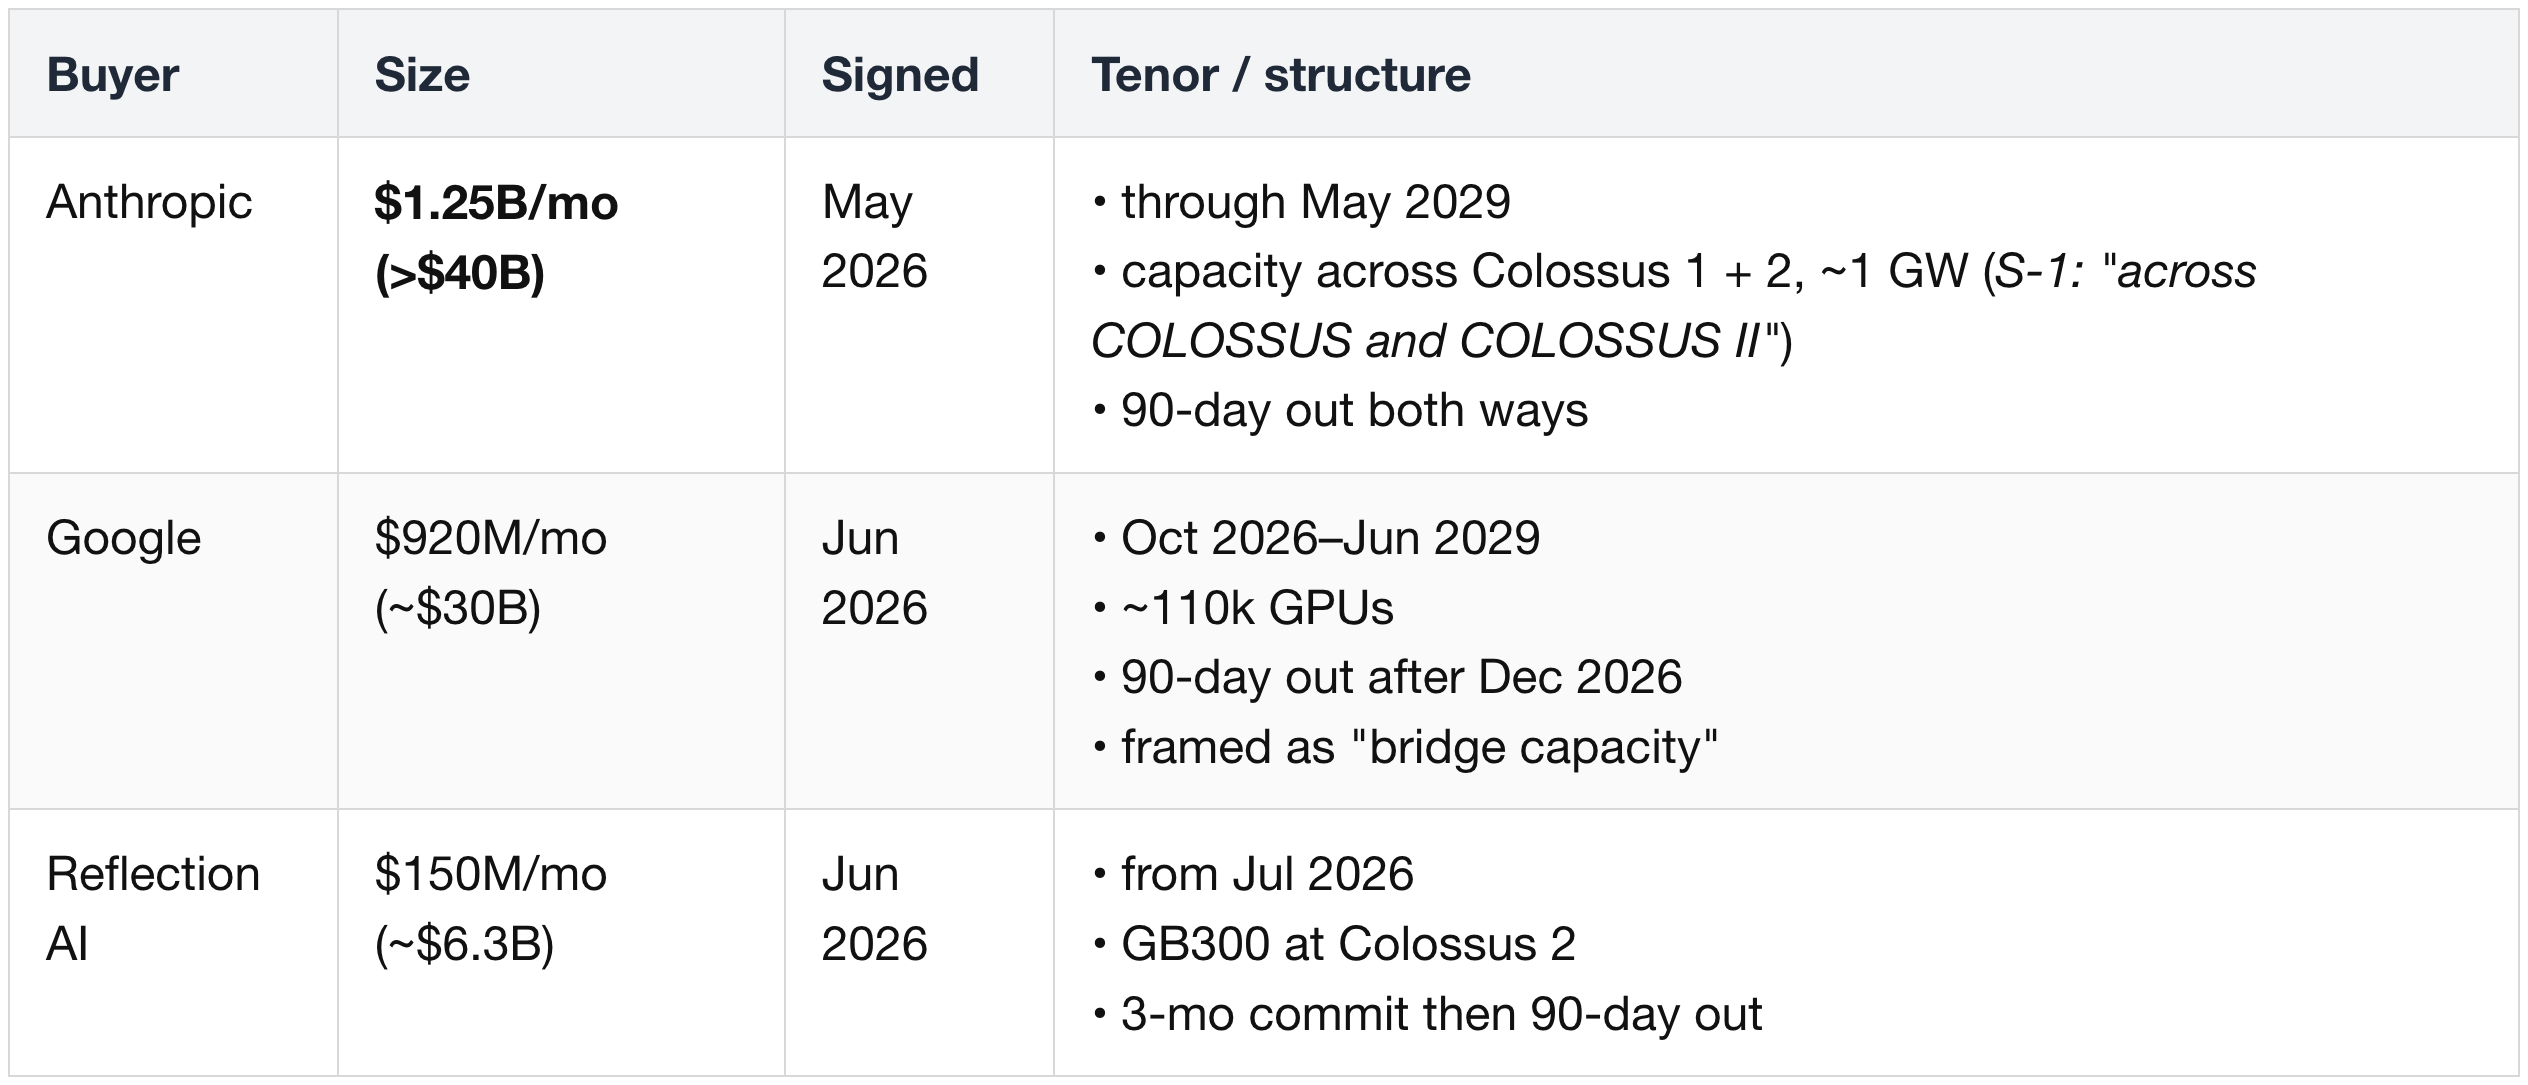
The pricing paradox — weakest commitments, highest per-unit rates. Deal quality and deal pricing are different axes, inversely linked through the term structure of compute:
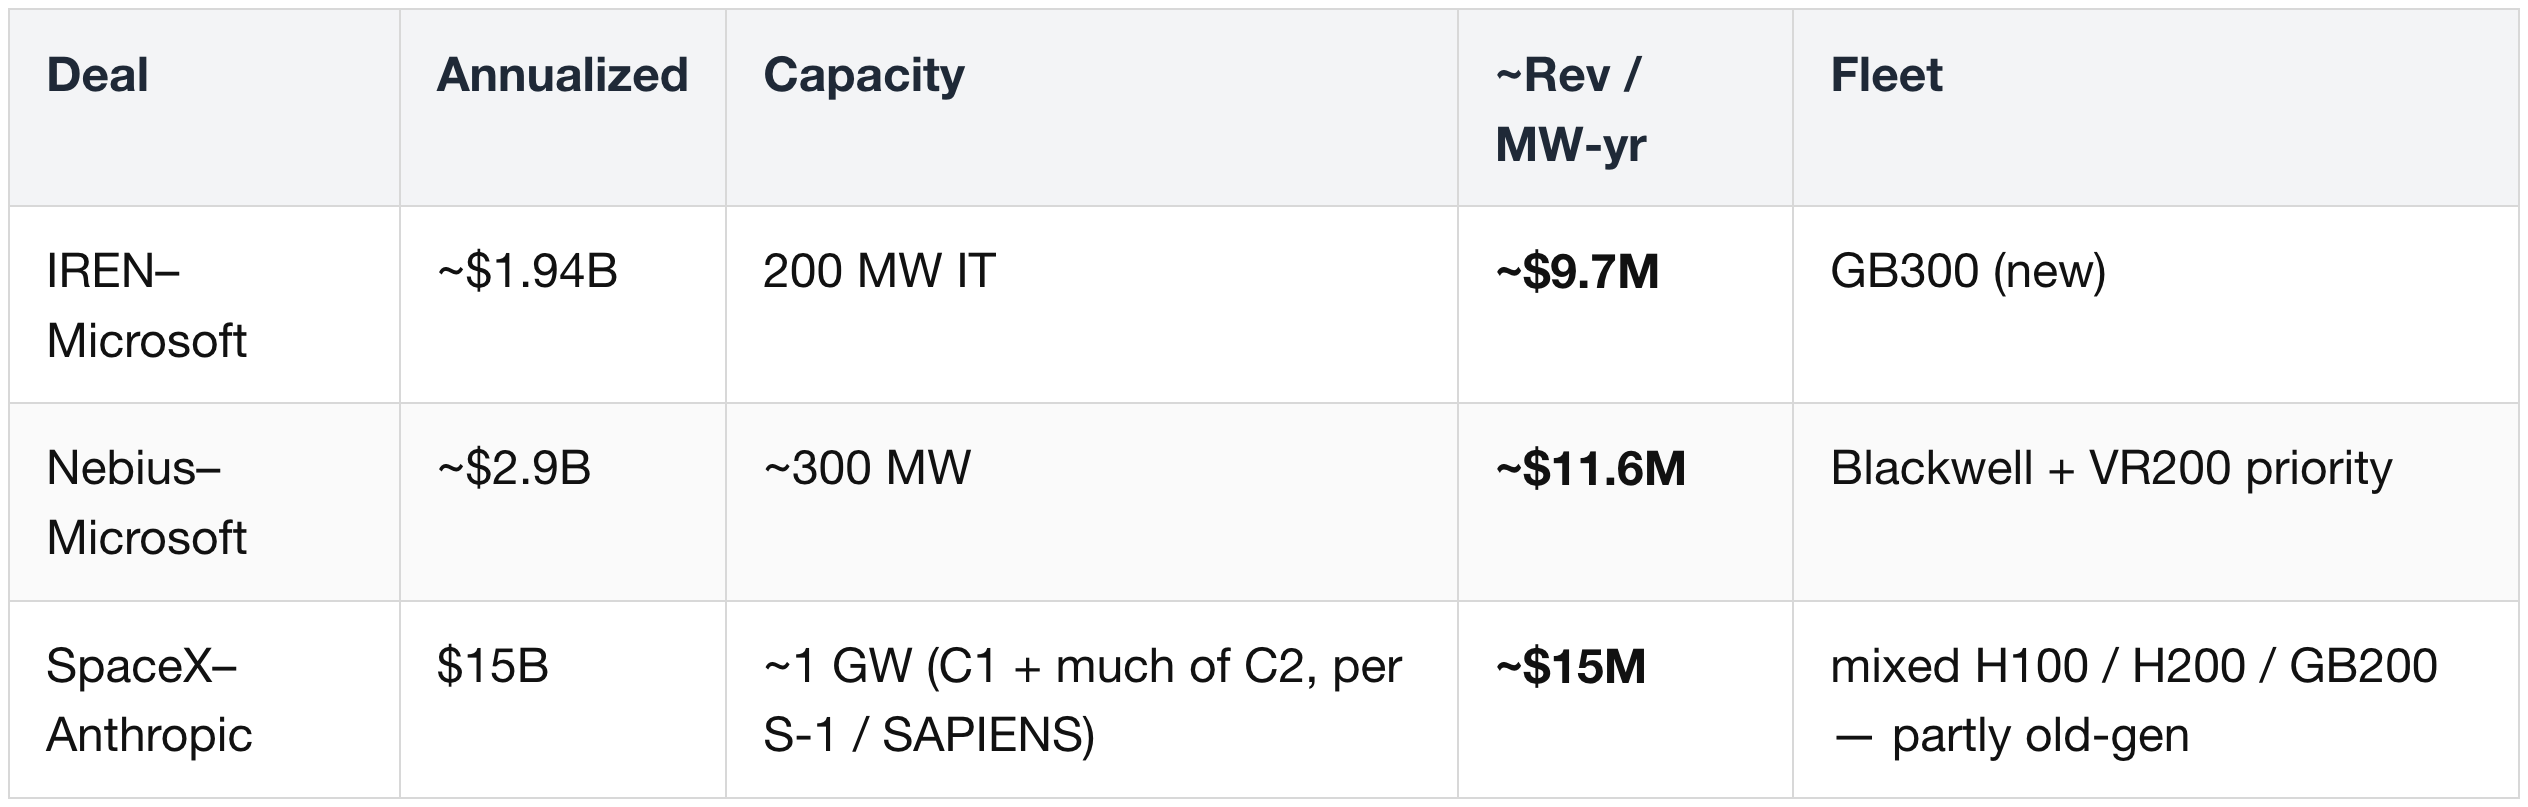
- The premium is the price of the walk-away option.
- Take-or-pay multi-year contracts are discounted — the buyer hands the seller bankable certainty and gets a lower rate for it.
- Monthly-billed with 90-day outs is effectively spot, and spot trades above committed in a shortage.
- The cleanest proof sits inside Nebius's own book: short-term Rev/MW $15.03M vs $13.06M committed (2026E) — same company, same fleet, ~15% spot premium.
- Anthropic and Google aren't paying more despite the weak commitment; they're paying more for it.
- Immediacy scarcity.
- The pool's committed deals mostly price future capacity (IREN's Horizons through 2026–27, Stargate from CY27);
- SpaceX sold already-energized capacity. In a shortage, live power carries the scarcity premium — future power is cheaper because the buyer eats the wait.
- The buyers are bridge buyers.
- Google labels its deal "bridge capacity"; Anthropic was compute-starved now.
- A bridge buyer's willingness-to-pay for immediacy is very high precisely because the need is temporary — the 90-day out is what makes ~$15M/MW-yr rational for them.
- From SpaceX's side, the premium is compensation
- for the demand risk it retains (the book can evaporate on 90 days' notice),
- and for keeping the reallocation option (pull capacity back for Grok, per the S-1).
- Net:
- the pool's strongest deals (Microsoft's prepaid, committed-irrespective-of-utilization contracts) are the cheapest per MW;
- the weakest-commitment book prices the highest.
- Quality ranks bankability; premium ranks immediacy + flexibility.
- SpaceX isn't selling backlog — it's selling spot, and spot pays better until it doesn't.
In Overall,
- The bankability chain is the point.
- Signed take-or-pay contract → ratable cash flows → contract-collateralized debt at falling spreads → GPUs delivered → next contract.
- DDTL 4.0 (A3 / A-low, <6%, non-recourse, Meta-backed) and IREN's A-rated SPV prove the chain now reaches investment-grade credit — pension and insurance money is funding GPU fleets.
- Unthinkable in 2023, when the same trade cost 14–15% from Magnetar (CRWV's DDTL 1.0 — the private-credit first mover on GPU-backed lending):
- Deal quality is now the axis to score, not deal size.
- Strongest: committed-irrespective-of-utilization + prepaid (MSFT–NBIS, MSFT–IREN, Oracle BYOH).
- Middle: multi-year take-or-pay without prepay (Meta–CRWV, OpenAI–CRWV).
- Weakest: monthly-billed with 90-day termination rights (all three SpaceX offtakes) — closer to an at-will run-rate than a backlog, whatever the headline total says.
- Second-order effect: prepayments and BYOH shift bargaining power toward whoever owns energized power.
- Demand so exceeds supply that customers now finance the supplier.
- Cleanest evidence: Oracle's $75B of BYOH / prepaid signings and Nebius' $4.8B deferred-revenue balance.
4. Why Nvidia Invests to Grow the Neocloud Ecosystem

(1) Demand diversification
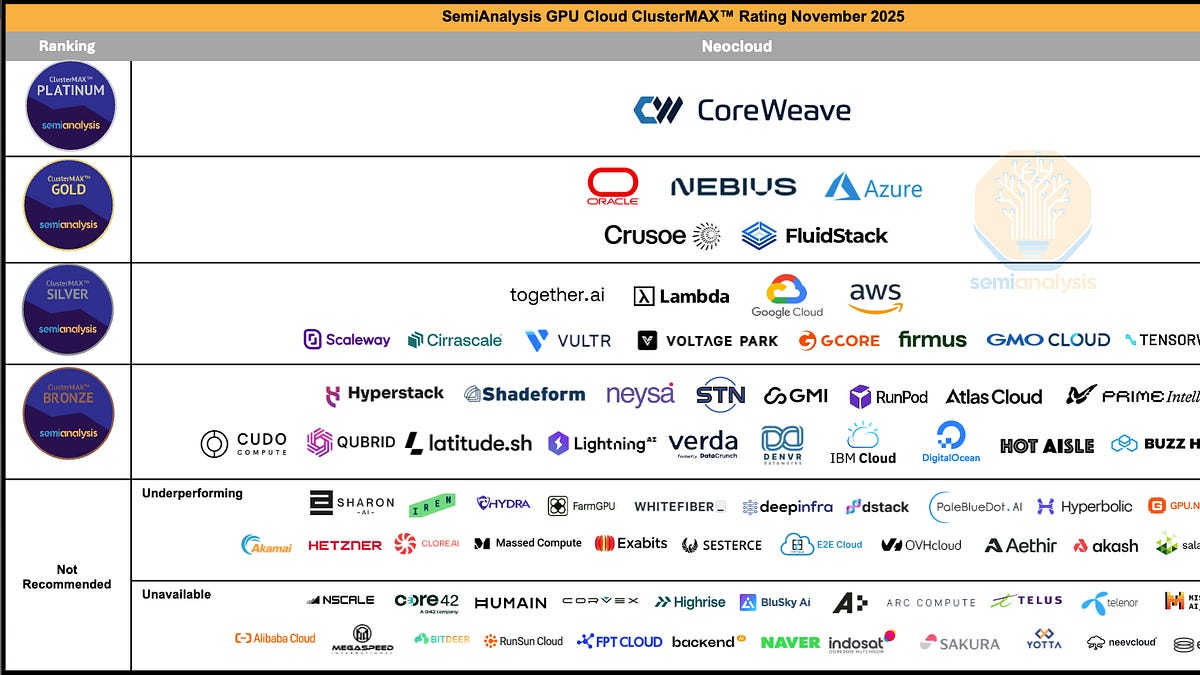
- If Nvidia's demand were concentrated in four hyperscalers — each building its own silicon (TPU, Trainium, MTIA, Maia) — its pricing power would erode with every internal-chip generation.
- Neoclouds are a counterweight customer class that is structurally loyal: 100% Nvidia fleets, contracts that specify Nvidia hardware, no in-house silicon program.
- Oracle's 50k-unit AMD MI450 order is the exception that tests the rule.
(2) Allocation as the moat it grants
- Nvidia decides who gets each generation first — and that sets the winner's Rev/MW.
- Nebius with 2H CY26 VR200 priority earns ~$1,160M per 100 MW vs IREN's Blackwell-based ~$970M — a ~20% revenue premium on identical power for being earlier in the queue.
- Being chosen by the board's designer is the single largest exogenous driver of neocloud value.
(3) Nvidia's skin in the game, per name
- CoreWeave: 11.5% equity (13G/A, Jan 2026), $2B additional (Jan 2026), a $6.3B capacity backstop (buyer of last resort through 2032), first access to each generation.
- Nebius: $700M (Dec 2024) + $2B warrant (Mar 2026).
- IREN: rights to 30M shares (~$2.1B) vesting on GPU deliveries up to 600k units.
- xAI / SpaceX: up to $2B in the Colossus 2 GPU SPV + Series E participation.
- The pattern — equity in the buyer, allocation to the buyer, backstop for the buyer's unsold capacity. Nvidia manufactures its own demand-side depth.
(4) The AI project trinity — why the ecosystem needs Nvidia's balance sheet
Every AI compute buildout has to assemble three things at once, and each is gated on the other two:
- (a) Capital — lenders don't lend against GPUs alone. Debt prices only when an investment-grade counterparty stands behind the cash flows: a long-term hyperscaler offtake, or a backstop.
- (b) Offtake — the neocloud needs the long-term customer contract before it can order the GPUs; the customer won't sign until it sees the equipment and the datacenter actually secured. Chicken and egg.
- (c) Datacenter — operators prefer 10–15-year leases to hyperscaler credit; a sub-IG neocloud gets quoted higher rents or turned away outright.
- So the loop closes on itself: to borrow, the neocloud needs a customer contract → to win the contract, it needs equipment and a datacenter → to secure the datacenter, it needs the customer's money and contract again.
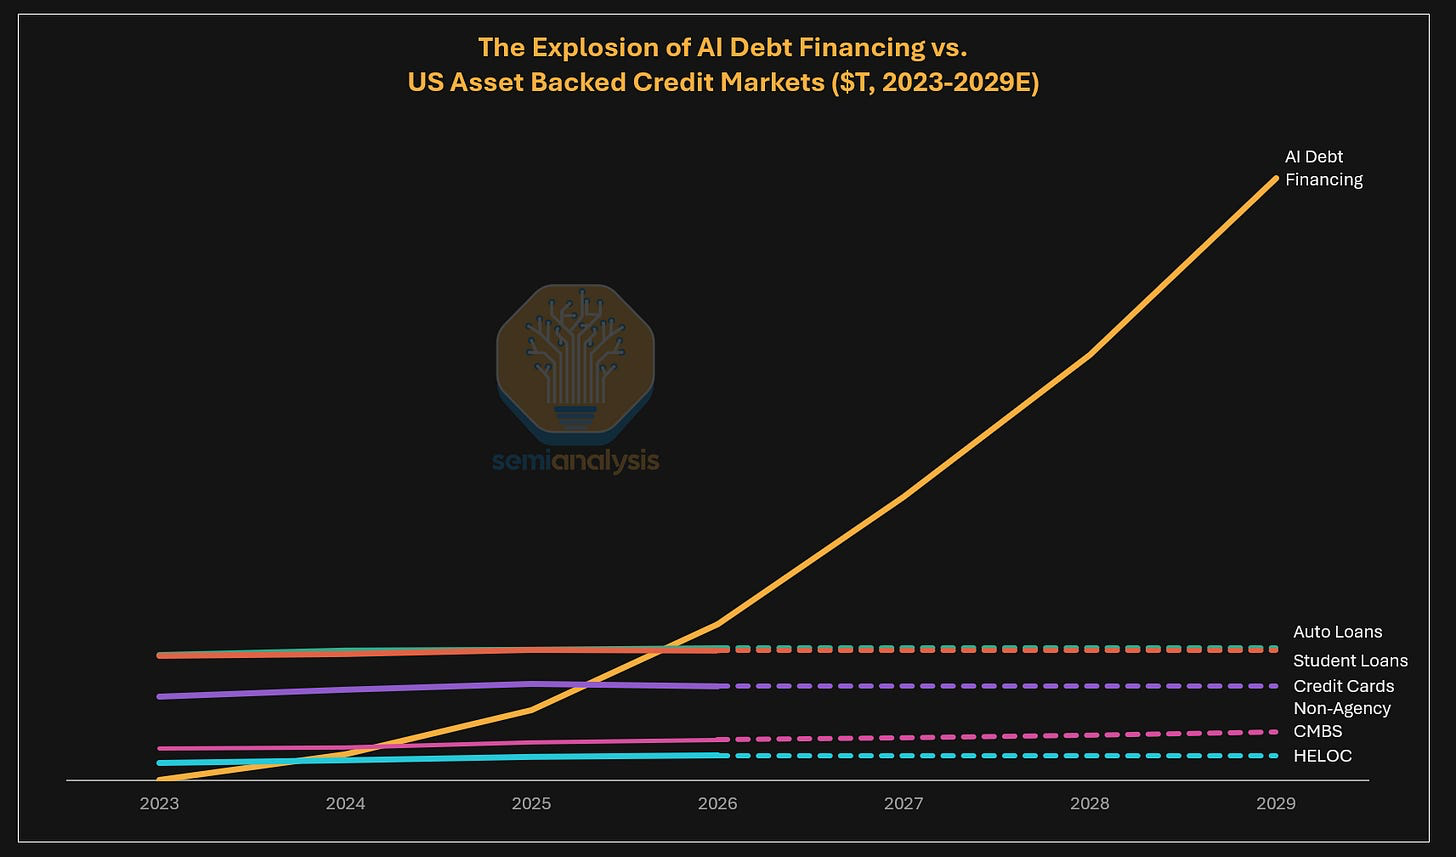
- The stakes are macro-scale: SemiAnalysis models outstanding AI debt reaching ~$7.1T by 2029 — which would make it the second-largest asset-backed credit market after the ~$13T US mortgage market — against annual AI capex north of $2T in 2028 and ~$11.1T cumulative over 2024–29.
- Hyperscaler balance sheets cannot backstop trillions of dollars of compute; outside the 5-year IG-offtake template, lender appetite drops off almost entirely.
- And the 5-year template locks out exactly the buyers a broad market needs: inference providers won't commit beyond 1 year, while the few neoclouds offering 1-year terms demand prepays of up to 100% of contract value.
(5) The backstop program
Nvidia's answer — generalizing the CoreWeave arrangement above into a formal program (announced July 2026; mechanics per SemiAnalysis):
- The structure: the neocloud buys Nvidia GPUs and builds the cluster
→ Nvidia commits, typically for six years, to purchase the compute at a pre-agreed price if outside customers don't
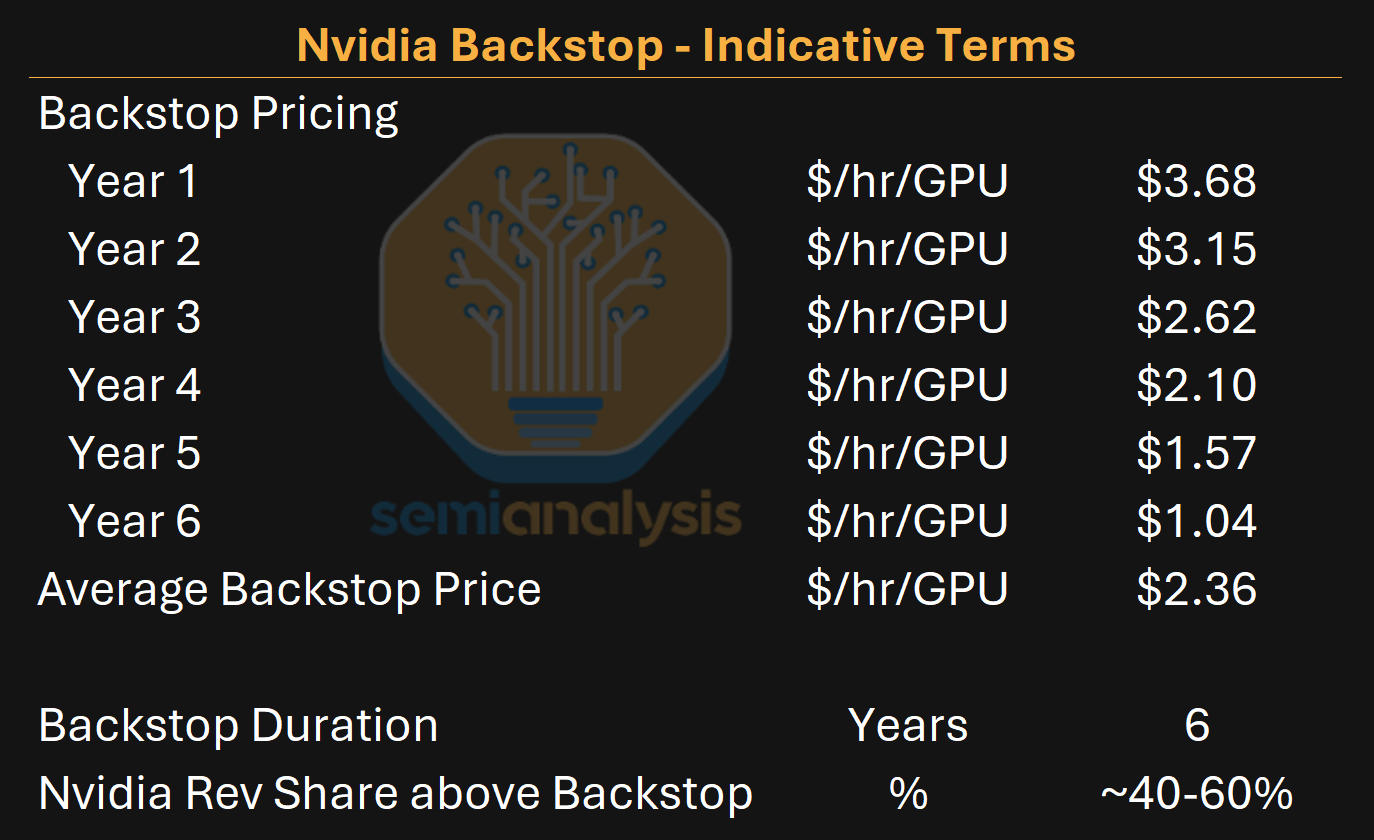
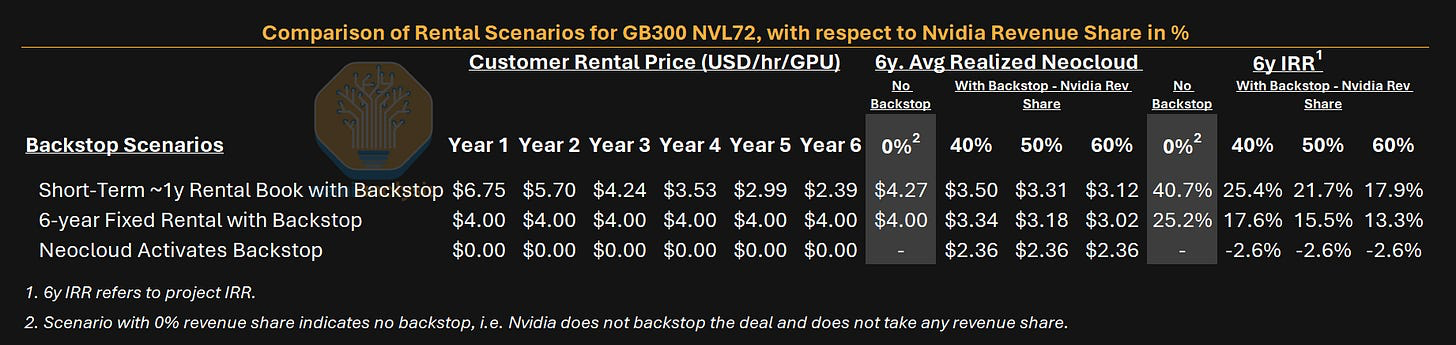
→ and when the neocloud rents above that floor, the excess is shared with Nvidia — a 40–60% Nvidia share, negotiated deal by deal. - The floor is not flat — it steps down with the market cost of compute. SemiAnalysis's illustrative GB300 curve runs $3.68/hr in year 1 down to $1.04 in year 6, averaging ~$2.36 (the low end of the plausible range; most neoclouds should negotiate higher).
Worked example (GB300, year 1)
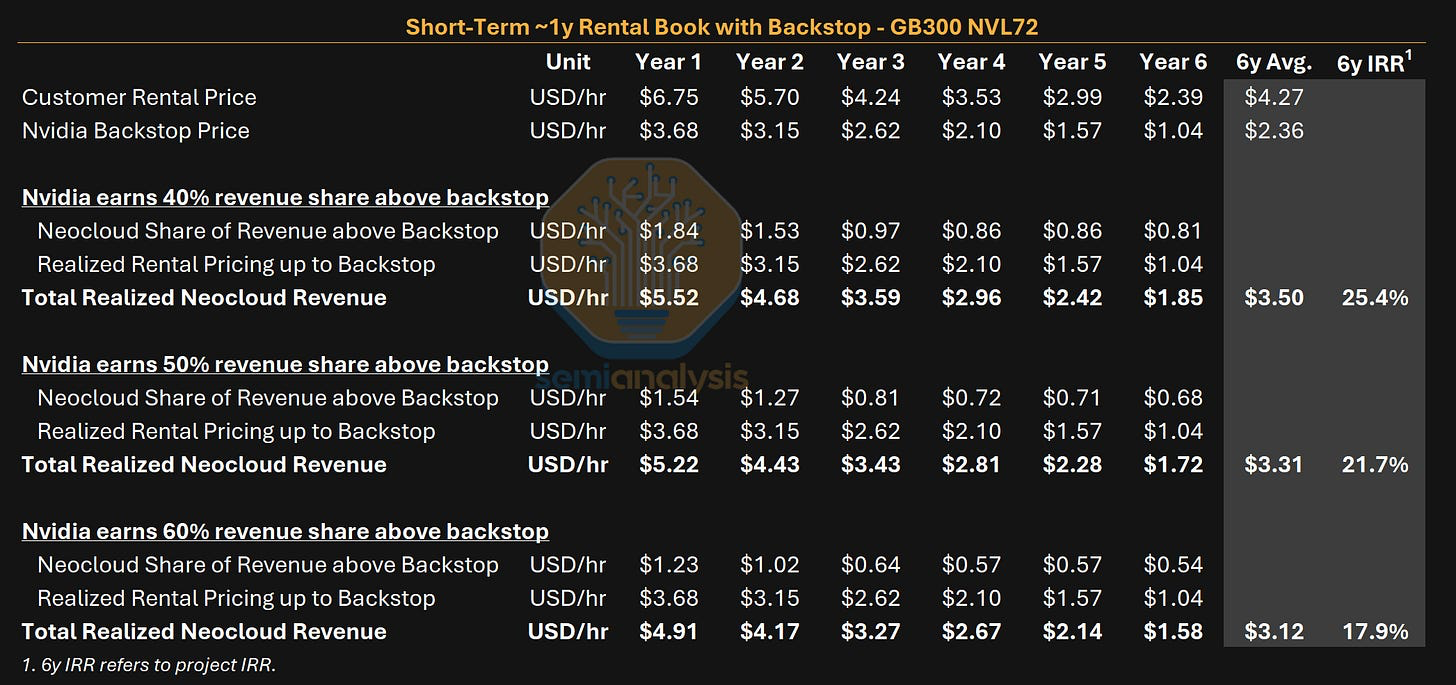
- Market rent ~$6.75/GPU-hr vs a backstop price of ~$3.68/hr.
- Of the $3.07 excess, Nvidia's assumed 40% share takes ~$1.23/hr;
- the neocloud keeps the other $1.84 and realizes ~$5.52/hr in total — over the six years, an ~18% average Nvidia take rate on the neocloud's rental revenue.
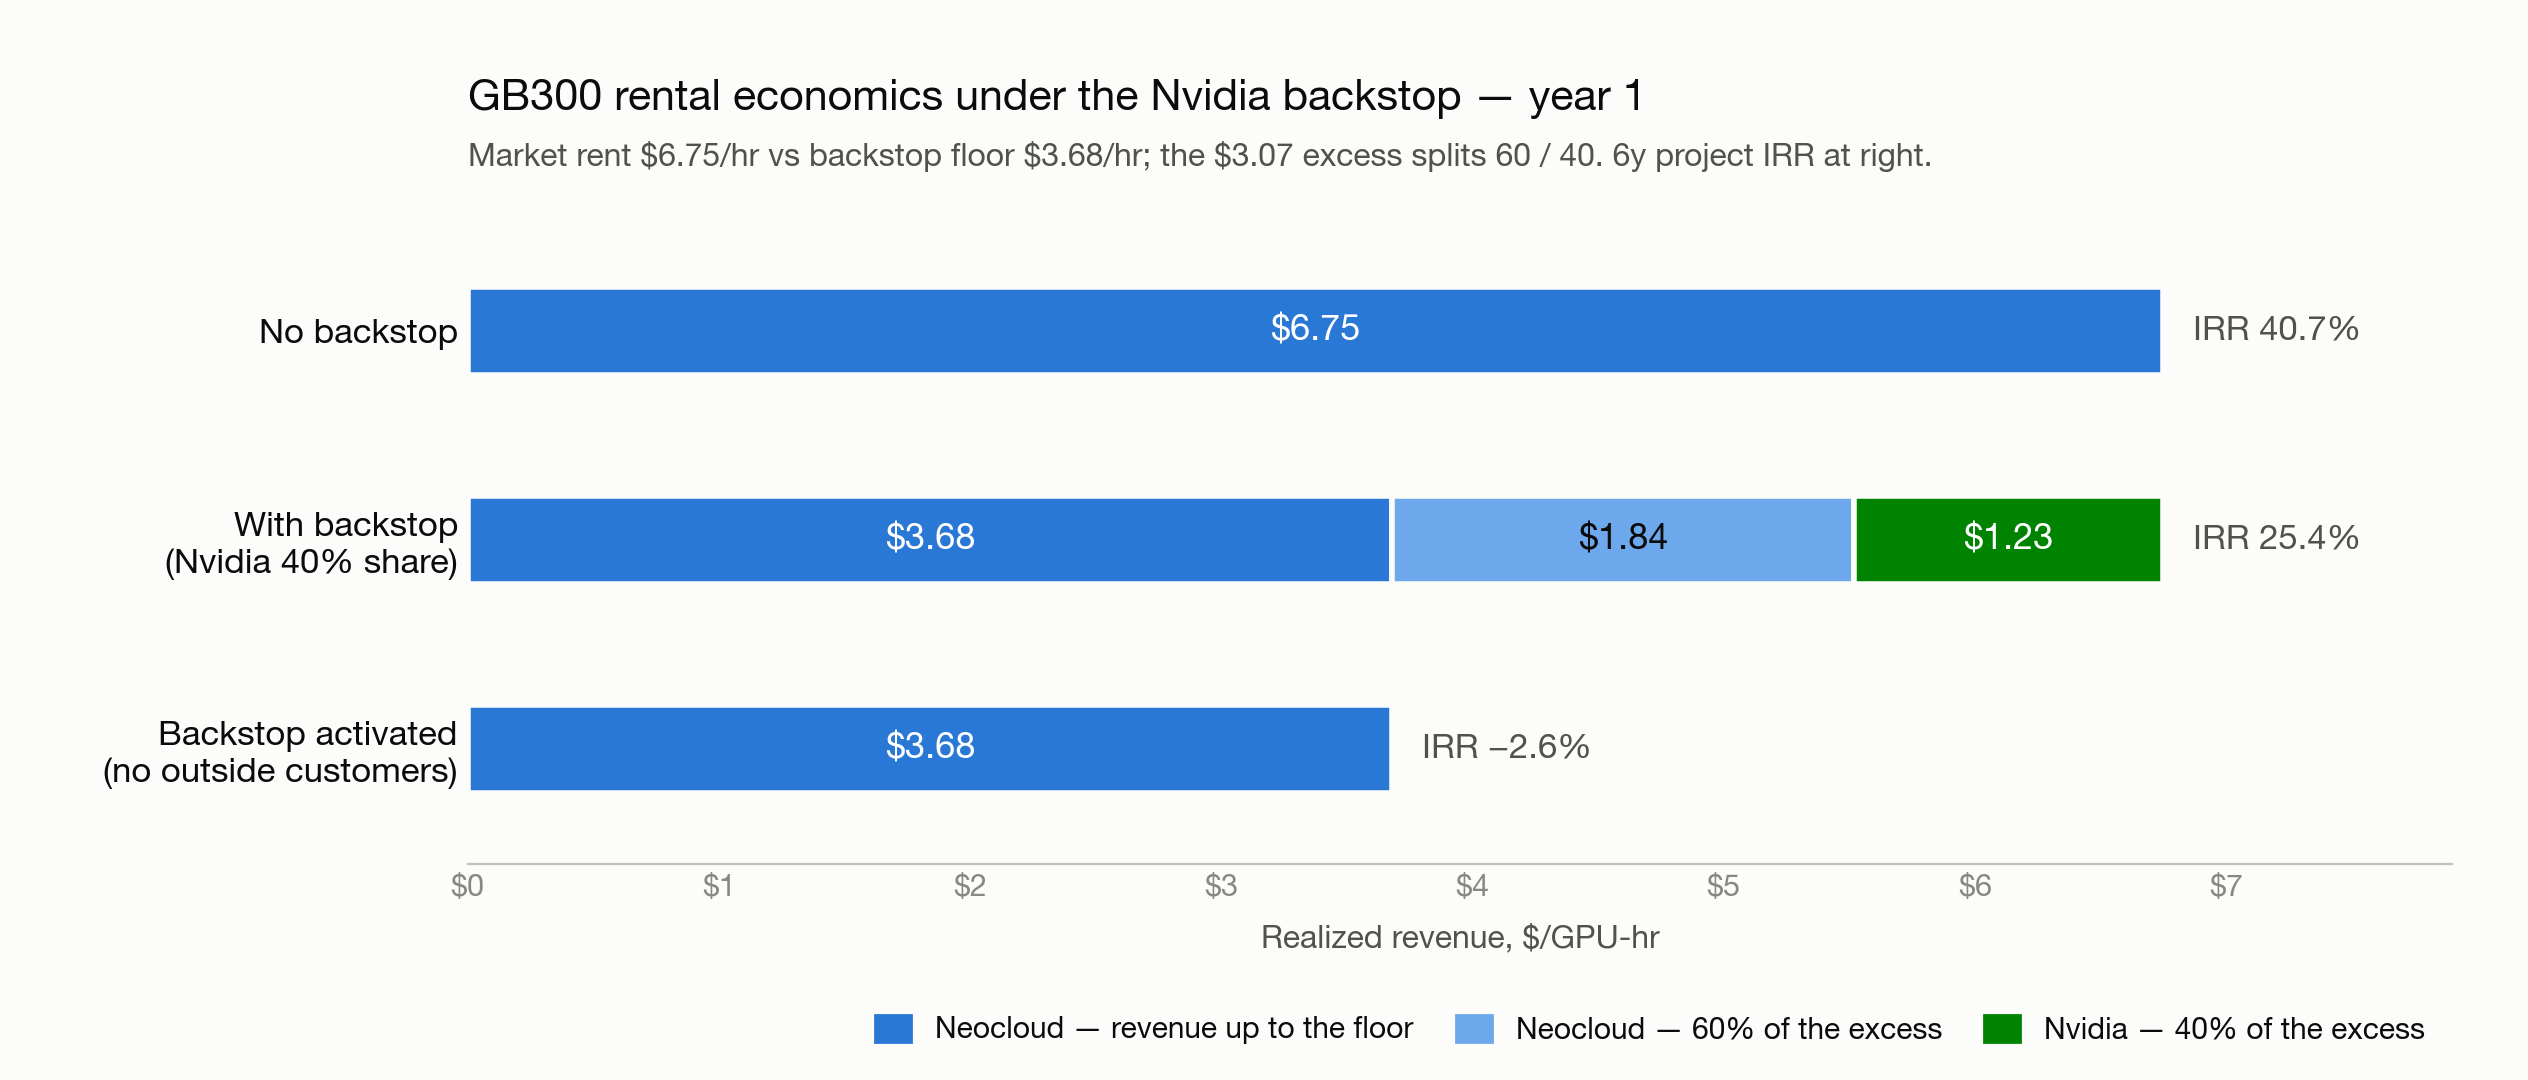
- Without the backstop the neocloud keeps the full $6.75 — but without it the loan may never close and the cluster never gets built. The backstop trades yield for financeability.
- Lenders underwrite the debt assuming the worst case — backstop invoked — at roughly 1.3× DSCR and 70–80% LTV, substituting Nvidia's AA / Aa2 rating for the hyperscaler credit they normally demand.
- The caveat credit desks still price in: vendor-backstop paper sits between IG-offtake DDTLs and unsecured lending, partly because the guarantee is untested — and often terminable in bankruptcy.
- Neither side ever wants it triggered. The backstop price sits below market rent, so a backstop-only project runs an IRR near zero or slightly negative (−2.6% on the illustrative terms) — but even that scenario still services the debt. It's a floor for the lender, not a business plan.
- The scenario grid quantifies the trade: a backstopped 1-year rental book earns a 25.4% project IRR vs 40.7% for the same book un-backstopped — those ~15 points of IRR are the price of being financeable at all.
- What Nvidia gets is bigger than goodwill: it is redrawing the GPU market's financial architecture around itself.
- Old model: sell the GPU once; the entire rental stream belongs to the neocloud.
- Backstop model: keep the hardware margin and take a recurring cut of the rental stream above the floor — what SharonAI's 8-K calls a "revenue-sharing and credit-support model."
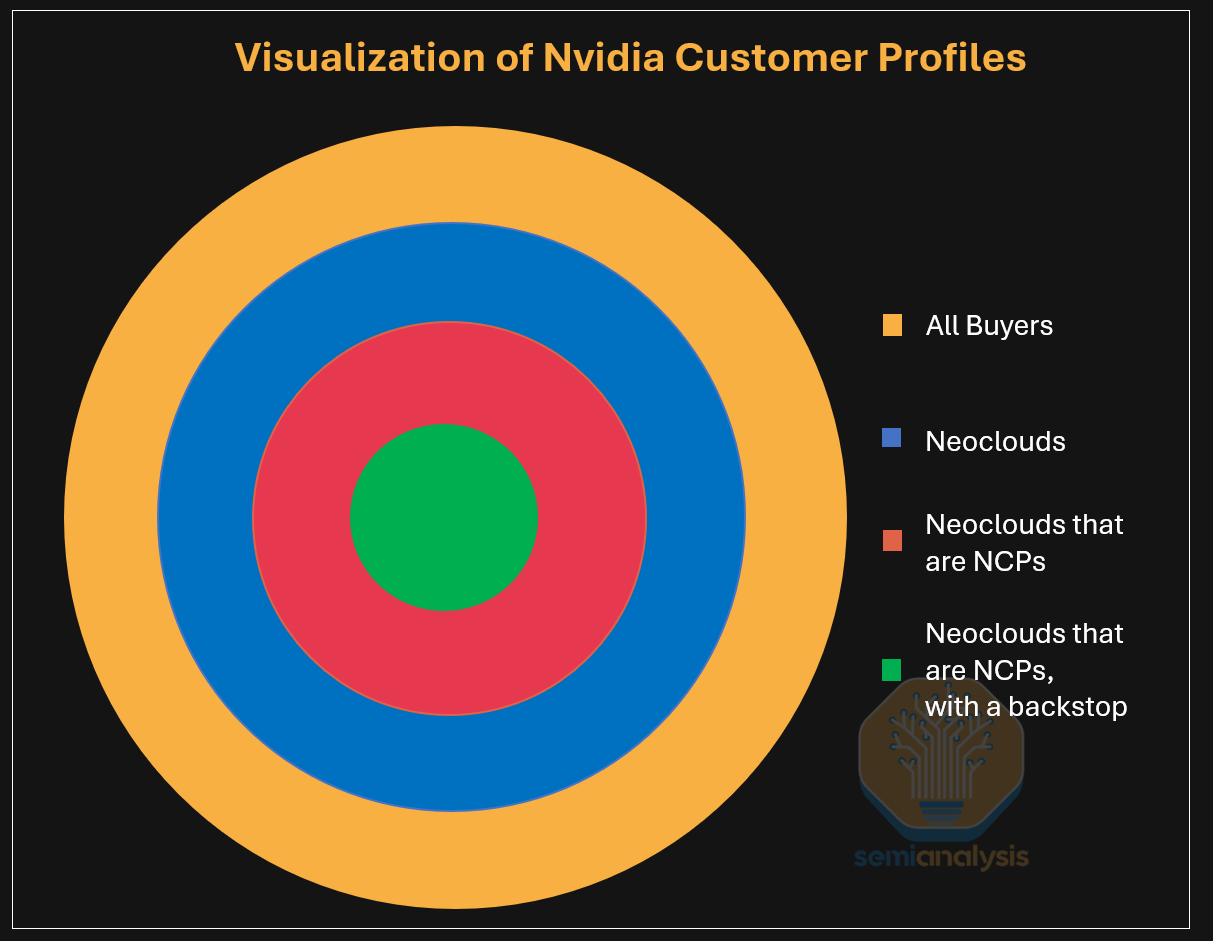
- SemiAnalysis draws it as four concentric buyer pools — all buyers → neoclouds → certified NVIDIA Cloud Partners (NCPs) → NCPs with a backstop. Each narrower pool is more Nvidia-aligned, and each is worth more: hardware margin only at the rim, a recurring claim on rental economics at the core. The backstop is the lever that pulls operators inward.
1) The disclosed cases — both APAC so far
- SharonAI (NASDAQ: SHAZ): a 72 MW AI factory in Australia, up to 40,000 GB300s under a six-year backstop with a disclosed total value of $4.88B — an implied average floor of ~$2.33/hr/GPU. Company-wide it targets a 132 MW footprint (102 MW contracted) and 55,000+ Nvidia GPUs by mid-2027.
- Firmus: a 360 MW AI-factory campus in Batam, Indonesia, built with DayOne (the likely site: Kabil Industrial Tech Park), up to 170,000 chips rolling out through 2027–28, with $25–30B of customer revenue expected over the first six years.
- The step-up is an order of magnitude. Firmus's track record: immersion-cooled H100 clusters in Singapore (seeded by STT GDC, which supplied two legs of the trinity — capital and datacenter — itself), then an 18,000-GB300 cluster in a self-built 42 MW Melbourne datacenter, financed by a $10B facility led by Blackstone and supported by Coatue.
- The Batam campus is multi-tenant and aimed at exactly the buyers Nvidia wants unlocked — AI natives, enterprises and inference providers across varied rental tenors. Separately, Firmus signed a 600 MW firm-energy deal with Gunvor underwriting 1.2 GW of new renewables and 1.5 GWh of storage in South Australia by 2032 — power for which it still needs datacenters.
2) What the program does to Nvidia's own financials
- On the balance sheet, each deal books as a cloud service agreement — a contingent guarantee, off-balance-sheet unless triggered.
- From $30B in FY 1Q27, SemiAnalysis models the line reaching $77.5B by end-FY27 and up to $175.3B by end-FY29 — roughly $5.9B of contingent guarantee per 100 MW backstopped. (Nvidia's fiscal years end in January: FY27 ends Jan 2027.)
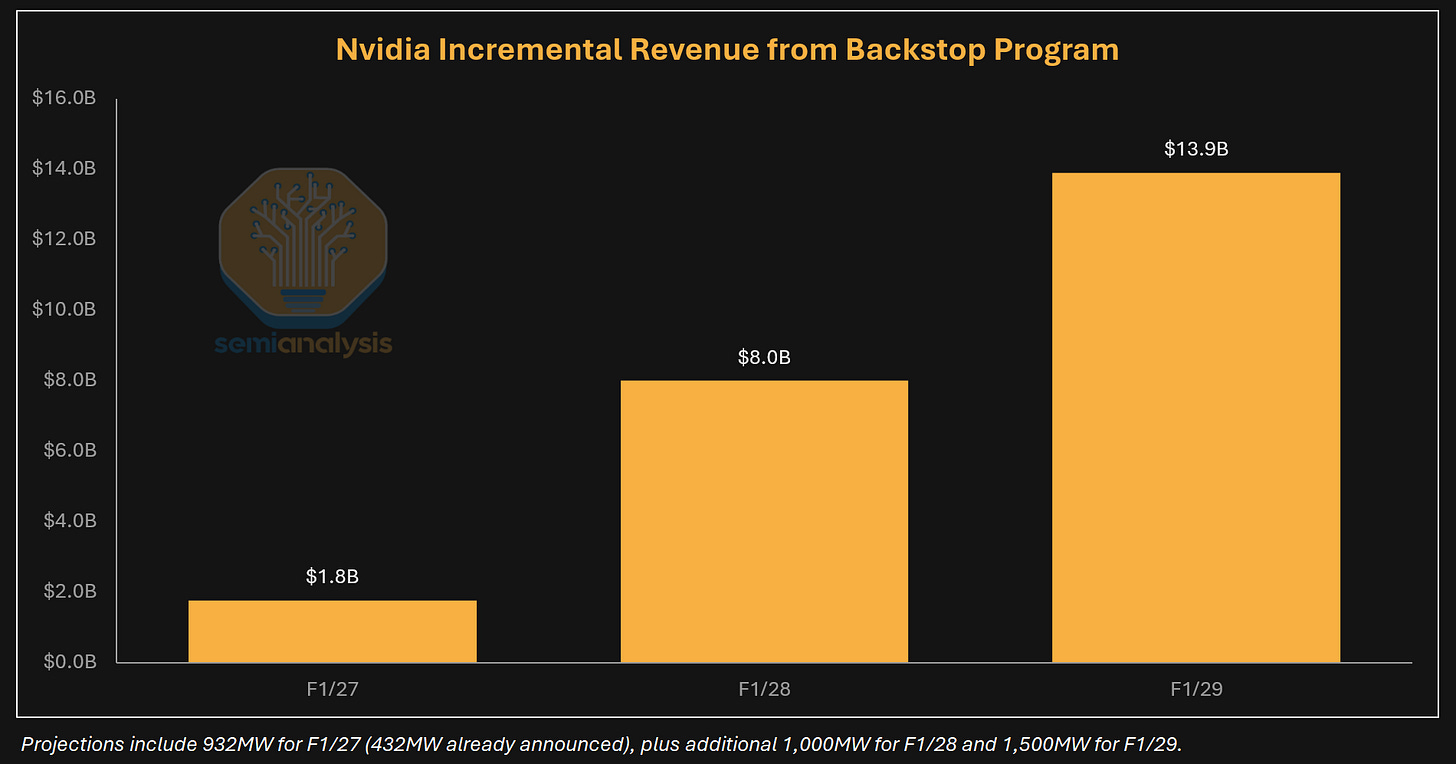
- The buildout assumption behind that: 932 MW under the program in FY27 — 432 MW of it already announced (Firmus 360 + SharonAI 72),
- then +1,000 MW in FY28 and +1,500 MW in FY29.
- On the P&L, the revenue share lands as incremental revenue: $1.8B (FY27) → $8.0B (FY28) → $13.9B (FY29). Small against total revenue, but near-pure margin, recurring over the life of each deal, and repeatable with every new one.
- It also reshapes allocation logic: choosing among hyperscalers, plain neoclouds and backstopped neoclouds, steering supply toward the backstopped pool is the option that pays Nvidia twice.
3) Nvidia isn't the only one running this play
- AMD got there first: since 2025 it has offered AWS, OCI, DigitalOcean, Vultr, TensorWave, Crusoe and other neoclouds a backstop in which the customer commits to more AMD GPUs, and if capacity doesn't sell, AMD stands ready to rent a chunk back on long-term contracts for internal software development.
- Google runs the same playbook for external TPU sales — a credit backstop (e.g. behind Fluidstack's lease obligations at TeraWulf sites) plus datacenter leases.
- In these "backstop wars" Nvidia's job is structurally harder: Google concentrates on Fluidstack and Anthropic, while Nvidia wants to back an entire field of GPU neoclouds.
4) The remaining leg — datacenters
A backstop solves (a) capital and (b) offtake; the (c) datacenter leg still binds, because operators keep preferring hyperscaler covenants:
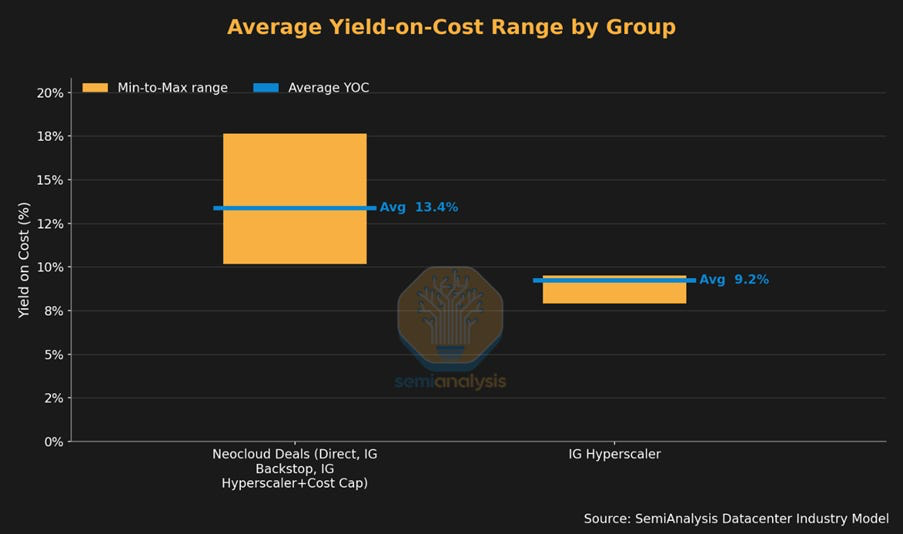
- The price discrimination is measurable: neocloud datacenter leases carry a 3–5% higher yield-on-cost than IG-hyperscaler deals (avg ~13.4% vs ~9.2%)
- The yield difference is a compensation for weaker cashflow certainty and for the punitive terms on neocloud-backed project debt (higher yields, forced amortization or cash sweeps, refinancing windows of ~3 years).
- Nvidia is attacking the leg directly, in two steps.
- Lease guarantees first: its FY 3Q26 10-Q disclosed a guarantee of up to $860M on an undisclosed partner's five-year datacenter lease — $470M escrowed, with Nvidia holding the option to assume or sublease the site on default.
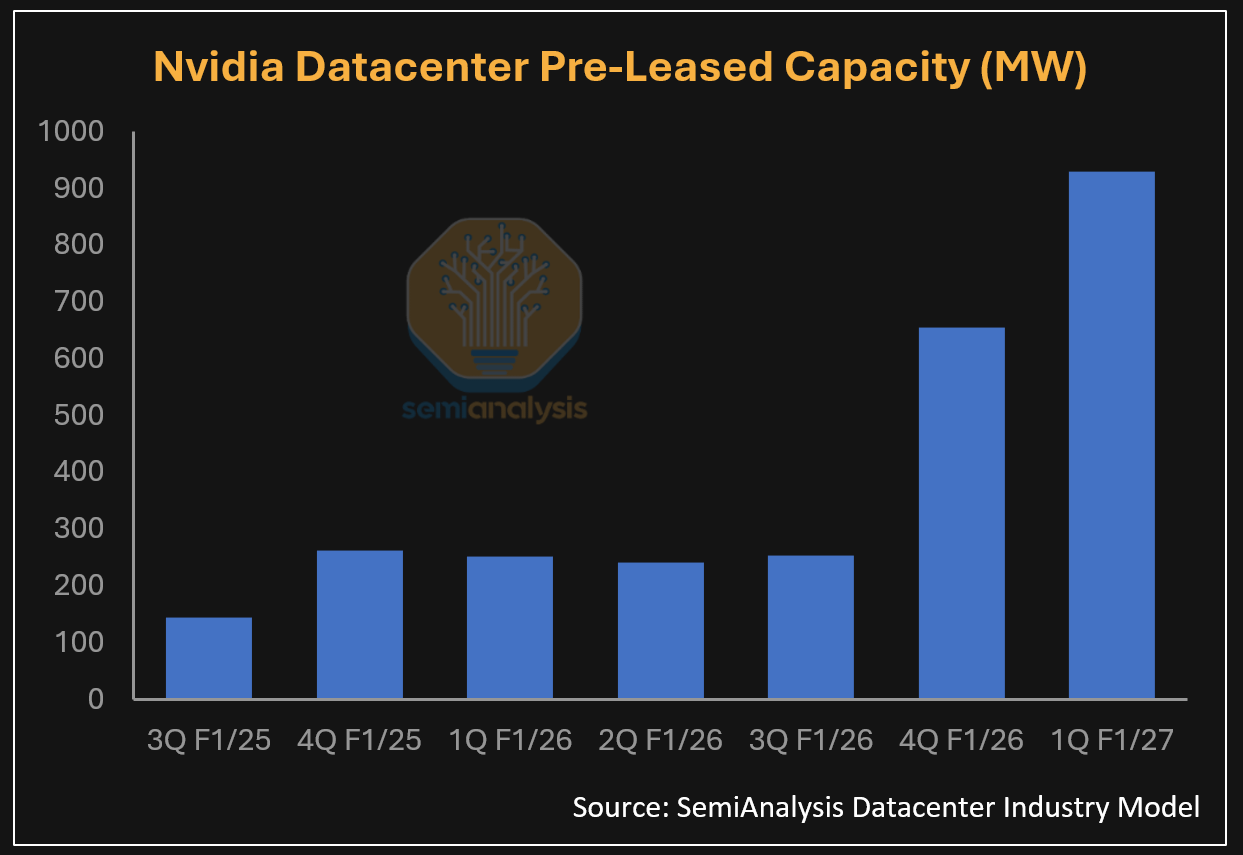
- Now direct leasing: after GTC 2026 Nvidia began leasing large blocks of datacenter capacity itself and subleasing them to neoclouds — over 700 MW signed in the last two disclosed quarters, with multiple GWs in final discussions and expected to close this year.
- Direct leasing collapses the three-party problem (lessor, lessee, backstop provider) into two parties — and centralizes what would otherwise be dozens of bespoke backstop negotiations. It completes the trinity on Nvidia's own credit.
- The regional read-through: neoclouds are now the fastest-growing datacenter customer segment in APAC, and operators like DayOne are repositioning for them — BW Digital's speculative Batam build is suspected to have signed 120 MW with a neocloud.
(6) The VR200 surplus mechanics — why the ecosystem keeps working
- Each generation delivers a performance step Nvidia cannot fully price (antitrust, customer revolt), so surplus passes downstream.
- Rubin does ~2–3× the useful work per GPU-hour of Blackwell, but Nvidia can't raise price to match: pricing out the whole gain would draw regulators and push its mega-buyers onto their own silicon (TPU / Trainium / MTIA / Maia).
- So it under-prices the jump on purpose, and the unpriced portion — the surplus — flows to whoever operates the chips.
- VR200 cost-floor rental ~$4.92/GPU-hr vs value-ceiling vs GB300 ~$9.63–12.25.
- Cost-floor $4.92 = the minimum rate a neocloud must charge to hit target IRR (GPU + power + financing).
- Value-ceiling $9.63–12.25 = the most a customer would pay before it's cheaper to just rent GB300 — set that high because VR200 does so much more work per hour.
- The rentable price sits between them, and the band is ~2–2.5× the cost-to-serve.
- The gap is margin the first-in-line neocloud captures — even if Nvidia raises server prices 40%.
- Whoever gets VR200 allocation first, while it's scarce, charges toward the ceiling on a cost near the floor and banks the spread.
- A ~40% Nvidia server-price hike lifts the floor but the ceiling is so far above it that a fat margin survives — Nvidia takes more and still leaves enough surplus to keep the neocloud loyal and buying the next generation.
- This is the payment that makes §4 self-sustaining — quantified elsewhere as NBIS's ~20% Rev/MW premium for early VR200.
- The catch: it only holds while VR200 is scarce. Once supply catches up, price drifts from ceiling to floor, the band compresses, and the surplus shrinks — the same runway-N question as §2 (5) / §6.
(7) The circularity critique
Nvidia invests in customers who use the cash to buy Nvidia chips, booked as revenue:
- Real as an accounting observation; currently weak as an economic one.
- End-demand indicators are independent of the loop: Oracle GPU utilization 97.5%; CRWV CY26 capacity sold out; H100 rents rising three years post-launch; third-party offtakers (Anthropic, Google) paying market rates for other people's Nvidia fleets.
- The critique becomes decisive only if those independent signals roll over.
5. Meta's Neocloud Transition
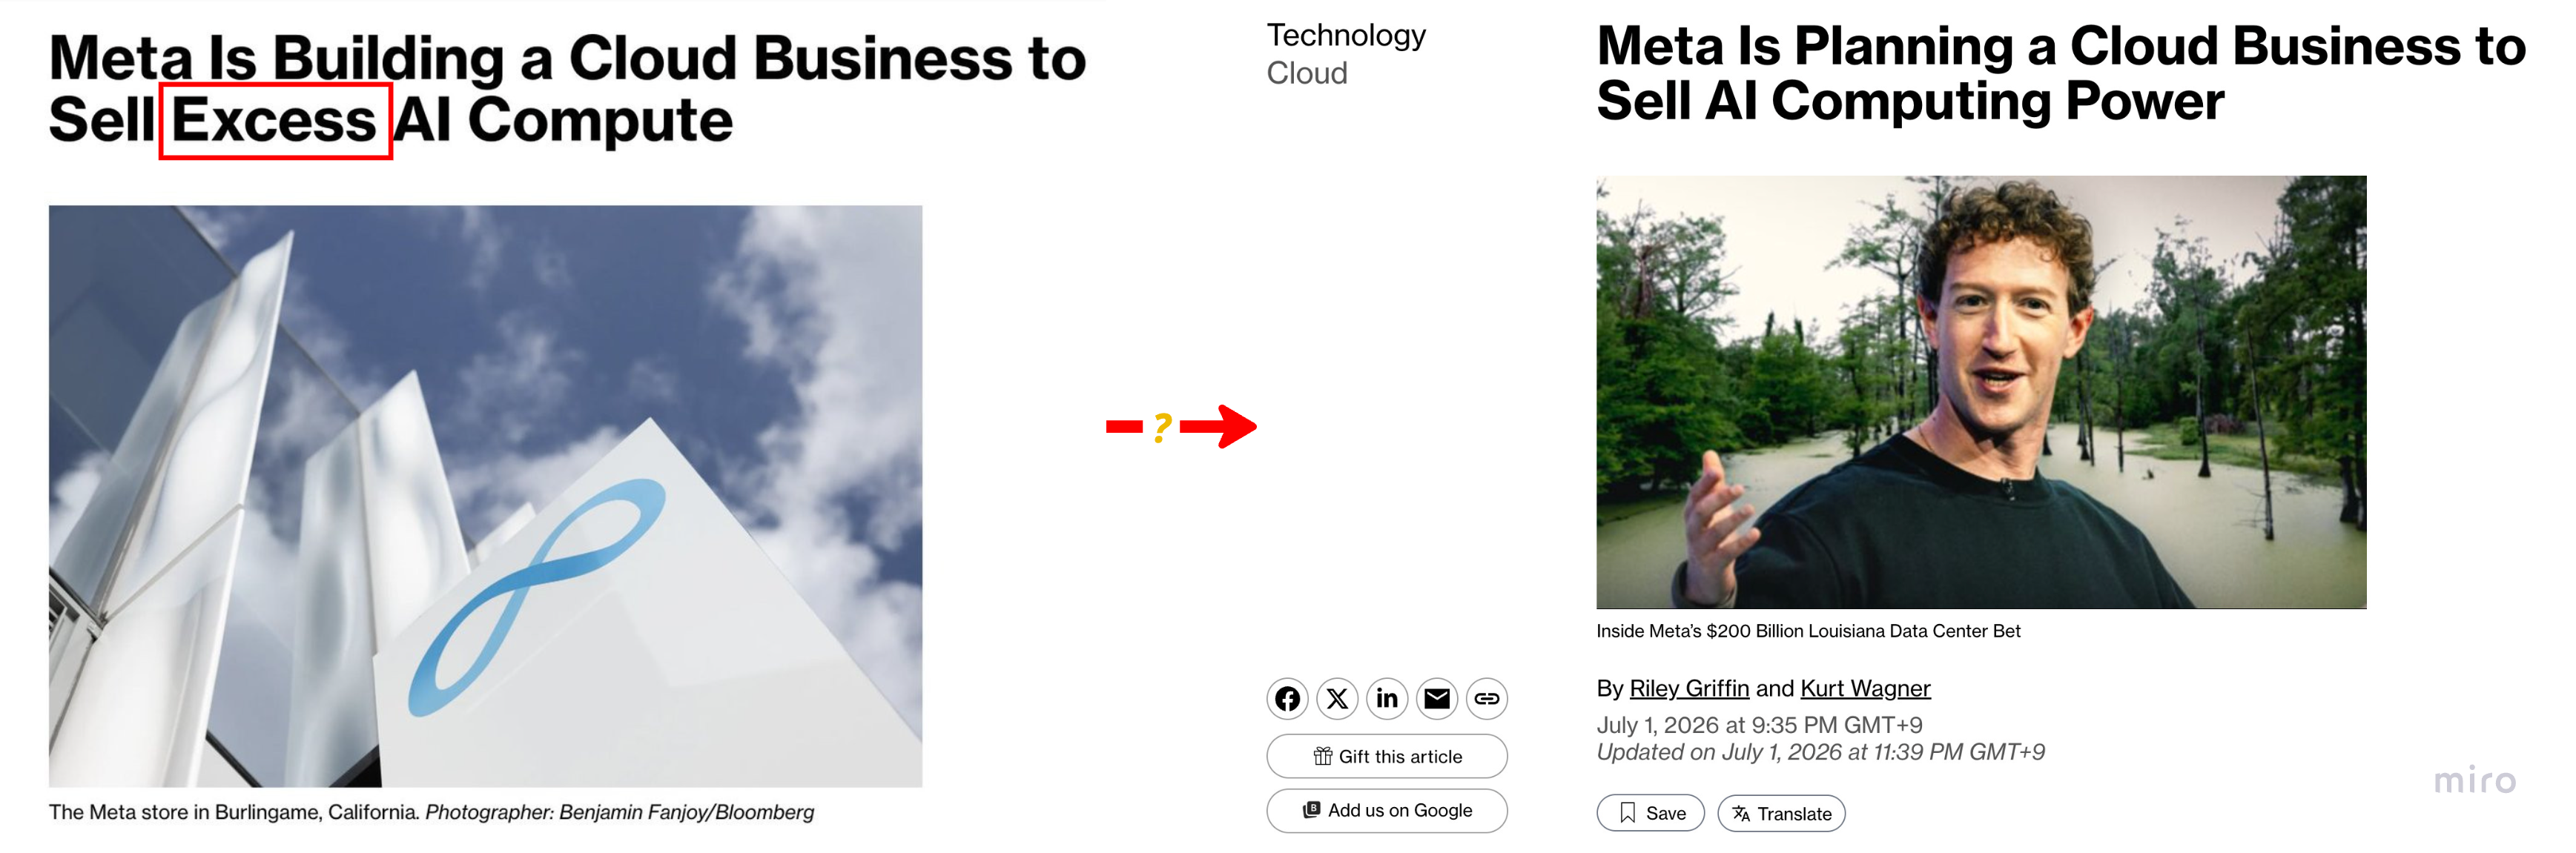
- When Bloomberg reported Meta exploring compute sales, the market's reflex was to sell the neoclouds and revive the "overcapacity" debate.
- Per SemiAnalysis, both reads are wrong: Meta's datacenter and compute procurement is accelerating — over 5 GW contracted across cloud and colo in just the first half of 2026, on top of self-build — and 2027 capex will be "shockingly high."
- Meta becoming a compute seller doesn't cap the merchant layer; it validates it, and Meta stays a huge source of RPO growth for CoreWeave, Nebius and the rest.
The reason Meta can keep contracting so aggressively is optionality — four high-value uses for the same fleet, each far richer than bare-metal IaaS at ~30% gross margins:
- frontier training (Meta Superintelligence Labs remains the core engine),
- RecSys scaled >10×,
- a Bedrock-type token service,
- and SpaceX-style premium deals.
If any one disappoints, the compute redeploys to the next. A CFO's dream: every marginal GW has a buyer, possibly internal.
(1) The new market SpaceX opened — and why only Meta (and Oracle) can enter
- The pricing shock: revenue per MW on SpaceX's deals runs roughly triple (Anthropic) and quadruple (Google) what peers charge — and since the cost structure is roughly the same, the profit per MW gap is even wider.
- The Google deal prices above even the on-demand / short-term rental market — not a discount to spot, a premium over it. SpaceX effectively invented a new market segment: large-scale on-demand compute at a huge premium.
- A deal this large and this short has never existed: three years on paper, but with bilateral 90-day cancellation — effectively a 3-month deal with automatic renewal.
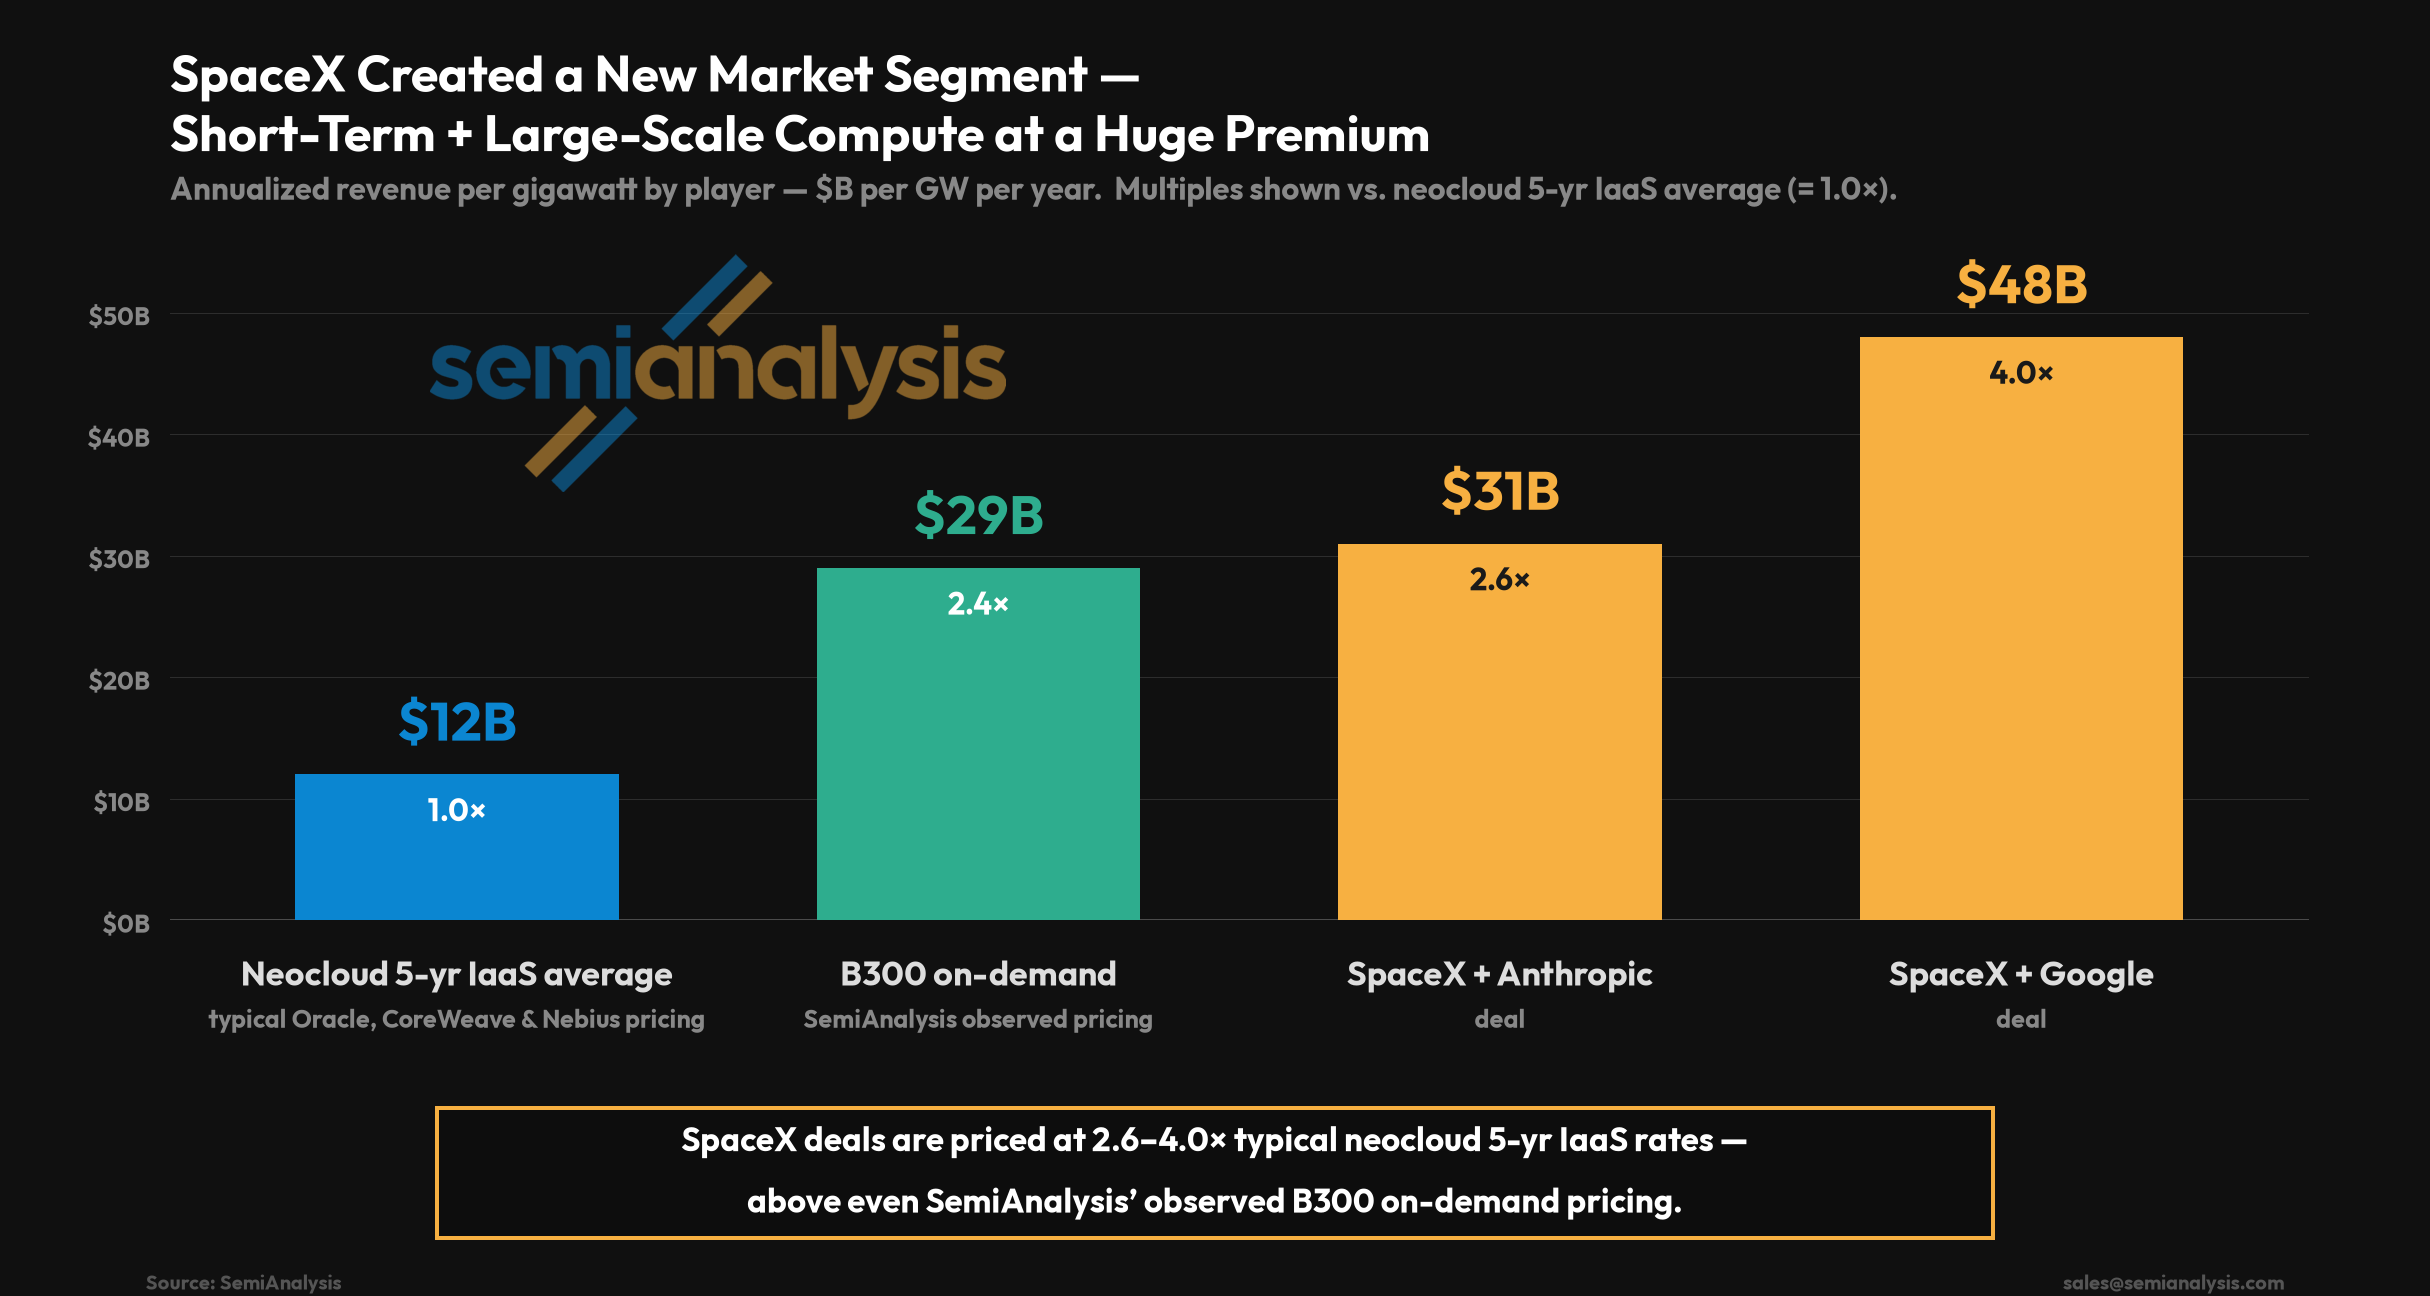
Why it never existed — the financing filter:
- Neoclouds cannot sell this product. Large clusters only get financed against multi-year offtakers (the whole §2 bankability chain); a 90-day-cancellable contract is unfinanceable collateral.
- And the top-3 hyperscalers could do it but won't — each sees a higher-value long-term option (Microsoft: OpenAI IP via equity + compute; Amazon: Bedrock + Trainium adoption; Google: TPUs + Vertex/Gemini Enterprise).
That leaves exactly two players: Oracle and Meta.
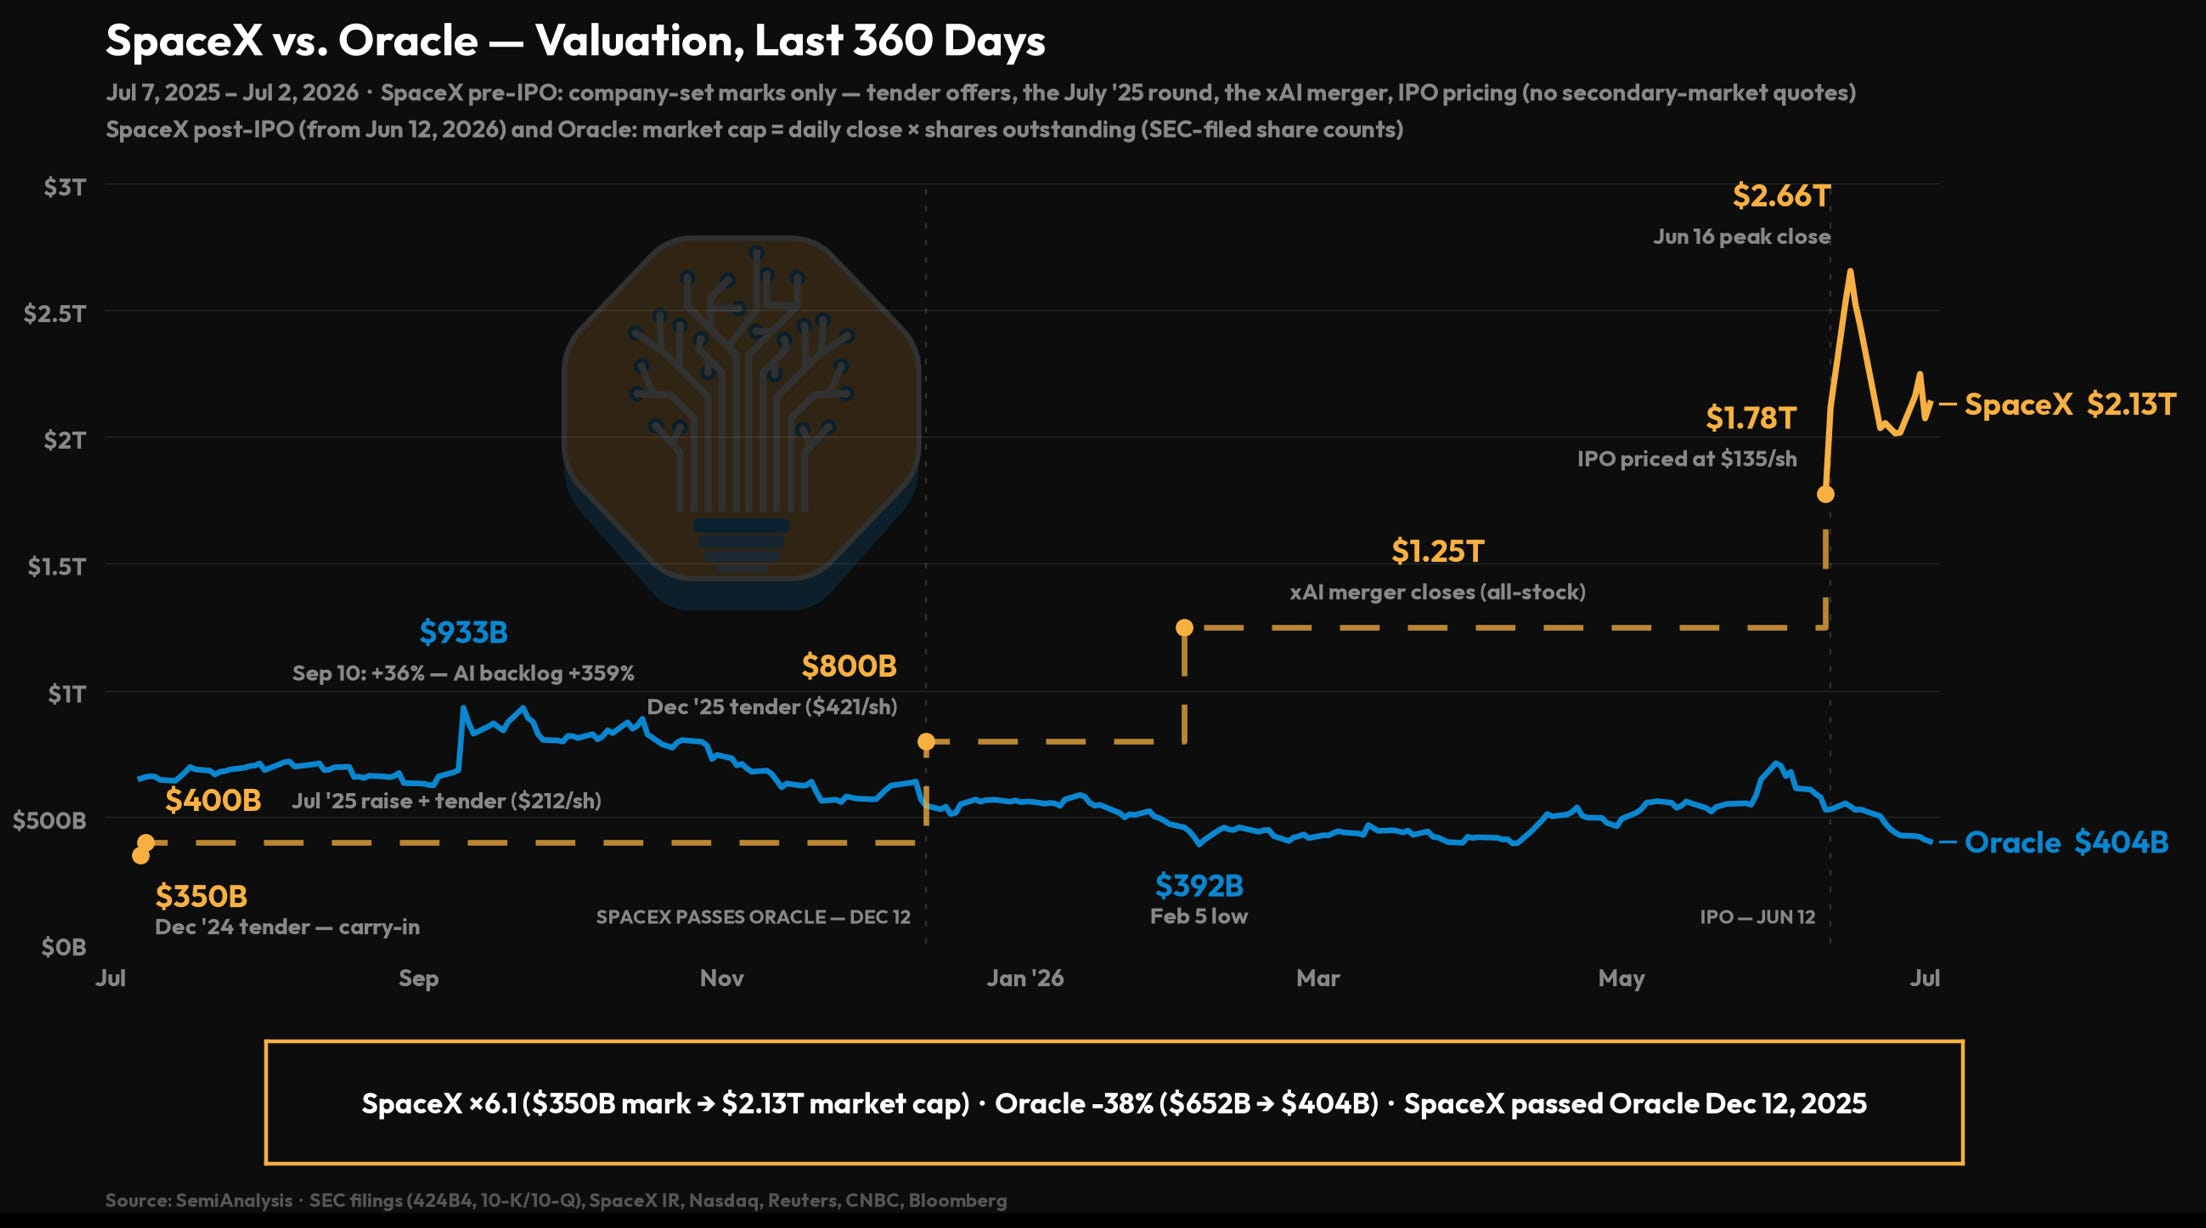
- For Oracle it reads as an indictment — more evidence it under-monetized its gigawatts, visible in the Oracle-vs-SpaceX valuation divergence as gigawatts became a growing share of both valuations.
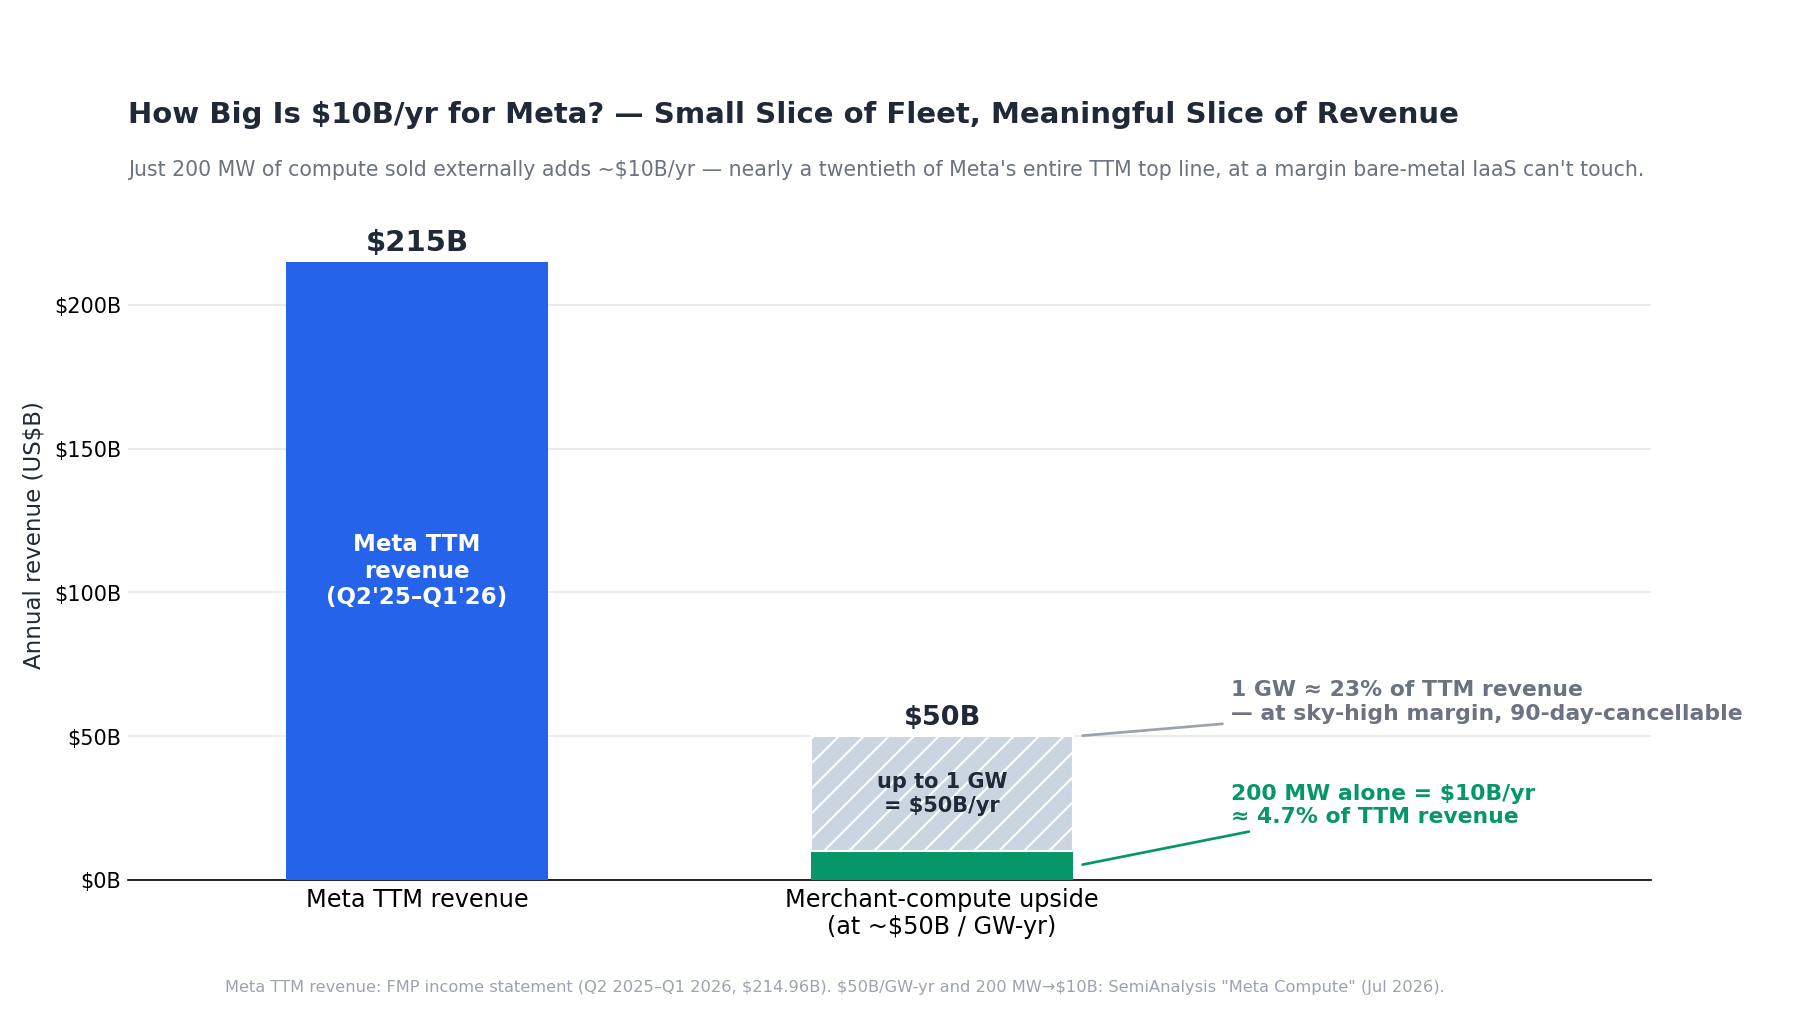
- Meta's math is trivial: at ~$50B per GW of annual revenue, allocating just 200 MW to an external customer drives ~$10B/yr at sky-high margin — roughly 4.7% of Meta's ~$215B TTM revenue (a full GW would be ~23%), and at a margin bare-metal IaaS can't approach. And the 90-day out makes the decision reversible — if MSL needs the compute back, Meta can claw it back on short notice.
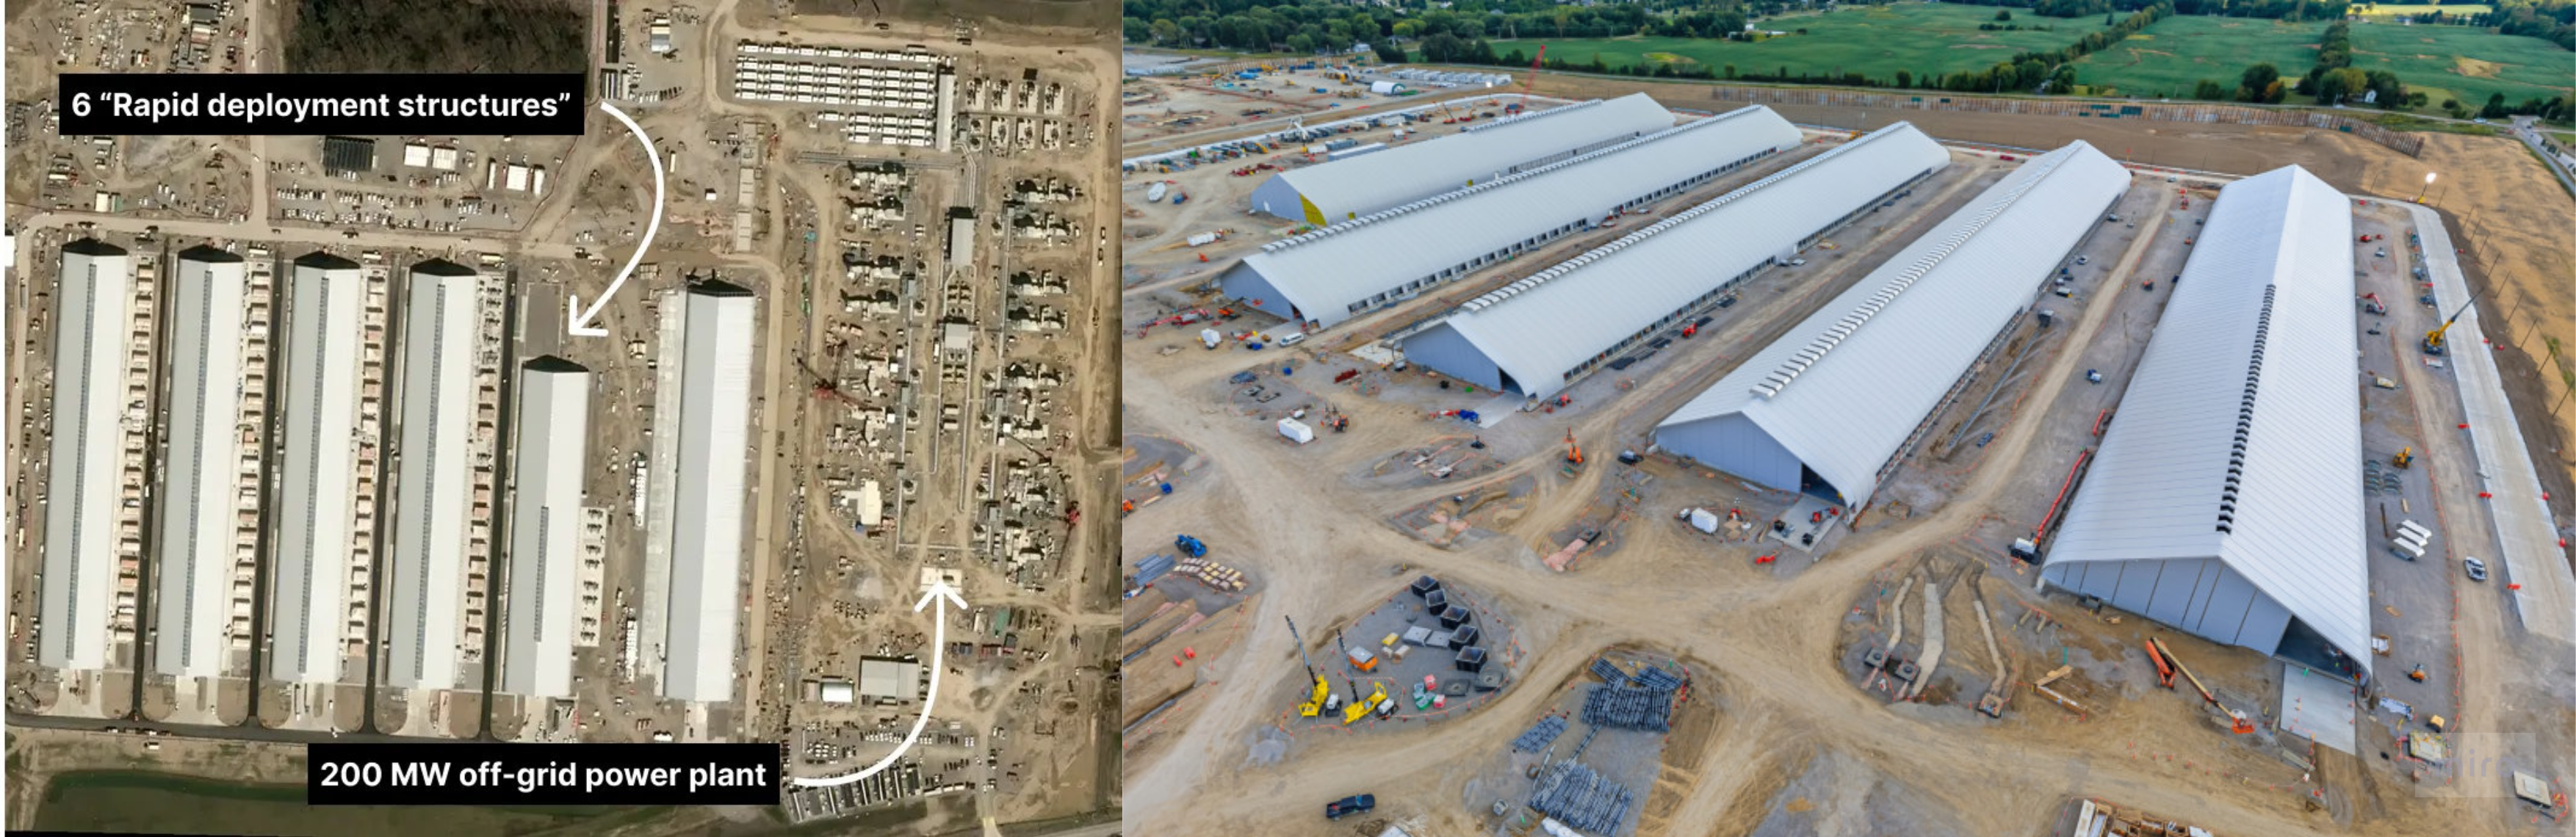
- The strategy also fits Meta's "tent" ultra-fast datacenter design — capacity built fast, even if "lower quality," is exactly what a premium on-demand product monetizes.
- Expect a deal announcement to start the flywheel — Anthropic is the prime suspect (~$10B), with OpenAI or Google as alternates.
(2) Bedrock 2.0 — selling Claude on Meta's compute
Per SemiAnalysis, Meta is in final talks with Anthropic for private instances of Claude — the analog of AWS Bedrock, Azure Foundry, Google Vertex. Three main paths for the partnership:
- Internal usage. Meta needs Claude tokens and Anthropic can't keep up with demand; private instances add the security and privacy layers a deployment inside Meta's own datacenters requires. (The same template could extend to other giant enterprises — a JPMorgan won't go all-in on Claude without private-instance guarantees.)
- Claude-as-a-service. Meta owns the full stack — CPU to GPU to networking, with high security — and could sell Claude the way AWS's Bedrock does. The gap: as a new entrant it lacks AWS's enterprise relationships. The lever: its advertiser base as a distribution channel, integrating frontier agents into the ads suite.
- Go vertical — build the applications. As one of the world's largest ad platforms, Meta has a credible path to a frontier-agent-powered Sales & Marketing powerhouse — moving up the stack rather than reselling tokens.
There's also the broader distribution option — models served to free social users and the device ecosystem (glasses).
The read-through: Meta's distribution and network effects are strategic enough that OpenAI and Anthropic are likely willing to make concessions for a piece of it.
(3) RecSys — the proven engine underneath it all
The key AI story at Meta is that recommendation systems are driving revenue acceleration at massive scale — the non-MSL fleet is already producing outstanding ROI. In late 2022 the market priced Meta as mature and low-growth; GPU investment flipped that:
- Ads RecSys: models got bigger and costlier to run but much smarter — advertisers pay higher prices while still seeing strong ROAS (the yield lever).
- Content RecSys: better feeds → more time on platform across the Family of Apps → more monetizable surface → strong impressions growth (the volume lever).
Why RecSys now scales with compute (the category shift):
- Ad ranking used to run on DLRMs (deep-learning recommendation models), which don't follow the LLM-style power laws — more compute didn't buy better ranking.
- Meta's HSTU (Hierarchical Sequential Transduction Units) reformulated ranking as sequential prediction, which does scale with compute — beating prior baselines by ~66% on ranking metrics.
- Productionized as GEM, Meta's ads foundation model:
- 4× better ad-performance gains per unit of compute;
- a training stack with 23× effective training FLOPs at ~1.4× MFU using 16× more GPUs.
The ROI already on the tape:
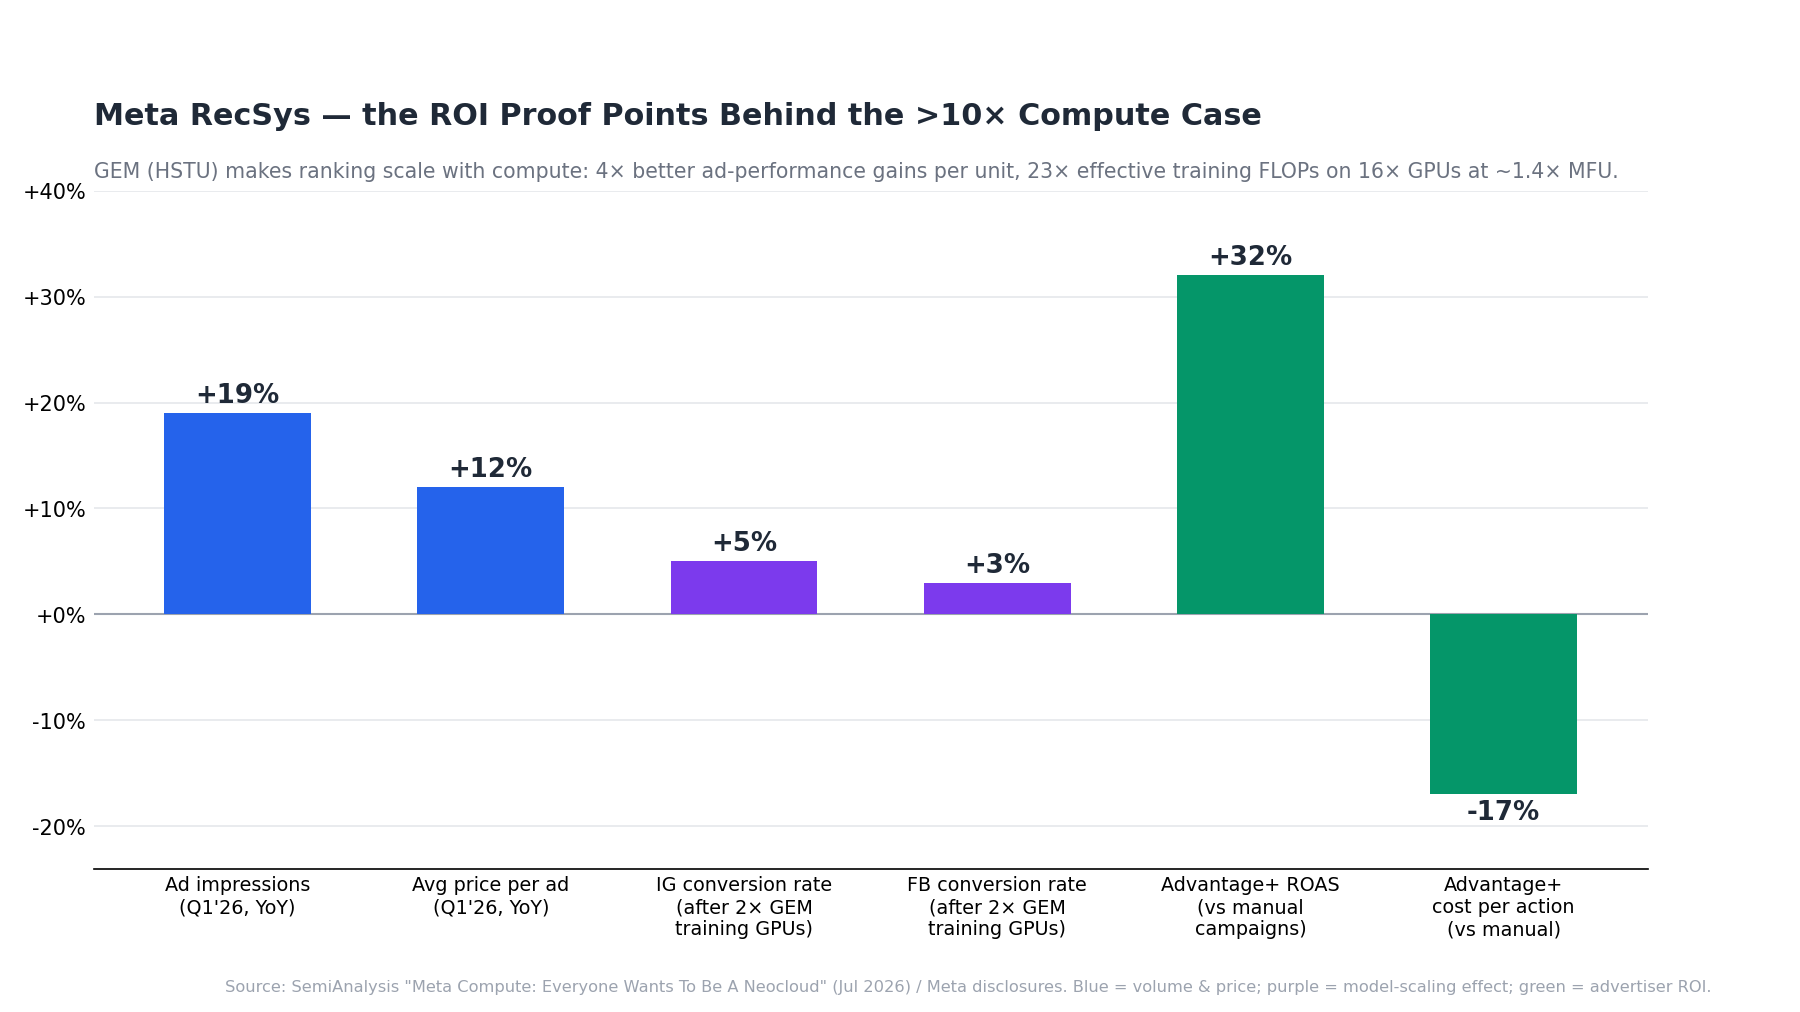
- CY 1Q26: ad impressions +19% YoY, average price per ad +12% YoY.
- Doubling GEM's training GPUs lifted conversion rates +5% on Instagram, +3% on Facebook.
- Advantage+ Shopping delivers +32% ROAS at −17% cost per action vs manual campaigns.
Why it's sustainable:
- Meta can grow ad revenue by showing more ads or charging more per ad — and ad load has a ceiling before it damages the user experience.
- But as long as ROAS grows with CPMs (which it has), advertisers rationally absorb higher prices, so yield keeps climbing even as impression growth meets the ad-load ceiling.
- That's why SemiAnalysis believes Meta can profitably absorb a >10× increase in AdRec compute — each additional gigawatt maps directly to better predictions on both training and inference.
(4) Meta Superintelligence Labs — another dropout, or a real threat?
- The bear syllogism:
- compute is the lifeblood of every AI research org — Anthropic would never sell compute to a competitor — therefore Meta selling compute means MSL has conceded. Too simplistic.
- There is a world where you temporarily sell compute to your fiercest competitors and still become a true frontier lab. Elon wrote the playbook.
- The SpaceX / Cursor read (the most likely explanation for the ~$60B acquisition):
- Elon and Cursor are both still serious about superintelligence — Cursor's messaging shifted over six months from "best AI coding experience" to "we want to build RSI". That's frontier-lab ethos, not a wrapper startup.
- SpaceX retains up to ~900 MW after its offtakes — enough for genuine shots at the frontier (GPT 5.6 and Fable 5 were likely trained on less).
- The 90-day bilateral cancellation is the crux. The market read it as buyer-friendly (Anthropic/Google can walk if they find cheaper compute) — but it equally means Elon can claw back every megawatt if the Cursor team delivers.
- If they fail, SpaceX settles into being a very large, very profitable CSP; the only true cost was the unmonetized GPU-hours spent chasing RSI.
- Meta is running the same play with MSL — with even more fallback: RecSys and token-as-a-service compute can be repurposed back to research at any time. Compute, data, talent — Zuck has put up capital to be world-class at all three, which no other hyperscaler has done.
- The one HUGE IF — the tell to watch: if Meta ever signs a compute deal without a SpaceX-style early-cancellation clause, the optionality story dies — locked-away compute can't come back to MSL, and MSL is actually cooked. Until then, selling compute and chasing the frontier are the same strategy, not opposites.